Where did all the UK equity income funds go?
The number of UK equity income funds trading at 52-week high discounts has fallen from seven to zero in the space of a month. The Deep Dive takes a closer look to find out what’s behind the turnaround.
ByFrank Buhagiar•24 Apr, 2024•

Week ended Friday 22 March 2024, we counted 32 investment companies that were trading at year-high discounts to net assets. Of these, no fewer than seven belonged to the Association of Investment Companies’ (AIC) 20-strong UK equity income sector. Barely a month on and the number of UK equity income funds on the Doceo Discount Watch list stands at zero. Where have all the UK equity income funds gone?
Why were they there in the first place?
In UK Equity Income Trusts – was it something the Chancellor said?, a number of reasons behind the sector’s strong showing on the Discount Watch List were put forward – the Chancellor’s Spring Budget, underlying UK markets and the performance of the funds themselves. The conclusion? Not much in the Budget for UK equity income funds to concern themselves with apart from a possible small boost arising from the proposed British ISAs. Meanwhile at the time of the article, UK equity markets were only marginally down for the year. As for how the funds themselves have been performing, only two had reported results this year. So, no mass underperformance to report. And the two funds that have reported, have largely performed well. Something else at work, it seems.
According to Winterflood, that something else has been Gilt yields. Writing in its February monthly summary of the sector, the broker had this to say: “Investment Trust sector average discount at 29 February was 15.9% vs 14.2% at 31 January, 12.9% at the end of 2023 and 11.3% at the end of 2022. Discount moves remain closely correlated with Gilt yields, with the sector discount widening so far this year coinciding with a rise in yields. The vast majority of sub-sectors were de-rated last month, with still none trading at a premium at the end of February”.
As for the mechanics behind the correlation between Gilt yields and investment company discounts, when risk-free Gilts yields rise, the yields of other asset classes, particularly those competing for the investor’s pound, such as UK equity income funds, rise too in order to remain attractive. Assuming dividends remain constant, share prices need to fall for yields to rise. And assuming net assets remain constant, as share prices fall, discounts widen.
So rising Gilt yields most likely behind the discount pain seen in the UK equity income sector in Q1 2024. It therefore follows then, that falling Gilt yields could well be the trigger for a narrowing in discounts across the sector.
According to Winterflood’s monthly summary for March 2024 10-year Gilt yields did fall, by 19bps to 3.93% over March, 10-year Treasury yields decreased by 5bps to 4.20%, and 10-year Bund yields fell by 11bps to 2.30%.
Gilt yields fall, discounts of UK equity income funds narrow. The sector’s representation on the Discount Watch all but disappears. Or, so you’d think.
As at week ended Friday 29 March, there were still six UK equity income funds trading at 52-week high discounts.
What’s more since 31 March 2024, UK Gilt yields have risen – as at Tuesday 16 April 10-year UK Gilts were yielding around 4.3%. And yet, the number of UK equity income funds continued to fall steadily. So, what’s going on? Buoyant markets perhaps? A look at the below graphs for the FTSE 100 and FTSE 250 for the month of April so far shows something of a mixed bag.
FTSE 100 first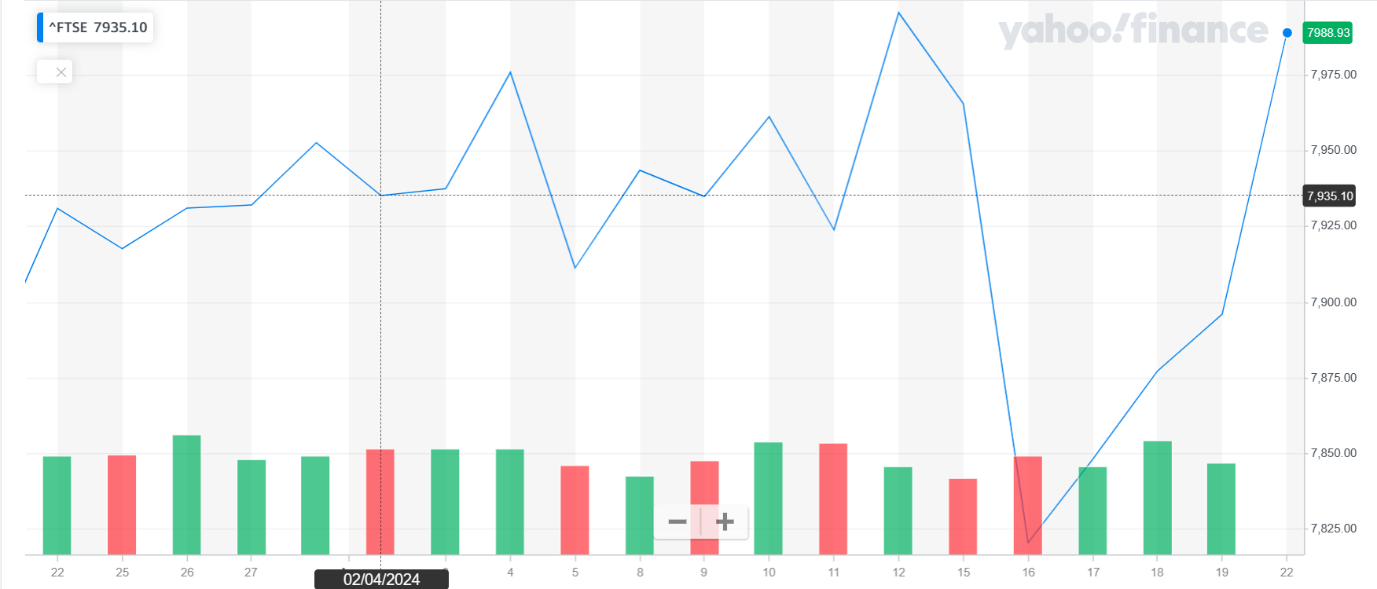
Followed by the FTSE 250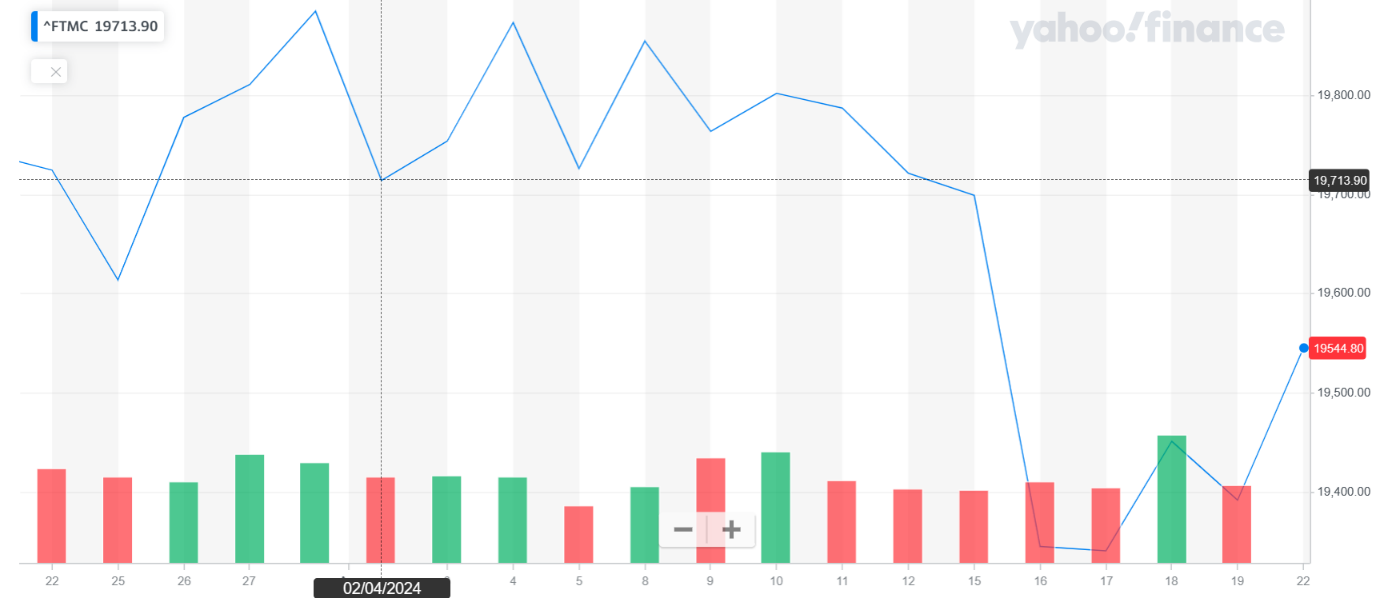
The FTSE 100 marginally up. The FSTE 250 down.
So, what’s the cause?
April saw a flurry of results from UK equity income funds that have been on the Discount Watch in recent weeks:
• Dunedin Income Growth (DIG) – on 4 April, DIG unveiled an NAV total return of +6.7% for the year ended 31 January 2024. Not only did this beat the FTSE All-Share’s +1.9%, but also all the other trusts in the AIC UK Equity Income sector.
• Merchants (MRCH) – another to report on 4 April. The fund posted a -3.1% NAV total return for the year, a little off the FTSE All Share’s +1.9%. However, over the longer-term, MRCH’s track record still stacks up well having outperformed the benchmark and the sector average over three and five years. The fund also announced a 42nd consecutive annual dividend increase.
• Temple Bar (TMPL) – TMPL clocked up an impressive +12.3% NAV total return for the year ended 31 December 2023 comfortably ahead of the FTSE All Share’s +7.9%. The company reported on 3 April.
• JPMorgan Claverhouse (JCH) – on 21 March JCH announced a +7.3% NAV return for the full-year, almost matching the benchmark’s +7.9%.
• Murray Income (MUT) – on 06 March, MUT reported a +4.5% NAV per share total return (with debt at fair value) and a +6.2% share price total return for the six-month period ended 31 December 2023. That compares to the FTSE All Share’s +5.2% over the same timeframe.
• City of London (CTY) – on 16 February, CTY announced a +6.5% NAV total return for the six months to 31 December 2023. As with MUT above, a better outcome than the index’s +5.2% over the same period.
• Law Debenture (LWDB) – another to outperform. As reported on 27 February, the fund’s NAV with debt and the independent professional services business at fair value delivered a return of +9.4%, while the share price total return came in at +8.1% for 2023. The FTSE All share by contrast delivered a +7.9% total return.
Out of the above seven funds that have posted results, six outperformed over the relevant reporting periods. All in all, a decent set of results from the sector. What’s more, as a collective, UK equity income funds have delivered during a high interest rate environment. And while yields across the sector may not, at this particular moment in time at least, quite match those of other asset classes such as fixed interest or cash, the capital returns generated by the majority of funds appear to have gone some way to making up the difference.
In answer to the question, where have all the UK equity income funds gone? Onward and upwards it would seem.
Leave a Reply