Although u know u shouldn’t as it can make an ass out of u and me
When u retire u intend to take out an annuity, that assumes the market hasn’t crashed just before u buy or that interest rates aren’t near to their low.
The present day proposition.
By Sam Benstead from interactive investor
How much do annuities pay ?
Annuity rates are typically greater than gilt yields, as investors pay a lump sum and generally do not receive their money back at the end of their annuity policy. Annuity rates are higher for older buyers and lower for younger buyers, as the length of the term will likely be longer.
A standard single life, no-guarantee annuity rate for a 65-year old is now around 7.13%, or £7,130 a year per every £100,000 saved, according to Sharing Pensions, an annuity comparison site.
This means that a £500,000 lump sum would deliver an income of £35,650 a year until death, with no link to inflation. Annuity rates will vary depending on the provider, the age of the customer, and changes in interest rates.
In contrast, a gilt maturing in 20 years – which would be a typical annuity length for someone retiring at 65 and living until 85, yields 4.5%. This means £500,000 invested in a bond issued by the UK government, trading at its par value, would deliver an equivalent income of £22,500 a year. But at the end of the 20-year term the owner would also receive their £500,000 back. The total profit delivered by the gilt would be £450,000 (£22,500 multiplied by 20).
On the other hand, the annuity would have paid out £713,000, but minus the £500,000 cost of the plan, this would only be a profit of £213,000 – that’s an equivalent annual yield of about 2.15%.
Buying a gilt therefore could offer a substantially better return, with the advantage that it can be sold at any point in the term, which may be triggered by an early death. Annuities don’t come with the same advantage, and deliver a worse return for a typical life span. All subjective to your tax position.
££££££££££
The capital sum of a gilt is only guaranteed if u hold to maturity, if u sell earlier u may not get back all of the amount invested but considerably more than zero.
A journey of a thousand miles begins with a single step.
Lao-tzu
Provided by The Motley Fool
What makes for a good investor ? Story by Malcolm Wheatley
Over the years, I’ve seen good investors, and bad investors. And an awful lot of average investors.
But what is it that differentiates a good investor from an average investor? Or a bad investor?
Some quite simple things, actually.
Good investors have a strategy
We’ve all seen them. “Magpie” investors that just pick up shares on a whim — a Sunday newspaper tip, a share that someone from the golf club recommended, a supposedly hot initial public offering, and so on.
There’s usually not much more to say about the resulting mess except to note the fact that it is, well, a mess.
Better by far to have a strategy. And even better to stick to it.
What might such a strategy be?
Investing in growth shares might be one such strategy. Investing for income might be another. Investing for global diversification might be another. Investing in resources and energy shares might be another.
And so on, and so on.
Good investors choose metrics that match their strategy
How are your shares doing? Ask this, and you’ll hear some awful answers.
“Dog Star Dynadrive is up 80%!” they’ll gush. Yes, but all your other shares are down 10%.
“Not so good: the dividends are really, really poor.” But what do you expect? You’re invested in growth shares. Some of your shares don’t even pay a dividend.
“The market seems very volatile at the moment.” I’m not surprised: you’re only invested in three shares.
“My portfolio is up 30%!” Yes, but over the same period, the market is up 40%.
And so on, and so on.
If you’re pursuing income, measure — and report on — income. If you’re pursuing growth, measure — and report on — that growth. If you’re only investing in oil shares, measure yourself against the overall oil sector.
And measure yourself against the market, or against a relevant sub-sector of the market. Simply being ‘up’ is not good enough: are you beating the market, and by a reasonable amount? Otherwise, a cheap — and probably better diversified — index tracker might serve you better.
Good investors are opportunistic
Warren Buffett summed it up best: in the long term, the market is a weighing machine — but in the short term, it’s a voting machine.
Meaning that individual shares — or market sectors, or even whole markets — go in and out of fashion, and experience buoyant conditions, or not so buoyant conditions.
So when shares go ‘on sale’, these investors are prepared to buy. It might mean some short-term pain — and often does, in my experience — but market conditions, and market opinion, eventually change.
Leaving investors sitting on assets bought at attractive prices, and income streams larger than they would otherwise be. I’ve noted before my opportunistic purchases of Shell: £12.95 in 2016, and £13.40 in March 2020. They’re now over £28. And let’s not even mention the dividends.
Good investors invest for the long term
Good investors — as opposed to traders — are in it for the long term.
They understand that investing returns compound over time. They understand that timing the market is very, very difficult, and that it’s often better just to take a long-term view. And they understand that it’s perfectly natural for the market to go up and down, and that it’s better to simply ride out such fluctuations.
They don’t expect to get rich by next Wednesday. They don’t panic and sell out when the market turns down. And — wherever possible — they buy shares that are able to withstand economic downturns and adverse conditions.
How long is ‘long term’? Longer than five years. 10 or 15, at a minimum. And because they’re investing with long-term goals in mind — retirement, or early retirement, say — they’re sanguine about an investment horizon of 20+ years.
So there we have it
Do you recognise yourself in the above? Perhaps not
But would you like to recognise yourself in the above
You know where to start.
The post What makes for a good investor? appeared first on The Motley Fool UK.
What next for investors? A more dynamic approach to markets can pay off
Trying to time markets and dynamically allocate between assets like equities and bonds is tough, and most managers fail. However, Charles Ekins of boutique firm Ekins Guinness has a solid record of being active and dynamic in calling market highs and lows. With US equities at record levels and most equity investors bullish, what does Ekins think we should do now?
By David Stevenson
Charles Ekins of Ekins Guinness has been operating as a fund manager for nearly 7 years with a very distinctive approach. The two small funds in his stable are run systematically, with a rules-based model, starting with a top-down asset allocation and then investing in different asset classes, geographies and sectors through low-cost ETFs. The firm’s value and momentum approach avoids style bias, as the investment focus changes according to market conditions and opportunity.
The Ekins Guinness approach seems especially appealing to investors looking to participate in the upside from rising equity markets but seeking a fund that can go very defensive if a bear market is expected. Ekins says the main reason why investors might adopt a dynamic asset allocation strategy is that their funds aim to have significant allocations to equities in a bull market but do not want to leave investors stuck with high equity exposure in a bear market. Since launch, it has also been ahead of all four IA Mixed Asset Sectors (Flexible, Mixed Investment 0-35%, 20-60% & 40-85% Shares) and in the first quartile over 1,3,5 years of all 624 funds in these four IA Mixed Asset Sectors.
In sum, Ekins is perfectly positioned to give investors a big picture of asset allocation, market bubbles, and the risks and opportunities of investing in risky assets such as US equities. I caught up with Ekins earlier this week, and what follows is Ekins take on bullish equities, all with a strong data driven, charts heavy approach.
Fundamental value determines the potential over the medium/long term but can be a poor indicator of price movements in the short term. Market trends (including momentum and overbought signals) can be a good leading indicator of future price movements but can be dangerous if fundamental value is ignored. Neither analytic should be used in isolation, but it is logical to select investments based objectively according to a combination of fundamental value and market trends, which are independent of opinion, forecasts and emotion.
You have a data-driven approach that combines a technical viewpoint with financial factors — what does this actually involve?
Fundamental value determines the potential over the medium/long term but can be a poor indicator of price movements in the short term. Market trends (including momentum and overbought signals) can be a good leading indicator of future price movements but can be dangerous if fundamental value is ignored. Neither analytic should be used in isolation but it is logical to select investments based objectively according to a combination of fundamental value and market trends which are independent of opinion, forecasts and emotion.
Can investors and fund managers ever hope to time markets?
Of course, but one needs a method. Most people say you can’t do market timing: they say it can’t be done with a portfolio of stocks because the trading costs are too high). Or it can’t be done using bottom-up company research (which is the main focus for most managers). It’s also tricky using econometric models or geopolitics. It can be done all the time using trend-following metrics. CTAs, or commodity trading advisors, are the largest subset of hedge funds and successfully use Trend Following to go long/short. CTA is effectively market timing. To make it work, it needs to be simple and systematic, not based on opinion, emotion, or forecasts. In our view, its better to add Value scores – risk measures – as it’s dangerous to follow trends (like CTAs do) without a Value check. Welcome to the world of Ekins Guinness!
What’s your attitude towards US equities? Are they overpriced? Should investors be internationally diversifying away from heavy US exposure in global indices?
The US has become relatively expensive but has the best momentum – which is more important. US Value Yield – our measure of the fundamental value of a market – has not become so extreme that it is an immediate concern. But we are in the danger zone so we might reduce that exposure as soon as momentum deteriorates. Most other regions have poor relative momentum. Then again, the US has been relatively expensive for a while, mainly because the Cash Earnings Yield is very low. But following momentum in the US has paid off.
Are tech stocks generally in a bubble in valuation terms, or is positive momentum still strong?
The Technology sector displays strong positive momentum versus World Equitiesand it is not overbought. On one of our preferred measures, called the Relative Value Yield, the tech sector is negative (growth sector) but is in the middle of its 20-year range.
Is the UK market cheap? And Japan?
The UK is strong in absolute terms but disappointing in relative terms whereas Japan has been strong in relative terms but is possibly flagging (and not to have hedged Yen is a disaster). The UK is relatively cheap versus World Equities and within the context of its history. But it’s been cheap for a while and has underperformed significantly over the last 7 years
Have you been increasing or decreasing your exposure to equities vs bonds?
Our Asset Allocation model started to reduce the Equity weighting from 100% in late March largely because of one of the measures, the Equity Value Yield. We had similar valuation risk concerns in late 2021 (ahead of the 2022 bear market). As for other asset classes, Gold and Commodities are more attractive than Bond markets. Our view is that bonds are not attractive. Valuations are perhaps stabilizing but there is no clear uptrend yet. In our view, nominal yields do not have an attractive premium over inflation. By contrast, Gold and Commodities are in an uptrend, although the precious metal might have paused for breath but it is still in an uptrend As for the wider commodities markets, they have a weaker trend due to the weaker oil price but overall commodities are still in an uptrend.
If you are an investor at the moment, what is the one warning signal you should focus on?
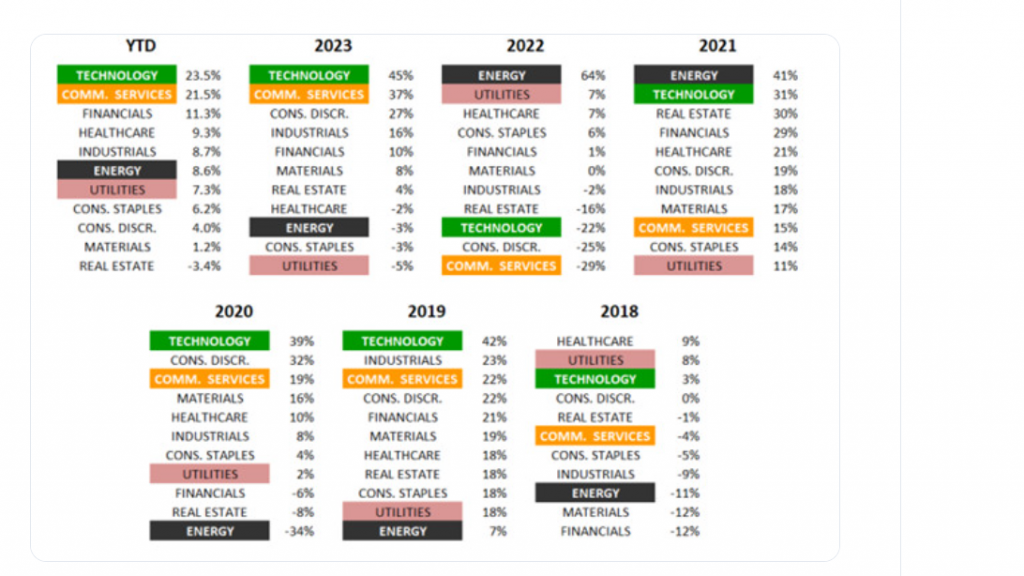
Sector rotation! You always get significant differences in Sector returns and leadership rotation over a sufficient period of time. Our view is that a major Sector rotation is likely at some point this year.Consumer Staples for instance have been a major underperformer so far. There could be a major opportunity to buy back in, but we would wait for confirmation. One of our measures, the Relative Value Yield for Consumer Staples, is at a 30-year high, so strategically, they are very attractive –that said we would wait for sentiment to improve.
Four small-cap funds and the active v passive debate
Four small-cap funds, including one micro-cap investor, recently released their latest financial results. The Deep Dive takes a closer look at each of their track records to see if it really does pay to be active.
ByFrank Buhagiar•26 Jun
Active or passive fund? Just one choice faced by investors when it comes to investing. Active – those funds run by managers who aim to outperform a specified benchmark. Passive – those funds such as ETFs (exchange-traded funds) which, by tracking specific indices, can only match the market return. The final decision rests on the individual views and preferences of the investor concerned. Believers in the Efficient Market Hypothesis (EMH) – share prices reflect all available information and so markets cannot be beaten consistently over the long term – may choose to go down the passive route. Those who believe that market prices can deviate from fair value, thereby making it possible to outperform markets, may gravitate towards active management.
There are costs to consider too. Active funds come with higher fees. A price worth paying for outperformance perhaps – provided the managers consistently deliver, that is.
Now, this is where it would be useful to have to hand a long-term outperformer or two with a track record or records that prove active managers can deliver. Step up Rockwood Strategic (RKW), River UK Micro-cap (RMMC), Montanaro UK Smaller Companies (MTU) and Montanaro European Smallers (MTE), four active funds that happened to report their latest results week ended Friday 21 June 2024. Can any (or all four) of these funds be the poster child of active investment management?
Rockwood Strategic
Looking at RKW first, the UK small-cap investorreported a +5.1% NAV total return and +15.4% total shareholder return for the twelve months to 31 March 2024. That compares to the FTSE Small Cap’s (ex-ITs) +7.1% and the FTSE AIM All-Share’s -8.6%. Performance a little off the Small Cap index but way ahead of AIM’s. Key is the longer-term track record though. Three-year performance, a particular eye-catcher: a +57% NAV Total Return compared to the FTSE Small Cap’s -6.8% and the FTSE AIM All-Share’s -38.5%.
And according to the full-year Report, Rockwoodis now “the No.1 Small Companies Investment Trust year-to-14 June for NAV Total Return and over 1, 3 and 5 years, as per the Association of Investment Companies.”
That best-in-class track record has helped move the share price from a 7.1% discount to NAV to a 1.9% premium, enabling 5,778,630 new shares to be issued. That’s a 22.7% increase in the share count which helped grow NAV to £64 million by year end. As Chairman Noel Lamb notes “This is no mean feat given 34 months of consecutive monthly UK fund outflows at a sector level and the general level of sentiment towards UK equities”.
All a big tick in the box for the investment manager’s core belief “that investment returns are generated by purchasing a share for less than the intrinsic worth of the company, (a ‘value’ philosophy)”. Investment Manager Richard Staveley, one assumes, not an EMH purist. In his full-year statement, Staveley talks about “identifying ‘catalysts’ which will unlock the share’s discount to the business’s worth or accelerate value creation. For ‘core’ investments we ourselves may be the ‘catalyst’ through the provision of capital, insight and personnel through constructive engagement with the Board, management and other stakeholders.”
And according to Chairman Noel Lamb, the fund’s UK small-cap focus provides a target-rich environment “the UK small companies market continues to provide a significant investment opportunity, due to the inefficient pricing of poorly researched or misunderstood companies trading at historically low valuations, further depressed by industry outflow driven selling.” Staveley agrees “We see a real opportunity to compound wealth for all shareholders over the long term and the potential for a revitalised but inefficient stock market full of opportunities to deliver our target returns.” A couple of ‘inefficients’ in there. RKW’sstrong track record, one for the active camp.
River UK Micro Cap
Like RKW, RMMC put in a decent performance during its latest reporting period: +6.23% NAV total return for the six months ended 31 March 2024 beat the Numis Smaller Companies plus Alternative Investment Market (excluding Investment Companies) Index’s +6.01%. And like RKW, River’s long-term track record stacks up: since the fund’s inception in April 2014, NAV total return (net of all fees) stands at +7.25% on an annualised basis while the Numis index has only managed a total return of +4.85%. Since inception, RMMC has also returned £77m to its investors.
With a track record like that, no surprise shareholders voted for the fund’s continuation at the March AGM.
As for the active/passive debate, Chairman John Blowers writes in his outlook statement that “The UK market is offered at bargain basement prices at the moment, no more apparent than in the smaller ‘micro cap’ company level (valued at less than £100m) in which the Company invests.” Bargain basement prices – not what you’d expect if markets behaved efficiently at all times.
Fund Manager George Ensor would appear to agree. In his latest doceo video update, Ensor talks about how he and the team “are trying to exploit the inefficiencies at the very bottom end of the UK market.” There’s that word again – ‘inefficiencies’. He also goes on to talk about the small-cap premium “that 3-4% premium you get from investing in smaller companies. We think there is an additional 1-2% from investing in micro caps and then there is an inefficiency so we should be able to deliver strong alpha from that part of the market.” Two ‘inefficiencies’ in quick succession. RMMC, another score for the actives.
Montanaro UK Smallers
MTU, a third UK small-cap fund to report during the week – was there a memo doing the rounds? True, MTU posted a measly looking +0.7% share price total return for the full year but NAV fared much better at +8.3%, not far off the benchmark’s +9.0%. Similarly, over 1,3, 5 and 10 years, NAV and share price total returns couldn’t keep pace with the benchmark. One for the passive camp then. Or is it? For it all depends on the definition of long term. Over the very long term, since the fund’s inception in 1995 to be precise, the cumulative NAV total return stands at 876%, that’s not far off double the benchmark’s 555%.
And as with RKWand RMMC, the fund manager’s report speaks of ‘inefficiencies’ “The market for SmallCap is inefficient”. Before offering up a reason. “While some large companies are analysed by more than 50 brokers, many smaller companies have little or no such coverage. We believe that this makes it easier for those with a high level of internal resources to identify attractive, undervalued and overlooked investment opportunities. This in turn makes it possible to deliver long-term performance over and above that of the benchmark.” Can’t argue with MTU’s ultra long-term track record. That’s another one for the actives.
Montanaro European Smallers
The latest full-year performance of MTU’sEuropean sibling, MTE, also fell short of the benchmark: NAV (with dividends reinvested) increased +4.9% compared to the MSCI Europe (ex-UK) Small Cap Index’s +5.9% (in Sterling terms). MTE though has fared much better over longer timeframes: NAV total returns of +68.6% and +203.4% over five and ten years respectively compared to the benchmark’s equivalent figures of +23.0% and +78.7%. And since Montanaro was awarded the mandate back in September 2006, the manager has clocked up an NAV total return of +478%, some +177% ahead of the benchmark.
As for our ‘inefficient’ monitor, the word makes yet another appearance in the manager’s full-year report “The market for European smaller companies is inefficient. While some large companies are analysed by more than 50 brokers, many smaller companies in Europe have little or no coverage. We believe that this makes it easier for those with a high level of internal resources to identify attractive, undervalued and overlooked investment opportunities. This in turn makes it possible to deliver long-term performance over and above that of the benchmark.” Sound familiar? That’s because a similar paragraph was used in the MTU report.
So, there you have it. A full house. Four funds in the small-cap space. Four funds showing how being active can pay over the long term.
The Results Round-Up – The Week’s Investment Trust Results
Which fund has reported NAV per share increases for every reporting period since the Company’s IPO in 2018? And which fund almost called it a day during its latest financial year?
By Frank Buhagiar
Patria Private Equity (PPET), the fund formerly known as abrdn Private Equity Opportunities
PPET’s +2% half-year NAV total return was trounced by a +22.9% share price total return (dividends reinvested). Chair Alan Devine believes ‘the buyback programme introduced by the Board in January 2024 has helped to support the improved performance of the share price.’ With the FTSE All-Share up just +6.9%, the fund’s share price total return has now outperformed the index over 1, 3, 5 and 10 years. Mention in despatches from the Chairman here for the ‘investment strategy, which has remained consistently focused on partnering with a focused cohort of high-quality private equity firms, predominately in the European mid-market.’ Name may have changed but strategy remains the same.
Investec: ‘Patria Private Equity (PPET) has a clear philosophy and proven approach. PPET focuses on partnering with a concentrated list of leading private equity firms and the core focus is the European mid-market. Since IPO in 2001, the excess annualised NAV total return versus the MSCI Europe index is 5.3%. However, despite this outstanding achievement, the discount remains stressed. We believe this represents excellent value and enhances a strong fundamental proposition.’
Numis: ‘The shares currently trade on a c.28% discount to our estimated NAV, which we believe, along with several other stocks in the LPE sector offers value.’
CC Japan Income & Growth (CCJI) hoping for more of the same
CCJI new Chair June Aitken had a relatively easy first half-year statement to write. NAV and share price total returns clocked in at +19.5% and +19.7% respectively compared to the TOPIX’s +14.9% sterling total return. The Chair believes ongoing structural and governance reforms, the end of deflation and the country’s technological prowess make ‘a compelling case for long-term investment into Japanese equities.’ No doubt, Aitken will be hoping future results statements will be just as easy to write.
Winterflood: ‘Semiconductor-related companies were strong performers in recognition of their industry leading positions and as potential beneficiaries of global realignment.’
JPMorgan Global Core Real Assets (JARA) being proactive
JARA’s full-year NAV total return may have come in at -4.4% but in local currency terms underlying asset performance was +0.3%. Transportation (+1.6%) and infrastructure (+1.6%) helped to offset real estate (-3.2%). A widening in the share price discount to NAV to 30.5% from 14.9% hit the shareholder total return (-20.9%) but post-period end, the discount has narrowed to -19.1%. Just as well for, as Chairman John Scott explains, ‘When our discount was above 35%, serious consideration was given to recognising that JARA’s offering was not finding favour with investors and that the best outcome for shareholders might be a dissolution of the Company’. A close-run thing then.
Progress made maybe but Scott and his fellow ‘Directors are committed to addressing JARA’s discount to NAV through proactive measures’. One of these is, subject to FCA and shareholder approval, reducing ‘JARA’s exposure to real estate and recycle this capital into other sectors, such as transport and infrastructure, where we expect stronger risk adjusted returns.’ The Board believes these changes should generate ‘Higher yields which in turn ‘should lead to increased dividends.’ That should go down well with shareholders ahead of the upcoming continuation vote.
JPMorgan: ‘Since the August 2023 AGM, JARA has bought back 11,887,814 shares (5.4% of the then shares in issue) resulting in 1.3% accretion to NAV per share.’
Augmentum Fintech (AUGM) keeps record intact
AUGM posted a +5.4% NAV per share increase for the full year. According to Chairman Neil England ‘This continued our history of increases for every reporting period since the Company’s IPO in 2018.’ England thinks there’s more to come. As well as improving inflation numbers, healthy cash reserves (£44.8 million as at 31 May 2024), ‘The underlying need to digitalise and transform financial services remains. Penetration is still only c.5% across the industry although adoption of consumer-focused fintech by younger demographics is markedly higher.’ It’s all about the demographics!
Numis: ‘Augmentum Fintech has a unique mandate among London-listed funds, focused on European fintech companies, which are seeking to disrupt the business models of traditional banking and financial services. We believe that the fund may be an attractive long-term investment, albeit that the early-stage nature of the companies means that it may not always be a smooth ride for investors.’
Sequoia Economic Infrastructure Income (SEQI), cautiously optimistic
SEQI’s full-year NAV total return came in at +8.1%. That beats the 7-8% target. At 6.875p per share, total dividends also met the previously raised target too. No wonder Chairman James Stewart described the results as ‘another resilient year of performance.’ The Chairman puts forward three reasons behind the resilience: being ‘agile’; focusing on the credit quality of the infrastructure debt portfolio; and continuing market demand. Not all plain sailing. Share price is stuck at a discount to net assets. The Board however ‘continues to address this proactively against the challenging market backdrop.’ What’s more CEO Randall Sandstrom sees ‘reasons for cautious optimism’ – inflation is falling, interest rates should soon follow, so too market default rates. Hallelujah!
Liberum: ‘We continue to view SEQI’s as amongst the most attractive alternative funds in the current environment.’
The Global Smaller Companies’ (GSCT) year of two halves
GSCThad a strong second half of the year. Just as well, for at the half-year stage NAV total return was -6.3%. By year end, NAV total return stood at +9.0%. Not quite enough to match the benchmark’s +11.3% but the shareholder total return did better, up +12.7%. Looking ahead, Chair Anja Balfour doesn’t appear to be losing too much sleep over ongoing economic/geopolitical concerns. That’s because ‘Our Manager will continue to focus on identifying companies that will do well regardless of what happens in the wider economy.’
Winterflood: ‘Asset allocation positioning hurt relative performance over the year, largely reflecting UK overweight and North America underweight.’
Bankers’ (BNKR) looking to concentrate more
BNKR’s +17.5% NAV and +21.5% share price total returns for the half year trumped the FTSE World’s +16.6%. No sitting on laurels though. During the period, a strategic review was undertaken. The result? The number of the fund’s regional portfolios is falling from six to four: North America, Pan Europe (to include the UK), Pan Asia (ex-Japan) and Japan. While smaller holdings are being chopped because these ‘were not improving performance. We therefore intend to increase the amount of capital in our best ideas by reducing the number of holdings towards 100.’
Numis: ‘We believe that it makes sense to reduce the number of holdings given the limited impact the tail end of the portfolio is likely to have on performance with an increased focus on the ‘best ideas’, although note that the number of holdings remains relatively high.’
SDCL Energy Efficiency Income (SEIT) remaining cautious
SEIT reported a 90.5p NAV per share as at 31 March 2024. That’s down on last year’s 101.5p. The headline number doesn’t tell the whole story as NAV per share barely moved in the second half. So, most of the fall occurred in the first half of the year as the discount rate was increased in response to the ‘higher for longer’ inflation/interest rate backdrop. The company isn’t standing still waiting for things to improve: selective disposals are being made; borrowings reduced; while a capital allocation policy has been adopted to ensure ‘returns on any new investment compare favourably with any alternative opportunity’. As CEO Jonathan Maxwell writes ‘Particularly where interest rates remain relatively high, we remain cautious.’
Liberum: ‘There is enough potential in the longer-term equity story for us to think it makes sense for SEIT to be valued at a narrower discount than most of its peers. This is one of the more distinct strategies in the sector in that it invests in operating companies, providing the greatest scope for long-term EBITDA and ultimately NAV growth.’
Schroder UK Mid Cap (SCP) doing a spot of fishing
SCP’s +9.3% NAV return for the half year, a little off the benchmark’s +11.4%. Chair Robert Talbut blames the fund’s growth focus. The period under review saw ‘a sharp and fast rotation within the mid-cap universe away from long-term growth businesses towards more interest rate sensitive businesses linked to the interest rate cycle which typically have more stretched balance sheets and challenged business models.’ Still, SCP has consistently outperformed over five and ten years. No surprise then that Talbut believes ‘focusing upon quality will continue to deliver over time.’
The investment manager meanwhile ‘would like to remind readers that we are fishing in an attractive pond. The mid 250 is populated by multiple ‘unique’ companies with strong growth prospects generating cash and delivering attractive returns on capital.’
Winterflood: ‘Share price TR +5.8% as discount widened from 12.0% to 15.2%; no shares repurchased.’
The blog portfolio will have the right to buy 59,100 shares at a cost of £5,910.00
Some of the shares could have been sold, by selling the existing shares, at a gain of around £2,500 and the new shares would then replace the existing shares held at a big loss.
If, which is doubtful, the price was to rise I would sell some shares at an equivalent of around a 75% gain.
The longer term plan is to hold all the shares and receive the diluted dividend and reduce if/when Mr. Market gives me the chance.
Funds for the purchase will/should be provided by ADIG £3,733.00 and the balance from cash £1,443.00 and dividends received before the payment date.
According to Forbes, Warren Buffett is the fourth-richest person on the planet, with an estimated fortune of $121bn. Unlike the three ahead of him — Messrs Musk, Bezos, and Ellison — he’s built his wealth primarily from investing.
I’ve been looking at his career to see how I might go about accumulating significant wealth, without having any savings to start with.
1. Start early
The first thing I’d have to do is begin investing as early as possible. Buffett bought his first stock when he was 11. He’s still investing 82 years later.
Do you like the idea of dividend income?
The prospect of investing in a company just once, then sitting back and watching as it potentially pays a dividend out over and over?
The longer the investment horizon, the more time there is for wealth to grow. And delaying a few years can make a big difference.
The table below shows how much £100 invested today could be worth over different periods. The figures assume an annual growth rate of 7.4% — the average yearly return (with dividends reinvested) of the FTSE 100, from 1984 to 2022.
Period (years)
Final value (£)
5
143
10
204
20
417
30
851
40
1,738
82
34,862
2. Reinvest those dividends
By withdrawing dividends, the FTSE 100 would have delivered growth of ‘only’ 5.3%. With this lower rate, £10 would have been worth £789 after 40 years — over 50% less.
This demonstrates the power of compounding, which has been described as the eighth wonder of the word.
Berkshire Hathaway, Buffett’s own investment company, doesn’t pay dividends. Instead, it reinvests the cash it saves by buying more shares.
This has helped its stock achieve a compound annual growth rate of 19.8%, since 1964. A sum of £1 invested then, would now be worth over £3.7m!
That’s why — as tempting as it might be to spend dividends on a one-off treat — I always reinvest them.
3. Don’t put all your eggs in one basket
Most investors emphasise the advantages of diversification — spreading risk across a number of stocks.
However, Buffett once said: “A lot of great fortunes in the world have been made by owning a single wonderful business. If you understand the business, you don’t need to own very many of them“.
Some have interpreted this as meaning that he doesn’t believe in owning lots of individual shares.
On the contrary, the point he’s making is that most of us don’t have the skills (or time) to undertake the necessary research to consistently pick winners. In fact, he’s a big fan of diversification for the amateur investor.
In 1993, the billionaire said the “know-nothing” investor is likely to out-perform the average fund manager by investing in a tracker fund.
These are a great way of spreading risk across many companies through the ownership of just one investment.
From 1964-2022, a fund tracking the S&P 500 would have returned 24,708%.
Of course, there’s no guarantee that history will be repeated.
4. Be patient
Finally, Buffett is quoted as saying: “It is not necessary to do extraordinary things to get extraordinary results“.
In my view, too many people get caught up trying to find the next ‘big thing’. Remember, slow and steady sometimes wins the race.
Investing small — and often — can be effective. A sum of £50 a month, earning a return of 5%, will grow to nearly £30,000 after 25 years.
I don’t think I’ll ever be a billionaire, but, in my opinion, it’s never too late to follow in the footsteps of Warren Buffett and start building wealth by investing in stocks and shares.