NextEnergy Solar Fund Limited (“NESF” or the “Company”)
Commencement of Formal Sale Process
NESF announced on 11 March 2026 the results of a strategic review, on 3 June 2026 the Company’s updated NAV as at 31 March 2026 and on 22 June 2026 the Company’s Full Year Results & Annual Report.
Notwithstanding the performance of its underlying portfolio of assets, NESF continues to have a challenging experience as a listed company, including a share price discount to its reported NAV that has persisted for several years and impacted its ability to raise new equity capital to fund its future growth. The board of NESF (the “Board“) also believes that it is challenged by the increased focus on shorter-term investment horizons by some parts of the public equity markets compared to the longer-term nature of its investments.
Since the announcement of the strategic review the Board has continued to engage with major stakeholders to understand their views on the Company’s future strategic options. Having evaluated this feedback and numerous alternatives to maximise value for shareholders, the Board believes that it would be in shareholders’ interest to investigate the sale of NESF and has therefore decided to commence a “Formal Sale Process” of the Company (as referred to in Note 2 on Rule 2.6 of the Takeover Code (the “Code“)) (the “Formal Sale Process“).
NextEnergy Capital IM Ltd, NESF’s investment manager, fully supports the Board’s decision.
The Board is not in any active discussions with any potential offeror and is not considered to be in receipt of an approach from any potential offeror as at the date of this announcement.
The Takeover Panel has agreed that any discussions with third parties in relation to an offer for the Company may take place within the context of a “Formal Sale Process” (as referred to in Note 2 on Rule 2.6 of the Takeover Code).
Formal Sale Process
As part of the Formal Sale Process, the Board invites expressions of interest from bona fide parties regarding a potential transaction for the entire issued ordinary share capital of the Company. The Formal Sale Process is being managed by the Board, which is being advised by Rothschild & Co. Parties interested in participating in the Formal Sale Process or otherwise engaging with the Company should contact Rothschild & Co, using the contact details below.
The Company intends to conduct a process focused on those parties which understand and value the full potential of the Company.
Parties interested in participating in the Formal Sale Process will be required to enter into a non-disclosure and standstill agreement with the Company on terms satisfactory to the Board and on the same terms, in all material respects, as other interested parties before being permitted to participate in the Formal Sale Process. The Company intends to provide interested parties with certain information on its business, following which interested parties would be invited to submit their proposals to the Board. NESF will update the market in due course regarding timings for the Formal Sale Process.
A real estate investment trust (REIT) is a company (or group of companies) that owns and manages property portfolios, generating income and capital gains for investors.
At least 75% of their global profits must come from property rental income.
REITs can invest in many types of commercial property, such as offices, warehouses, data centres, shopping centres or industrial parks. Residential assets often include student accommodation, apartment blocks or assisted living facilities. They don’t invest in individual houses or flats. They might also hold the underlying land an asset sits on, or a site ready for future development.
What are the risks of investing in a REIT?
While REITs can invest with a broad focus, many take a focused view on one or two sectors, which can introduce concentration risk.
Max King, former fund manager and MoneyWeek columnist says excess supply and limited demand could lead a particular sector into a bear market.
“In that case, not only can net asset values (NAVs) fall but discounts to NAV can open up,” he says.
For this reason, knowing what to buy is the key, which is far from easy.
In King’s view, a specialist investment trust, like TR Property, would be a better option, letting the experts do the asset allocation for you.
You could build your own diversified portfolio of commercial property by selecting REITs from different sectors or countries. Or you may prefer to buy an exchange-traded fund (ETF) that tracks a broad index of property companies.
As with most property-related stocks, the share price of a REIT can be volatile, especially during periods of crisis when they may move more sharply than the wider stock market. But while investing in direct property can come with liquidity concerns (because property can be difficult to buy and sell quickly), as REITs offer investors shares in a stock market-listed company, liquidity is less of a concern.
HMRC estimates around 200 REITs are currently registered. Many large property companies, such as British Land and Landsec, fall into this category
These aren’t just a UK concept; the US, Australia, France and Japan also have similar regimes in place.
How are REITs taxed
REITs differ from standard investment trusts and other property funds through the way they are taxed.
In the UK, companies held inside REITs are exempt from corporation tax on any qualifying property rental profits and capital gains. But the REIT must distribute at least 90% of any rental income (not gains) every year to shareholders, within 12 months of the company’s year-end. These payouts are called property income distributions (PIDs), rather than standard dividends.
PIDs are usually subject to a 20% withholding tax – a tax paid directly to HMRC before you receive payment.
PIDs circumvent the need for corporation tax to be paid on the REIT’s holdings, meaning that shareholders in REITs can receive proportionately more money post-tax than through other property investment vehicles.
Certain types of institutional shareholders can qualify to receive PIDs gross – without the 20% deduction. Some of these include UK public bodies, charities or pension funds, for example.
Not all profits generated are PIDs or capital gains. Properties inside REITs can also generate profits from other activities (sometimes called ‘residual’ or ‘non-core’ activities), which might be interest payments, development or property management. These are usually taxed as ordinary profits, and treated as such. These residual activities must be no more than 25% of the REIT’s total income profits or assets.
When were REITs introduced?
REITs were introduced in the UK in 2007. The idea was to remove the ‘double taxation’ that had previously applied – where the core asset (building or piece of land) – paid tax and then shareholders also paid tax on receipt of any investment returns or income. Now, for most REITs, the tax is only collected when investors receive the payments, at their standard rate of income tax.
So while investors hold shares in the REIT (as it’s a listed company), it means they have a similar tax position to owning the property directly.
They may also be subject to other restrictions, such as caps on leverage, which is the amount they can borrow against their assets.
How to build a successful investment portfolio from scratch, by STEPHEN YIU of Blue Whale
Story by Stephen Yiu
Investing offers the chance of significantly higher returns than saving in cash.
This is at the ‘cost’ of watching your money go up and down in value on paper in the short term, but leaving your investment alone long enough makes short-term volatility irrelevant.
Contrary to what most people fear, it is not hard to do.
Here’s how to get started and then build up and manage a successful investment portfolio.
1. Beginners should buy ETF trackers
If you’re new to investing, Exchange-Traded Funds are a great first move. An ETF is a ready-made basket of shares that make up the index it is tracking, giving you exposure to lots of companies in one trade.
This instantly spreads your risk: if one company has a bad day, others can offset it.
Stephen Yiu: ETFs are low effort, low fuss, and the ideal foundation for new investors
ETFs are low cost, easy to buy and sell and transparent in their holdings.
For example, an ETF tracking the S&P 500 index provides instant access to America’s largest companies across multiple sectors.
ETFs are low effort, low fuss, and the ideal foundation for new investors.
For many people, there is no need to venture beyond investing in ETFs to enjoy a successful portfolio, whether in their Isa or pension or both.
2. What ambitious amateurs should do next
By their very nature, your returns from ETFs are only ever going to track the relevant market, never beat it.
For many people, that is all they are looking for, especially given the low costs and ease of choice ETFs offer.
However, once you have cut your teeth with passive investment and built up a nicely diversified portfolio of tracker ETFs, you might want to be more ambitious and seek market-beating returns as the icing on the cake.
The first alternative for more ambitious investors is to look for consistent long-term success from competent, high-calibre active fund managers.
ETFs track the market, but successful active fund managers aim to beat it by spotting opportunities others miss, sidestepping risks early, and making informed decisions across all conditions.
Over time, this advantage can compound into a significant gap between ‘average’ returns and the kind of performance that builds lasting wealth.
But spotting and investing with a good manager is the trick. Here’s what to look for.
– Proven outperformance across multiple years and market cycles, not just one lucky run.
– Transparency and regular communication – keeping investors updated on positioning and performance.
– A clear, repeatable investment process that you can understand and trust.
Without this calibre of management, active funds risk becoming expensive index-trackers – in fact most active funds typically underperform their relevant index.
But when managed properly, truly active funds can be the powerhouse of your portfolio, delivering returns that passive strategies alone can’t match.
3. Investing for profit and pleasure
Picking individual company shares is the most hands-on approach for the more ambitious investor.
You control every decision and can enjoy substantial rewards if you back a winner early.
However, the risks are higher: company missteps, price volatility and concentration can hurt. Success demands research, discipline and the ability to stay calm during market swings.
At Blue Whale, even our professional investors (who analyse markets full time) typically cover just five companies each.
That’s how much work it takes to truly understand a business and its drivers. For private investors, replicating that depth across even a handful of shares can be prohibitive.
Financial ambition: Investing offers chance of significantly higher returns than saving in cash
The bottom line
A smart progression might look like this: start with broad, low-cost ETFs for a diversified base, then add proven active managers – the serious investor’s engine of outperformance – and finally, if time and interest allow, sprinkle in individual shares for challenge and enjoyment.
The real key is patience. Stay the course, ride out the bumps, and let compounding quietly work in your favour. Start early, stick with it, and you’ll give yourself the best shot at long-term financial success.
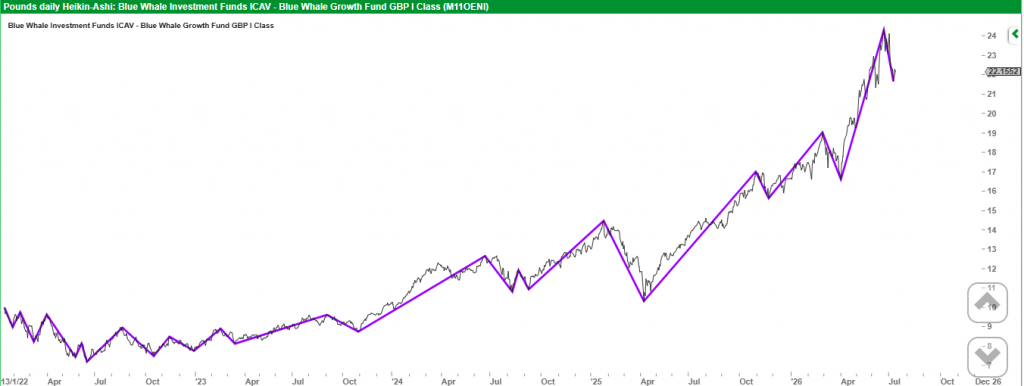
Looking at the chart of Blue Whale, you will notice there are long periods when prices go sideways or fall, a good time to own dividend paying shares as you fail by the month and not the year.
If you are investing for capital growth, your share should at least follow the markets when they are going up.
Small Caps, Energy Stocks and a 6% Yield. This Fund Has the Rest of the 2020s Covered
Michael Foster, Investment Strategist
Today we’re going to discuss a 6%-paying fund that’s quietly built a portfolio perfectly tuned for the rest of the 2020s
Few investors realize it … yet. Which is why we can grab this 6% payer (whose payout looks set to grow from here) at a 10% discount to its “true” value.
The fund in question is the Sprott Focus Trust (FUND), a closed-end fund (CEF) managed by Whitney George. He’s a manager you may have heard of: George is known for the profits he’s earned over the decades by focusing on two key areas: energy stocks and small caps.
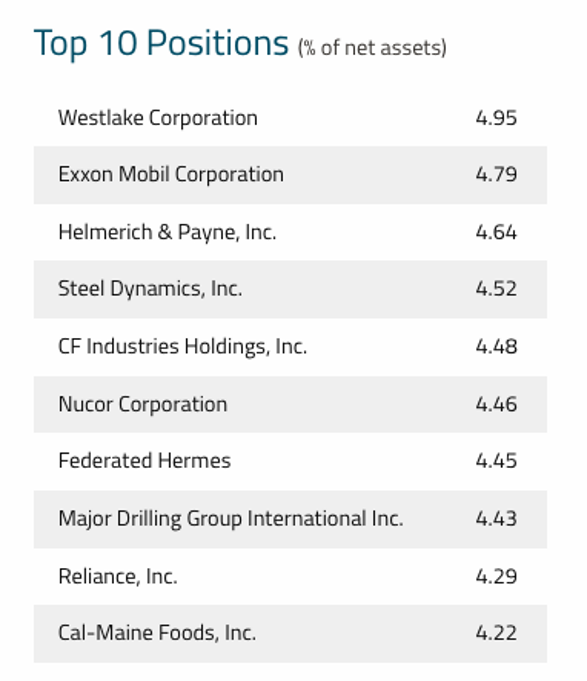
Source: Sprott Inc.
You can see that reflected in FUND’s portfolio, the top-10 holdings of which are shown above. Familiar big caps are here, such as ExxonMobil (XOM), as well as mid-caps like manufacturer Westlake Corp. (WLK) and smaller fry, like Canadian contract driller Major Drilling Group—market cap: $1.24 billion—and mainly domestic food maker Cal-Maine Foods (CALM), with a $3.75-billion market cap.
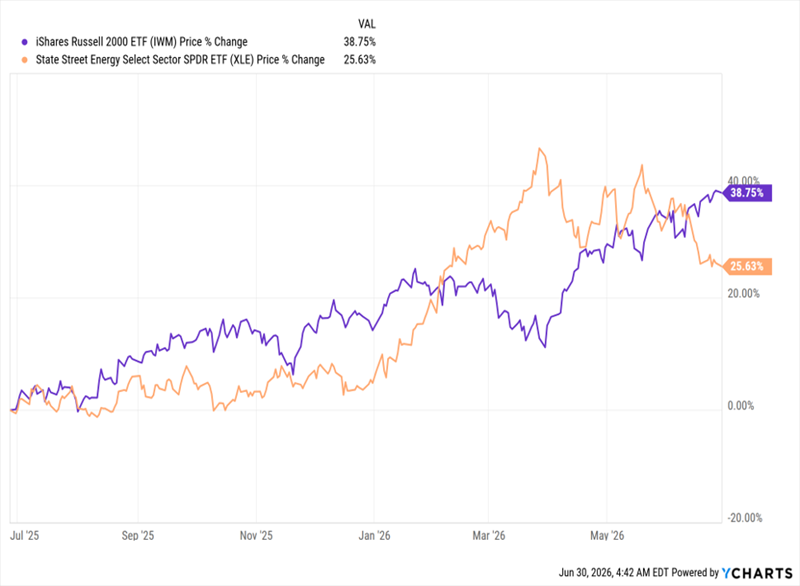
It’s a good time to tilt toward George’s two specialties right now, because the benchmark ETFs for energy stocks (shown in orange below) and small caps (in purple) have been on a roll this year:
Energy Stocks, Small Caps Fly Through the First Half of ’26
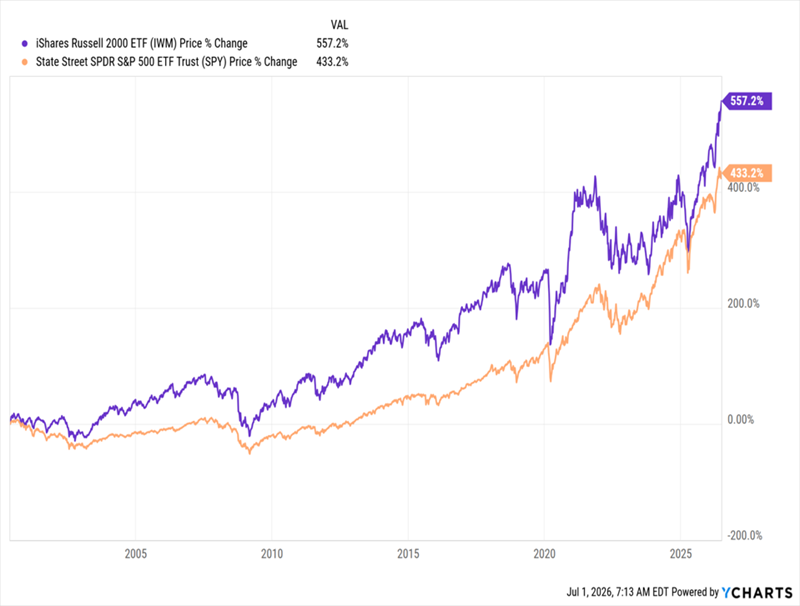
When it comes to small caps, shown by the iShares Russell 2000 ETF (IWM), this short-term performance is compounded by the fact that, over the very long term, these companies (again, with IWM in purple below) outrun the benchmark S&P 500 ETF, the State Street SPDR S&P 500 ETF Trust (SPY), in orange.
Big Gains From Small Caps
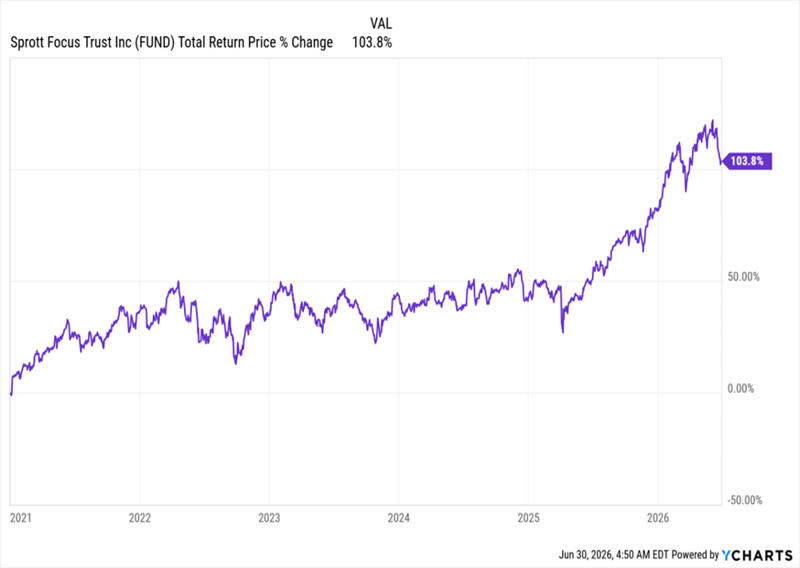
However, this was not true in the 2010s, when the S&P 500 edged out smaller firms. That, in turn, weighed on FUND, until it began to edge higher earlier in the 2020s and really took off starting in early 2025.
FUND Gains Slowly—Then All at Once
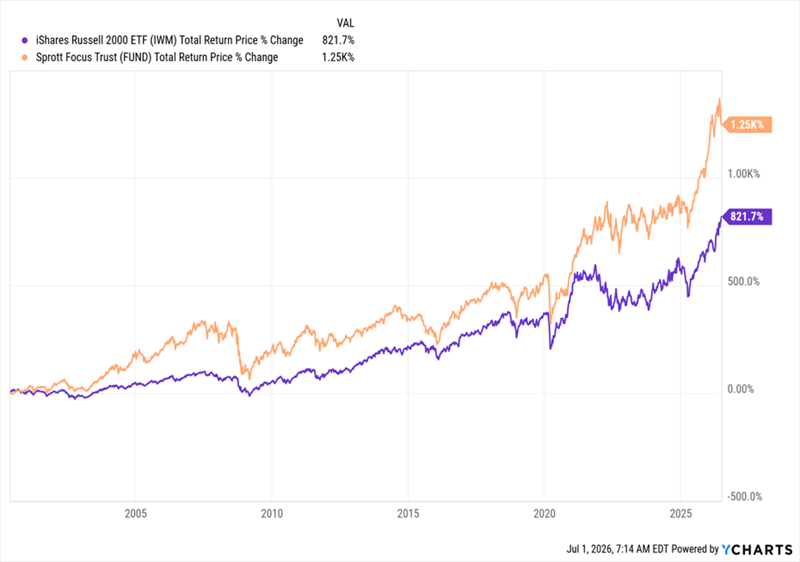
This is a return to form, as George’s fund has been outperforming the small-cap benchmark ETF for a long time. If we go back to when that ETF went public, we can see that FUND (in orange below) has been outrunning it for its entire life.
FUND Crushes Its Small-Cap Benchmark
I expect that performance to continue as small caps return to their long-term dominance over their larger cousins. Moreover, FUND’s mix of small- and mid-cap companies, along with energy stocks, makes it a particularly savvy way to grab energy exposure. That’s because its smaller stocks outperform the benchmark over time, providing some cushion for its more-volatile energy holdings.
The classic case of this in action came during the pandemic, when oil prices, of course, briefly went negative. That was enough to send the energy-stock benchmark to a 50% loss—but not FUND: It only briefly turned negative in that time.
This makes sense: As COVID shut the world down, the focus shifted to more domestic-focused companies that didn’t have to worry about globe-spanning supply chains. Those tend to be small caps.
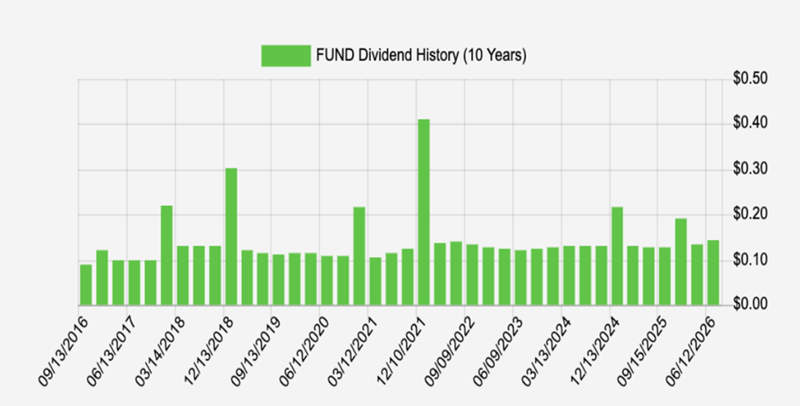
Plus, there’s the income, with FUND paying out that rich 6% payout mentioned earlier.
Now, 6% sounds like a lot, but remember that FUND has been hiking payouts for a decade now, and handing out big special dividends here and there, too (those are represented by the spikes in the chart above).
These payouts are possible because FUND’s NAV keeps rising, and the fund’s mandate is to pay an annualized rate of 6% of the rolling average of the fund’s NAV over the last four quarters, so a higher NAV will mean bigger payouts.
In other words, since that 6% yield does not account for those special dividends, that yield is best thought of as a floor—and one that’s likely to rise.
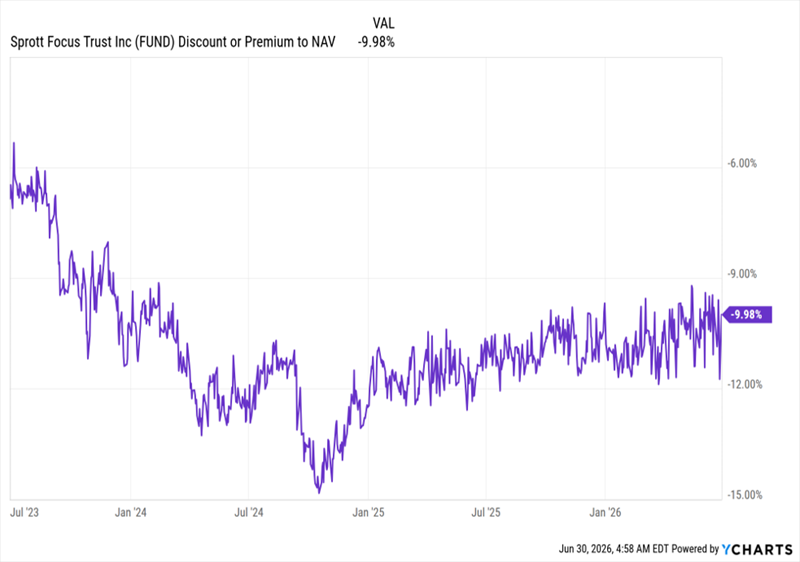
FUND’s Discount Slowly Narrows
This is especially true when we remember that FUND has a nearly 10% discount to net asset value (NAV, or the value of its underlying portfolio), but that discount bottomed out in mid-2024 and is now slowly moving back toward par. However, it’s still below the 9% level, so it may be some time before the markdown truly shrinks and we get some “closing-discount” gains on top of those generated by the fund’s portfolio.
But that’s fine. Because that 6% yield is safer thanks to this discount, since it also means management needs to earn just a 5.5% total annualized return on the NAV to sustain the 6% dividend yield, which is calculated on discounted market price.
The story gets even better, since FUND’s total NAV return over the last three years is 14.4% on an annualized basis, or nearly triple what it needs to sustain payouts. No wonder George has tossed out so many big special payouts over the last few years.
This also suggests that more such payouts are on the horizon. This fund is worth considering before the next one is announced, which will likely cause the discount to shrink further—and propel the price higher as it does.
Buy FUND today and I expect you’ll be looking at a much higher yield than 6% on your original buy in just a few years.
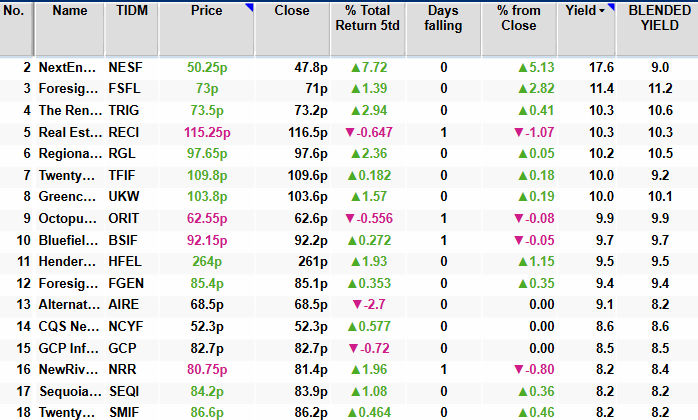
And yet a couple of new entrants have arrived. Vanguard LifeStrategy 100% Equity A Acc returns to the table, while Fidelity Index World drops out of the top 10.
move back into the list. That, like fellow top 10 constituent Henderson Far East Income Ord HFEL, has plenty of fans thanks to a high share price dividend yield.
Passive technology fund L&G Global Technology Index Trust slips out of the table. However, growth investing remains high up the agenda, with both Polar Capital Technology Ord PCT
Hansa Investment Co Ltd ex-dividend date Invesco Bond Income Plus Ltd ex-dividend date JPMorgan Asia Growth & Income PLC ex-dividend date Montanaro UK Smaller Cos Investment Trust PLC ex-dividend date Neuberger Private Equity Partners Ltd ex-dividend date Schroder European Real Estate Investment Trust PLC ex-dividend date TwentyFour Income Fund Ltd ex-dividend date Utilico Emerging Markets Trust PLC ex-dividend date
Here’s how you could supplement the State Pension in retirement through having a second income.
Posted by Peter Stephens
The Twelfth Magpie’s Premium Investing Services.
While the idea of generating a passive income may initially seem daunting, there are a number of assets available that could help you to reach your income goals.
Read on to find out more about them, as well as why it is a good idea to ensure you hold a diverse range of assets in retirement.
Investing in shares
Dividend-paying shares can offer a relatively high level of income. The FTSE 100, which is an index of the largest 100 companies on the UK stock market, has a dividend yield of 4.2% at the time of writing. This is likely to be higher than the income returns offered by many other assets, while the potential for dividends to rise over the long run could mean that shares have an inflation-beating income outlook.
Shares carry greater risk than many other assets, so it is important to research them before going ahead with a purchase. Factors such as the company’s debt levels, strategy and how much of their profit is used to pay dividends may be worth checking before buying them.
Should you wish to buy shares, opening an ISA could be a tax-efficient means of doing so. Researching various sharedealing providers could help you to find the best deal, with sites such as The Motley Fool offering a variety of reviews on them.
Investing in property
Purchasing a property is another means of generating a passive income in retirement. Even though property prices have risen significantly in recent years, it may still be possible to generate a relatively high yield in parts of the UK. However, due to the cost of buying property, it may be difficult to build a diverse property portfolio.
It is important to note that should a property you own go through a void period, or if a tenant fails to pay rent, this could cause a reduction in your income.
With the introduction of a 3% stamp duty surcharge in April 2016, as well as other tax changes, investing in property may be less appealing than it once was from a tax perspective.
Investing in bonds
Bonds are a popular means of generating a passive income in retirement. You lend money to a government or corporate entity, with the amount repaid on a specific date in future. In the meantime, interest payments, or coupons, are paid on the debt. They differ in level depending on the financial strength of the entity in question, with interest rates on less stable governments and businesses being higher than interest rates on more financially sound entities.
Although bonds can offer a more reliable income in some cases than dividend-paying shares, they lack capital growth potential. In some cases, this may mean that their total return is less than inflation. Over the long run this can lead to reduced spending power.
Bonds can be purchased through the same accounts as shares in many cases, with an ISA being a tax-efficient means of buying them.
Savings accounts
If you would rather not take any risks with your money but still want to generate a passive income, savings accounts could be an option. As long as you have less than £85k invested in a banking group, there is no risk of capital loss if it goes bust.
However, savings account returns are relatively low. At the time of writing, they are around 1.5% at best. Since this is lower than the long-term average inflation rate, it means that amounts held in them could lose their spending power over time.
It’s also important to note that no income tax is charged on the first £1,000 of interest income. For that reason, unless you will generate over £1,000 in interest income per year, having a savings account rather than a cash ISA could be a good idea.
Passive income tip: diversify
In order to enjoy a more consistent level of income, as well as a lower risk of loss, ensuring that you have a mix of assets from which to generate a passive income in retirement could be a good idea.
Shares, bonds, property and cash all have their advantages and disadvantages when it comes to risk and reward. While one asset may be right for one retiree, it may not be seen as ideal for another.
For example, shares may offer the highest income return at the present time. But they could experience a fall in value that then makes holding bonds a better idea, since their value may move in the opposite direction to that of shares during periods of uncertainty for the economy.
Therefore, diversifying with different types of assets in your portfolio may provide you with a more consistent income return that helps you to budget effectively in retirement.
Investment funds are an important part of investing, and there is plenty to know about them.
While the array of designations, acronyms and fees can feel overwhelming, especially for beginner investors, it is well worth taking the time to understand investment funds. The top funds can form a really integral part of your portfolio
The key advantage of investing using funds, rather than picking individual stocks, is that it immediately offers diversification
“As a general rule, diversification tends to be your friend and prevents one or two isolated problems from wrecking your portfolio,” says Ben Seager-Scott, chief investment officer at Forvis Mazars.
“Funds give you ready access to a spread of companies without being overly exposed to just a handful,” he continues. He cites legendary investor Harry Markowitz who reportedly said “diversification is the only free lunch in investing”. Funds offer this diversification, without much of the cost, administration and time commitments that building your own portfolio from scratch would entail.
“You could choose to manage a portfolio directly if you have the time to understand and research all of the stocks, listen to the earnings call, decide which winners to allow to run higher versus which ones to take profit on, which stocks to top-up after a fall or close out of… and so on,” says Seager-Scott.
But if you buy a fund, a professional – whether that is a fund manager or an index compiler – is doing that for you.
The different types of investment funds
Investment funds come in various forms – so many, in fact, that categorising all of them is almost impossible. But there are three broad categories that it is especially useful for investors to be familiar with, and which cover most of the range of possible investments between them. These are ETFs, mutual funds and investment trusts.
There are two key distinctions that define these three fund types: open- versus closed-ended, and listed versus unlisted.
“Open-ended means clients can put money into the fund and take it out of the fund which makes the fund itself grow or shrink,” says Seager-Scott. Closed-ended, on the other hand, means that all the fund’s capital is raised and all of its shares are issued at its inception.
“Listed means the shares are listed on the stock exchange so can be traded through the day on this secondary market, whereas unlisted means you trade effectively directly with the fund group (although in reality it is still intermediated) once per day,” says Seager-Scott.
ETFs
Exchange-traded funds (ETFs) are open-ended, listed funds. As the name suggests, they are listed on a stock exchange: you can buy and sell them in a stocks and shares ISA just as you might buy shares in a listed company.
“The advantage is that they can be bought and sold throughout the day and you can see live pricing while the market is open,” says Seager-Scott. “The downside is you generally have to trade during market hours and there is the added complexity that comes with the secondary market.”
Despite trading on a stock exchange, the price of an ETF will always reflect the net value of its underlying assets (net asset value, or ‘NAV’). This is because new shares can be created or redeemed by authorised partners to ensure that changes in demand for the ETF’s shares are always balanced against changes in its NAV. This is what is meant by ‘open-ended’.
Mutual funds
This is a broad and sometimes blurry category, but essentially it refers to open-ended, unlisted funds.
“There are lots of varieties, including OEICs (which are UK-domiciled), unit trusts (which are an older style of UK-domiciled fund) and SICAVs (which are EU equivalents),” says Seager-Scott.
The biggest difference between a mutual fund and an ETF is the fact that a mutual fund isn’t listed on a stock exchange. Units in the fund are bought directly from the fund group via an investment platform once per day.
“It is important to be aware that even though they are open-ended, they can still close if they need to,” says Seager-Scott.
This can be because they get too big and stop accepting more money, in which case existing investors will still be able to get their own money out. But sometimes it is because shares sell off too rapidly and the fund is unable to meet redemption requests. In that instance the fund is closed or ‘gated’, and no-one can buy or sell the fund. “This often causes a lot of concern,” says Seager-Scott.
Investment trusts
Investment trusts are closed-ended funds. They are also, technically, listed companies – they are often referred to as ‘investment companies’ for that reason.
Being closed-ended means that all of their shares are created at the inception of the fund. New shares can be issued, but this is a much less common event than the daily creation and redemption of shares that occurs in open-ended funds, and is done to raise additional capital to invest rather than to manage the pricing of the fund.
The upshot is that the price of an investment trust is determined entirely by demand for its shares (as with shares in a company) rather than the value of its underlying assets (as with open-ended funds). That means investment trusts can trade at a discount or a premium to their NAV.
Some investors see this as a disadvantage, though our explainer, ‘Should investors worry about investment trust discounts?’ examines whether this is necessarily the case. At any rate, investment trusts have some key advantages over open-ended funds.
In brief, the closed-ended model means that they never have to sell assets when investors withdraw their money, enabling fund managers to pursue long-term investments with conviction. As limited companies in their own right, they can also use leverage – known as ‘gearing’ – to amplify their investment returns.
Investment trusts can also reserve up to 15% of their returns on any given year and use these to top-up dividends in future years, enabling them to offer investors a smoother dividend yield over the long term.
What about active and passive funds?
Another way of categorising investment funds is into passive versus active. In brief, active funds have a manager who actively buys and sells securities to try to generate market-beating returns, while a passive fund simply tracks an index (such as the FTSE 100).
Investment trusts are always active funds. Broadly speaking, mutual funds and ETFs can be either active or passive. ETFs are generally associated with passive investing but there is nothing in the ETF structure that mandates this, and active ETFs are growing in significance: assets managed by European active ETFs grew almost 70% last year.
Active ETFs are managed by an expert portfolio management and research team making forward-looking investment decisions, says Rahul Bhushan, managing director at ARK Investment Management. ARK’s team, for example, focuses on companies in high-growth sectors that it believes will benefit from technological innovation.
“In fast-moving sectors like AI, robotics, blockchain, energy storage and multiomics, we believe active management can be a significant advantage,” Bhushan adds.
What should investors look for in an investment fund?
The first consideration when choosing a fund to invest in is your risk tolerance and how the fund reflects that.
Seager-Scott says that “a common and sensible approach is to think about an asset allocation framework that matches your risk profile,” which effectively means the balance between equities (shares in companies) and bonds – higher-risk and lower-risk respectively.
Similarly, you’ll want to think about what you’re gaining exposure to when buying the fund. Do you want exposure to global equities in all industries, or are you looking to buy into a specific sector? There are funds for each of these and everything in between.
After identifying the kind of fund you want to buy you’ll likely still be presented with multiple options from different providers. Fee levels, as well as the fund’s underlying strategy, can help you decide which is your best option.
Fees can eat into your overall returns so it’s important to understand them.
Active funds typically charge higher fees than passive funds, because it is more labour-intensive to run an active fund than a passive fund. In theory, this is compensated by superior returns, but that doesn’t always transpire: AJ Bell’s latest Manager versus Machine report found that just 30% of active funds outperformed passive counterparts in the 10 years to 30 June 2025.
So before buying an active fund it is important to check its annual returns over the long term and ideally comparing these to a passive fund or index in the same sector to ensure that the manager is worth the extra fees. Past returns of course do not guarantee future results, but a track record of outperformance is one indicator of a skilled investment manager.
Investors will also want to check their own understanding of how the index works (for a passive fund) or the fund manager’s strategy (for an active fund) before investing.
You’re reading a free article with opinions that may differ from The Twelfth Magpie’s Premium Investing Services.
The S&P 500‘s already delivered a near-11% total return since January, powered by strong corporate earnings and continued AI investment.
But with the index now brushing record highs and valuations looking stretched in places, how much higher can it realistically go?
The latest forecasts
The general consensus from most institutional analysts is the S&P 500’s actually still on track to climb even higher, albeit modestly.
Right now the index is sitting close to 7,500 points. But according to a Reuters poll across 47 analysts, the median price forecast for the US flagship index is 7,620 – around 2% higher than current levels.
In terms of money, that means a £1,000 investment today could only grow to around £1,020 over the next six months, which is pretty underwhelming.
However, while index investors might not have a thriving time for the rest of 2026, the same isn’t the case for stock pickers. In fact, even in today’s elevated market environment, there are still plenty of US stocks that look primed to thrive. And right now, there’s one S&P 500 stock in particular that many institutional analysts are backing.
Which stock should investors be watching?
Meta Platforms (NASDAQ:META) is currently trading around $600 a share. Yet looking at the latest analyst forecasts, the average consensus suggests that number should be much closer to $825. That’s a roughly 37.5% projected capital gain – enough to turn £1,000 into £1,375 if these projections prove accurate.
So what’s driving this bullish sentiment? In short: AI monetisation.
In Meta’s most recent quarter, new AI-powered ad tools drove a 3% increase in conversion rates and a 12% improvement in ad quality.
For advertisers, that’s a substantial increase in the value proposition of advertising on Meta’s various platforms such as Facebook, WhatsApp, and Instagram. And this steady improvement in advertising effectiveness is a big reason why click-to-message ads in the US grew more than 50% in 2025, while WhatsApp paid messaging crossed a $2bn annual run rate.
With momentum still building, it’s easy to understand the optimism. However, even the bulls have some reservations.
AI might be delivering results, but it’s coming at an enormous cost. Capital expenditure for 2026 is guided at $115bn-$135bn – nearly double last year’s pace. And if AI earnings take longer to materialise than expected, the near-term pressure on margins may not prove to be temporary after all.
So the question now is: is this a risk worth taking?
The bottom line
With indices concentrated and valuations stretched, we’re very much in a stock-picker’s market right now. And while Meta certainly isn’t the only S&P 500 stock for investors to explore, it does present a potentially compelling case for investors seeking exposure to this part of the tech sector.