Four small-cap funds and the active v passive debate
Four small-cap funds, including one micro-cap investor, recently released their latest financial results. The Deep Dive takes a closer look at each of their track records to see if it really does pay to be active.

ByFrank Buhagiar•26 Jun

Active or passive fund? Just one choice faced by investors when it comes to investing. Active – those funds run by managers who aim to outperform a specified benchmark. Passive – those funds such as ETFs (exchange-traded funds) which, by tracking specific indices, can only match the market return. The final decision rests on the individual views and preferences of the investor concerned. Believers in the Efficient Market Hypothesis (EMH) – share prices reflect all available information and so markets cannot be beaten consistently over the long term – may choose to go down the passive route. Those who believe that market prices can deviate from fair value, thereby making it possible to outperform markets, may gravitate towards active management.
There are costs to consider too. Active funds come with higher fees. A price worth paying for outperformance perhaps – provided the managers consistently deliver, that is.
Now, this is where it would be useful to have to hand a long-term outperformer or two with a track record or records that prove active managers can deliver. Step up Rockwood Strategic (RKW), River UK Micro-cap (RMMC), Montanaro UK Smaller Companies (MTU) and Montanaro European Smallers (MTE), four active funds that happened to report their latest results week ended Friday 21 June 2024. Can any (or all four) of these funds be the poster child of active investment management?
Rockwood Strategic
Looking at RKW first, the UK small-cap investorreported a +5.1% NAV total return and +15.4% total shareholder return for the twelve months to 31 March 2024. That compares to the FTSE Small Cap’s (ex-ITs) +7.1% and the FTSE AIM All-Share’s -8.6%. Performance a little off the Small Cap index but way ahead of AIM’s. Key is the longer-term track record though. Three-year performance, a particular eye-catcher: a +57% NAV Total Return compared to the FTSE Small Cap’s -6.8% and the FTSE AIM All-Share’s -38.5%.
And according to the full-year Report, Rockwoodis now “the No.1 Small Companies Investment Trust year-to-14 June for NAV Total Return and over 1, 3 and 5 years, as per the Association of Investment Companies.”
That best-in-class track record has helped move the share price from a 7.1% discount to NAV to a 1.9% premium, enabling 5,778,630 new shares to be issued. That’s a 22.7% increase in the share count which helped grow NAV to £64 million by year end. As Chairman Noel Lamb notes “This is no mean feat given 34 months of consecutive monthly UK fund outflows at a sector level and the general level of sentiment towards UK equities”.
All a big tick in the box for the investment manager’s core belief “that investment returns are generated by purchasing a share for less than the intrinsic worth of the company, (a ‘value’ philosophy)”. Investment Manager Richard Staveley, one assumes, not an EMH purist. In his full-year statement, Staveley talks about “identifying ‘catalysts’ which will unlock the share’s discount to the business’s worth or accelerate value creation. For ‘core’ investments we ourselves may be the ‘catalyst’ through the provision of capital, insight and personnel through constructive engagement with the Board, management and other stakeholders.”
And according to Chairman Noel Lamb, the fund’s UK small-cap focus provides a target-rich environment “the UK small companies market continues to provide a significant investment opportunity, due to the inefficient pricing of poorly researched or misunderstood companies trading at historically low valuations, further depressed by industry outflow driven selling.” Staveley agrees “We see a real opportunity to compound wealth for all shareholders over the long term and the potential for a revitalised but inefficient stock market full of opportunities to deliver our target returns.” A couple of ‘inefficients’ in there. RKW’sstrong track record, one for the active camp.
River UK Micro Cap
Like RKW, RMMC put in a decent performance during its latest reporting period: +6.23% NAV total return for the six months ended 31 March 2024 beat the Numis Smaller Companies plus Alternative Investment Market (excluding Investment Companies) Index’s +6.01%. And like RKW, River’s long-term track record stacks up: since the fund’s inception in April 2014, NAV total return (net of all fees) stands at +7.25% on an annualised basis while the Numis index has only managed a total return of +4.85%. Since inception, RMMC has also returned £77m to its investors.
With a track record like that, no surprise shareholders voted for the fund’s continuation at the March AGM.
As for the active/passive debate, Chairman John Blowers writes in his outlook statement that “The UK market is offered at bargain basement prices at the moment, no more apparent than in the smaller ‘micro cap’ company level (valued at less than £100m) in which the Company invests.” Bargain basement prices – not what you’d expect if markets behaved efficiently at all times.
Fund Manager George Ensor would appear to agree. In his latest doceo video update, Ensor talks about how he and the team “are trying to exploit the inefficiencies at the very bottom end of the UK market.” There’s that word again – ‘inefficiencies’. He also goes on to talk about the small-cap premium “that 3-4% premium you get from investing in smaller companies. We think there is an additional 1-2% from investing in micro caps and then there is an inefficiency so we should be able to deliver strong alpha from that part of the market.” Two ‘inefficiencies’ in quick succession. RMMC, another score for the actives.
Montanaro UK Smallers
MTU, a third UK small-cap fund to report during the week – was there a memo doing the rounds? True, MTU posted a measly looking +0.7% share price total return for the full year but NAV fared much better at +8.3%, not far off the benchmark’s +9.0%. Similarly, over 1,3, 5 and 10 years, NAV and share price total returns couldn’t keep pace with the benchmark. One for the passive camp then. Or is it? For it all depends on the definition of long term. Over the very long term, since the fund’s inception in 1995 to be precise, the cumulative NAV total return stands at 876%, that’s not far off double the benchmark’s 555%.
And as with RKWand RMMC, the fund manager’s report speaks of ‘inefficiencies’ “The market for SmallCap is inefficient”. Before offering up a reason. “While some large companies are analysed by more than 50 brokers, many smaller companies have little or no such coverage. We believe that this makes it easier for those with a high level of internal resources to identify attractive, undervalued and overlooked investment opportunities. This in turn makes it possible to deliver long-term performance over and above that of the benchmark.” Can’t argue with MTU’s ultra long-term track record. That’s another one for the actives.
Montanaro European Smallers
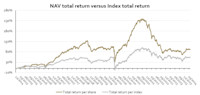
The latest full-year performance of MTU’sEuropean sibling, MTE, also fell short of the benchmark: NAV (with dividends reinvested) increased +4.9% compared to the MSCI Europe (ex-UK) Small Cap Index’s +5.9% (in Sterling terms). MTE though has fared much better over longer timeframes: NAV total returns of +68.6% and +203.4% over five and ten years respectively compared to the benchmark’s equivalent figures of +23.0% and +78.7%. And since Montanaro was awarded the mandate back in September 2006, the manager has clocked up an NAV total return of +478%, some +177% ahead of the benchmark.
As for our ‘inefficient’ monitor, the word makes yet another appearance in the manager’s full-year report “The market for European smaller companies is inefficient. While some large companies are analysed by more than 50 brokers, many smaller companies in Europe have little or no coverage. We believe that this makes it easier for those with a high level of internal resources to identify attractive, undervalued and overlooked investment opportunities. This in turn makes it possible to deliver long-term performance over and above that of the benchmark.” Sound familiar? That’s because a similar paragraph was used in the MTU report.
So, there you have it. A full house. Four funds in the small-cap space. Four funds showing how being active can pay over the long term.
Leave a Reply