Investment Trust Dividends
Thursday 22 February
abrdn Asia Focus PLC ex-dividend payment date
BlackRock Throgmorton Trust PLC ex-dividend payment date
Ecofin US Renewables Infrastructure Trust PLC ex-dividend payment date
Land Securities Group PLC ex-dividend payment date
Witan Investment Trust PLC ex-dividend payment date


VPC Specialty Lending Investments PLC
Portfolio Update
Net Asset Value (“NAV”) £ 231,570,212
NAV per Share
83.22p
Share Price (31 December 2023 Close) 66.20p
Premium / (Discount) to NAV -20.45%
Trailing Twelve Month Dividend 8.00p
Trailing Twelve Month Dividend Yield 12.08%
Look-through Gearing Ratio 0.16x
Look-through Gearing Ratio – Company Level 0.10x
Look-through Gearing Ratio – Non-Recourse 0.06x
The Company’s eCommerce investments saw a decline in the month of December in unrealised market value of the equity investments
contributing a net return of -5.18% (-4.54p). The Company’s financial technology (‘FinTech’) investments saw a decline during the month in
unrealised market value of the equity investments contributing a net return of -1.00% (-0.87p). These two are the driver of the overall
unrealised capital loss of -5.46% (-4.79p) for the month.
During December, as previously disclosed, the Company received full repayment of the Applied Data Finance, LLC debt investment on the
stated maturity date, and subsequent to year-end, the Company received full repayment of the Elevate Credit, Inc. and Koalafi (fka West
Creek Financial, LLC) debt investments. These three investments returned $38.0 million of gross proceeds to the Company, before required
repayments of the Company’s gearing facility. Pending the distribution and as noted in the Capital Return Mechanism update below, the
Company has reduced the ongoing borrowing costs in the interim to manage the returns of the Company.
Additionally, the Company exited a majority of the remaining equity investment in VPC Impact Acquisition Holdings (NYSE: BKKT), recognising
a gain of $2.4 million for the Company.
Annual Return Review Summary
For the year ended 31 December 2023, the Company produced gross revenue returns of 13.93% (13.68p) offset by gross capital returns of
-15.85% (-15.57p), expenses of -4.60% (-4.52p) and other returns of –0.58% (-0.56p) for a net return of -7.10% (-6.97p). The table below
outlines the gross revenue and capital returns by sector.
The Company’s FinTech assets continue to produce consistent revenue returns, as highlighted by a 10.05% (9.87p) return during the year.
The reduction in unrealised capital returns for the year was primarily driven by marking the equity investments to potential exit values, as the
Investment Manager evaluates near to medium-term exit opportunities to provide liquidity to the Company. As at 31 December 2023, the ECL
reserve on the Fintech debt investments was £1.6 million. As at 31 December 2023, the FinTech investments (debt and equity together)
represent 65.0% of the gross asset value of the Company’s investment portfolio.
As disclosed throughout the year, the Company’s eCommerce investments saw a decline in unrealised market value of the equity investments
driven primarily by changes in comparable multiples and the terms of potential mergers within the space. The remaining value of the
eCommerce equity positions is £3.9 million at 31 December 2023. The Investment Manager continues to work with underlying portfolio
companies as they right-size balance sheets and evaluate strategic combinations in an effort to maximise shareholder value. As at 31
December 2023, the expected credit loss (“ECL”) reserve on the eCommerce debt investments was £4.8 million, with a minimal increase in
reserves taken during the year. As at 31 December 2023, the eCommerce investments (debt and equity together) represent 25.0% of the
gross asset value of the Company’s investment portfolio.
Investment 2023 Revenue Return 2023 Capital Return
Sector Exposure % of NAV Pence per Share % of NAV Pence per Share
FinTech 65% 10.05% 9.87p -8.24% -8.09p
eCommerce 25% 3.35% 3.29p -8.88% -8.72p
Legal Finance 6% 0.53% 0.52p 0.17% 0.17p
SPAC 4% 0.00% 0.00p 1.10% 1.08p
13.93% 13.68p -15.85% -15.57p
Monthly Report – December 2023
VPC Specialty Lending Investments PLC
Current yield 14%
Discount to NAV 33%
Dividend decision due next week ?
Market waiting on the update of the timetable for the
return of capital.
We’re a few months in on the three portfolios outlined – the income, growth and balanced portfolios. What’s performance been like? A promising start!

ByDavid Stevenson•13 Feb, 2024
Over the last few months, I’ve been mapping out three different portfolios consisting of well known investment trusts: this includes a balanced portfolio (the most recent), an income portfolio and a growth portfolio. In each case, I’ve shortlisted a sensible number of funds (no more than 8), with suggested allocations in percentage terms, along with some sensible alternatives in terms of funds. The aim is to run these portfolios over the longer term, and although I don’t intend to make lots and lots of changes I do want to keep investors updated on progress.
The first portfolio outlined was an income portfolio launched in the middle of November, with the aim of providing an annual dividend income of around 5%. We ended up with eight funds in total, with 60% exposure to equities, 40% exposure to fixed income and lending, in aggregate providing an average yield of around 5.7%. To date – from the 13th of November – this collection of eight funds has delivered a gain of a smidgeon over 5% in price terms alongside a steady stream of dividend payments. A few of the funds have delivered some very big capital gains, notably BioPharma Credit whose share price has increased 12% since November. One factor that has helped is the payment by this fund of the usual ordinary dividend of 1.75c plus a special dividend of 1.20973c. That was in turn helped by two recent announcements. First off portfolio company Coherus Biosciences (11.3% of total investments at 31 December) will be making a partial prepayment of $87.5m to BPCR under its existing loan agreement (out of a total $175m prepayment of a $250m outstanding principal balance). The prepayment is expected to be made in Q2 2024. More importantly, back at the end of December, the fund announced that its most challenged borrower LumiraDx had sold its point-of-care diagnostics business to Roche for $295m. Sales proceeds from the LumiraDx transaction will be used to repay BioPharma’s loan – just over 80% of the value of the loan will be repaid. That means BioPharma’s track record of never having a loss is over but an 80% recovery rate on the single bad loan to date is not bad all things considered.
Next up we have the North American Income fund up 9.4% and JPMorgan Global Growth and Income up 9.2%. These funds have both benefitted from the general uptick in global equities and specifically US equities. One note on the JPMorgan fund which has been very active of late. The Boards of JPMorgan Multi Asset Growth & Income (MATE) and JPMorgan Global Growth and Income (JGGI) have agreed terms of a proposed merger of the two funds, to be effected via a scheme of reconstruction of MATE and a transfer of assets to JGGI. The fund has also appointed James Cook as part of the management team, to work alongside current managers Helge Skibeli and Tim Woodhouse. The only loss within this income portfolio was in shares of HICL, the infrastructure business which was down a little over 3.5%.

Funds on the Watch List this week include: SMT, SSIT, FSF, HEIT, MNL, CHRY, PCT, RSE, WTAN, BPCR, THRG, TRIG, FEV, CTY
Welcome to this week’s Watch List where you’ll find golden nuggets on trust discounts, dividends, tips and lots more…
ByFrank Buhagiar•12 Feb, 2024
BARGAIN BASEMENT
Discount Watch: 18
Our estimate of the number of investment companies whose discounts hit 12-month highs (or lows depending on how you look at them) over the course of the week ended Friday 09 February 2024 – one more than the previous week’s 17.
Half of the 18 were on the list last week: SDCL Energy Efficiency Income (SEIT), VH Global Sustainable Opps (GSEO) and Harmony Energy Income (HEIT) from renewable energy infrastructure; Baillie Gifford Shin Nippon (BGS) from Japan smallers; NB Distressed Debt (NBDD) and VPC Specialty Lending Investments (VSL) from debt; LMS Capital (LMS) from private equity; and Custodian Property Income REIT (CREI) and Life Science REIT (LABS) from property.
That leaves nine new additions: Regional REIT (RGL) from property; Aquila Energy Efficiency (AEET) from renewable energy infrastructure; BBGI Global Infrastructure (BBGI) and Digital 9 Infrastructure (DGI9) from infrastructure; Schroder Income Growth (SCF) from UK equity income; Worldwide Healthcare (WWH) from healthcare; Lindsell Train (LTI) from global; Menhaden Resource Efficiency (MHN) from environmental; and finally, Hipgnosis Songs (SONG) from music royalties.
ON THE MOVE
Monthly Mover Watch: Seraphim Space (SSIT) and Foresight Sustainable Forestry (FSF)
Keep hold of the number one and two spots on Winterflood’s list of top-five monthly movers in the investment company space. Seraphim Space (SSIT) still occupies pole position although, as with the previous week, the monthly gain has shrunk, this time to +36.5% compared to +45.3% seven days earlier – a January shareholder letter enough to keep interest in the space investor high.
Second-placed Foresight Sustainable Forestry (FSF) held on to the vast majority of its gains though. Last week, the shares were up 22.8% on the month. This week? Up +22.4%. No news out but a look at the graph shows how share price performance ticked upwards end of November/beginning of December – round about the time the peak interest rate narrative started gaining traction…
In third, Chrysalis (CHRY), courtesy of a 20.9% gain on the month – the recent Annual Results issued by the private equity investor included positive noises on the chances of one or two IPOs or other value-realising activity among its holdings getting away this year.
Another new entry in fourth, Polar Capital Technology (PCT) – shares up +12.5%. The tech investor been busy buying up its own shares. Finally, Manchester & London (MNL) takes the final top-five spot with an +11.6% rise. Investment manager Mark Sheppard has been topping up his stake in the fund.
Scottish Mortgage Watch: 2.5%
The monthly share price performance at Scottish Mortgage (SMT) as at close of play on Friday 09 February 2024 – an improvement on last week’s flat monthly showing. NAV also improved, extending its gain on the month from +1.8% to +4.9% the previous week. Finally, the wider global IT sector finished the week up +4.9%, an improvement on the +2.5% gain seen seven days earlier.
THE CORPORATE BOX
Tender Watch: US$200 million
The size of a proposed tender offer from Riverstone Energy (RSE): “The Company…proposes to return $200 million…of its excess capital to shareholders by means of a tender offer…at a price of £10.50 per ordinary share, a premium of approximately 31 per cent. to the closing market price per ordinary share of £8.00 on 7 February 2024 and represents a 16 per cent. discount to the unaudited net asset value per ordinary share of £12.53 as at 31 December 2023…The Company expects to launch the Tender Offer before the end of this month and that the Tender Offer will close during March. The precise number of ordinary shares that may be acquired in the Tender Offer…is expected will represent approximately 36 per cent. of the Company’s existing ordinary shares then in issue (excluding any ordinary shares held in treasury).”
Insider Watch: 2,850,000
The aggregate number of Harmony Energy Income (HEIT) shares acquired by “certain principals of Harmony Energy Advisors Limited…on 5 February 2024…at an average price of 39p per share. Following the acquisition of these shares, the principals of HEAL hold in aggregate 7,614,298 ordinary shares representing 3.35 per cent. of the Company’s issued share capital.”
Dividend Watch: 49
The number of consecutive years of dividend growth at Witan (WTAN). This follows the proposed payment of “a total dividend payment of 6.04p in respect of 2023 (2022: 5.80p)…The Company’s policy is that over the long term it intends (subject to market conditions) to grow the dividend in real terms, ahead of inflation. The increase of 4.1% this year is ahead of the 4.0% rate of consumer price index inflation in December 2023 and the dividend has grown substantially ahead of UK inflation over the past 5 and 10 years. The Company has increased the dividend every year for the last 49 years and the latest dividend is more than double that paid in 2013.”
1.20793 cents – the size of a special dividend announced by BioPharma Credit (BPCR). As JPMorgan explains: “This will take BPCR’s total dividends for 2023 to 10.21 cents per share of which 3.21 cents per share is special dividends. At the current share price of 93.00 cents per share…the dividend yield is 7.5%/11.0% ex/incl the special dividends.”
32.9% – the percentage increase in BlackRock Throgmorton’s (THRG) total dividends for the year: “The revenue return per share for the year amounted to 16.56 pence per share…an increase of 27.9%. The Board recognises that, although the Company’s objective is capital growth, shareholders value the dividends paid by the Company. The Directors are therefore pleased to declare a proposed final dividend of 11.45 pence per share for the year ended 30 November 2023 (2022: 8.50p). This, together with the interim dividend of 3.30 pence per share paid on 1 September 2023, gives a total dividend for the year of 14.75 pence per share, increasing the total dividend distributed to shareholders in the prior financial year by 32.9%…”
4% – the proposed increase in The Renewables Infrastructure Group’s (TRIG) full-year dividend: “The Board has set the dividend target for 2024 at 7.47p per share, representing a 4% growth on the 2023 dividend. This increase reflects strong cash generation, but also recognises inflation has reduced materially from its peak and that future cash flows are expected to be moderated by reductions in power prices…”
MEDIA CITY
Tip Watch#1: City of London (CTY)
Mentioned in despatches by The Times’ Tempus Column. In The investment group placing its trust in high-yield stocks, Tempus first highlights how “City of London is rare today in trading at a small premium to net assets. Most investment trusts have dived to wide discounts as appetite for active equity investing in general, and anything UK-related in particular, has dwindled…”
As the title of the article suggests, “The trust is chockful of large UK blue chips but with a significant ‘yield tilt’, in other words a preference for higher-yielding stocks and companies regarded as value plays. Oil companies, banks, insurers and tobacco abound.” But as Tempus points out “Last year was a disappointment. The company underperformed its benchmark, the FTSE All Share, by 3.4 per cent and lagged its peers by 4 per cent…burnt by heavy positions in poor performers such as Direct Line and Persimmon.” However, “Over longer periods, the record is stronger. By total share price return, City of London has beaten the UK equity income sector average over both five years and ten years.”
The tipster goes on to flag CTY’s cheap borrowings – “It is paying just 2.94 per cent on a £50 million note maturing in 2049, while its interest rate on another £30 million note is just 2.67 per cent. That’s a relatively low-risk way of spicing up returns…” – and the trust’s low fees – “Investors also get an edge because of the relatively low management charge of 0.325 per cent of assets managed.” But… “There are risks. Value investing may have made a bit of a comeback, but the emphasis is still on growth — as the eye-catching bounce in the US tech giants of the past 12 months attests. The kinds of companies City of London backs are often very much out of fashion.” Meanwhile, “Its commitment to dividend growth could become a two-edged sword if it forces it into too narrow a straitjacket of high-yielding stocks. In the pandemic it had to dip into reserves to keep the track record.” On balance then Tempus rates CTY as a Hold.
Tip Watch#2: Fidelity European Trust (FEV)
Is A bargain way to buy Europe’s best. That’s according to the Investors’ Chronicle. Short version of the investment case: “The managers of this discounted investment trust have proved their ability to pick the right companies time and time again”. The long version kicks off with an overview of the trust which “…looks for quality companies at a reasonable price using a rigorous investment process. It focuses on companies that can grow their dividends sustainably over a three to five-year horizon. While not an income-focused trust…managers Sam Morse and Marcel Stötzel use dividend growth as a metric to spot good companies. And by ‘good’, they mean businesses with positive fundamentals such as structural growth, disciplined use of capital and proven business models, which are also cash generative and have strong balance sheets. The portfolio is reasonably concentrated, with the top 10 holdings accounting for 46.2 per cent of the total, and the managers aim for low portfolio turnover, with a typical holding period for companies of three to five years.”
And as the article points out: “The strategy has paid off in spades in the past decade…The trust has comfortably outperformed its peers on a 10-year basis, and came second over five and three years. Reflecting its focus on dividend growers, it has also increased its own dividend by an average of 12.1 per cent a year over the past five years.” Looking ahead, despite identifying “…a series of risks for the continent, including geopolitics, the inverted yield curve and tighter credit conditions for companies…Morse and Stötzel argue that, in the long term, markets are driven by ‘real dividend growth of companies’, rather than by economic growth.” Luckily, “The European stock market has some solid businesses that operate around the world, not just in Europe, and the managers try to single them out.”
In conclusion, the Chronicle writes: “Fidelity European traded at a discount to net asset value (NAV) of 9 per cent on 5 February. With the average sector discount standing at 10 per cent, this is less cheap than some peers, perhaps unsurprisingly considering the trust’s strong track record. But the discount still represents an opportunity to get exposure to big European quality companies at a lower price. As the biggest trust in the sector, Fidelity European has a decent chance of seeing its discount close if market conditions improve, which would add to its NAV performance.”
A 360 view of the latest results from BASC, BUT, DIVI, SAIN, PCFT, CTY
Other than the Houses of Parliament, where else can you find a Lord and a Sir? The latest Doceo Weekly 360 round-up of investment company results and broker commentary that’s where…
ByFrank Buhagiar
“Perhaps the Goldilocks thesis of a solid economy, markedly lower inflation, and lower interest rates that emerged in December will hold, but perhaps it will not. Perhaps the continued leadership of large-caps (8 of last 10 years) and extreme market concentration will hold, but perhaps it will not. We see the ‘perhaps not’ outcome of the above scenarios as having a higher probability than the market currently thinks.” Brown Advisory US Smaller Cos (BASC) Half-year Report.
We are unconvinced
Half-year Report from Brown Advisory US Smaller Cos (BASC). As Chairman Stephen White writes: “…NAV…per share rose from 1,431.9p to 1,459.2p, an increase of 1.9%. Having moved within a narrow trading range for much of the period, US equity markets moved ahead again in December as a result of comments made by the US Federal Reserve (the Fed) that the peak in interest rates had probably been seen. While the mega caps again led the advance, smaller companies also performed reasonably well and showed signs of returning investor interest. Over the period, the Company’s benchmark, the sterling adjusted Russell 2000 Total Return index, realised a gain of 7.8%. The underperformance of the Company’s NAV…arose largely in December. This followed a sudden inflow of funds into the more speculative, unprofitable and leveraged smaller company sector – an area which the Company prefers to avoid. Over the six months, the Company’s share price rose from 1,220.0 p to 1,292.5p, a gain of 5.9%.”
The portfolio manager adds: “The Company’s absolute returns were once again solid for the period despite meaningful market volatility…We added a number of new businesses to our portfolio in 2023, many of which are below our ultimate intended weight and therefore offer significant buying potential going forward. When combined with our legacy positions, we are well positioned to deploy cash across the portfolio and, more importantly, respond nimbly to market swings. We are unconvinced that the drivers behind December’s rally, despite it being a signal of improving investor sentiment and the extreme market concentration towards mega-caps, will hold indefinitely. As such, we believe that our current sector biases and capital deployment plan remain sound as we eagerly anticipate a return to small-cap market leadership, from which BASC will be well positioned to benefit in the long-term.”
Winterflood writes: “Going forward, the managers expect smaller companies to perform well if economy remains resilient, inflation decreases and interest rates fall. NAV outperformed benchmark since Brown Advisory appointment on 1 April 2021 (+1.0% vs +0.3%). No gearing deployed, but Board will consider should market conditions improve. Ongoing charges 1.03% (30 June 2023: 1.00%). Fund passed continuation vote at November 2023 AGM.”
Tale of the week
“…the tale of the man who’s found searching for his keys under the streetlight. When asked if that’s where he lost them he replies no, he lost them in the park, but this is where the light is.” Brunner Investment Trust (BUT) Portfolio Manager’s Review.
5th consecutive year of outperformance
Brunner (BUT) has only gone and done it again. Chair Carolan Dobson reveals all: “Brunner once again beat its benchmark over the year to 30 November 2023…NAV…per ordinary share total return (calculated on a net dividends reinvested basis with debt at fair value) was +8.7%, versus +5.5% for the composite benchmark (70% FTSE World Ex. UK / 30% FTSE All-Share). This marks the 5th consecutive year of outperformance of the benchmark…As we are only relatively small holders of the…stocks that led markets forward, the board is particularly happy to report this consistent progress to shareholders.” And the Chair believes “Brunner should be viewed as an ‘all weather global equity portfolio’…providing solid outperformance through a variety of market and macroeconomic conditions. The portfolio is constructed with a focus on high quality companies that are expected to perform well over the long term. The managers do not look to build a portfolio that will perform on a particular economic condition or trigger – rather they remain aware of these external factors and review how they might impact the individual companies within the portfolio.”
Looking ahead, the portfolio managers’ eyes are very much fixed on the long term: “Changes to interest rates or our political leaders are unlikely to determine whether companies such as Microsoft or Diageo prosper or flounder. We are more focused on long-term trends which we believe come with more visibility. We know that society will inevitably age, that the population of India and Africa will continue to grow, that Japan’s will shrink. It seems probable the world will need more semiconductors, that people will travel more, that we will electrify our energy system to reduce carbon emissions. As we consistently aim to highlight, we prioritise thinking about the long term and we encourage our shareholders to share that vision. If you’re in…for the long haul, economic cycles are an inevitable part of life, not a reason to panic. We deliberately select businesses that we expect to continue to flourish, whatever the weather.”
JPMorgan writes: “BUT’s relative NAV performance has improved vs peers and it now ranks 2nd in the sector on the basis of five-year NAVTR, and 6/13 over the last year. This has been achieved despite the drag of a large UK allocation, with the UK underperforming the FTSE World, implying excellent stock selection…we believe that a 25% allocation (vs 30% weight in the compositie benchmark) to this market is too high in the context of a global fund, where a neutral rating would be 4%. We think investors who want a high UK exposure would generally prefer a combination of a UK equity focused trust and a global trust with a more global allocation closer to that of a typical global index. Although boasting a 52-year record of dividend increases, the payout could be more generous given the size of the reserves, with the yield of 1.9% not particularly exciting, though higher than many peers…While acknowledging the impressive performance, we prefer Global funds without a structural overweight to the UK.”
Quote of the week
“Investor Jim Grant once said: ‘to suppose that the value of a common stock is determined purely by a corporation’s earnings discounted by the relevant interest rates and adjusted for the marginal tax rate is to forget that people have burned witches, gone to war on a whim, risen to the defence of Joseph Stalin and believed Orson Welles when he told them over the radio that the Martians had landed. That’s always been the case. And it always will be the case. Every investment price, every market valuation, is just a number from today multiplied by a story about tomorrow’. Brunner Investment Trust (BUT) Portfolio Manager’s Review.
Expected to become a tailwind
Half-year Report from Diverse Income (DIVI). According to Chairman Andrew Bell: “The Trust’s NAV total return was down 1.3% over the half year, in contrast with the total return of the Deutsche Numis All-Share, Index, (dominated by returns on the largest stocks) which rose by 1.6%, and that of the Peer Group which rose 0.3%. The share price total return was -2.2%, owing to a slight widening of the discount, from 6.2% at the end of May to 7.3% at the period end.” But as the Chair points out: “Whilst recent returns have been disappointing, they are atypical of shareholders’ experience since the Company listed in 2011. Over the twelve years and seven-month period since issue, the Trust’s NAV total return was 171.7%, and its share price total return 144.0%, which compares to 147.4% for the peer group and 92.5% for the Deutsche Numis, All-Share Index.”
As for the outlook: “…since late October, when there were tangible signs of the UK’s inflation performance improving (alleviating fears of a further series of interest rate rises), the ensuing market recovery has been led by smaller and mid-sized companies. If this trend continues, the Company’s exposure to smaller companies can be expected to become a tailwind and see better rewards in the coming year, on the back of improved earnings performance (as the cost and demand hurdles abate) and a greater willingness of investors to give credit for the fundamental performance of smaller companies.”
Numis notes: “Diverse Income (£258m market cap) is differentiated from its UK Equity Income peers by its strategy of investing across the market cap spectrum, rather than focusing on the FTSE 350. Given the nature of the portfolio investors should expect that performance will at times significantly diverge from index and peers, as the interims highlight and is reflected in weak relative performance for the last couple of years given the funds bias to smaller cap companies which have been weak largely on recessionary fears…Over the last five years, the fund has underperformed the Numis All Share, with NAV total returns of 11.6% (2.2% pa) compared to 22.7% (4.2% pa). That said, the longer-term track record remains intact generating NAV total returns of 171.7% (8.2% pa) versus 147.4% (7.4% pa) for the peer group and 92.5% (5.3% pa) for the Numis All Share index.”
Hysteria of the week
“During the past few years it seems that some parts of the media have become, for want of a better word, hysterical. Even the financial press, which used to be renowned for walking a line between dry and tedious, has often joined the fray of shouty headlines and breathless articles. This is understandable. Technology has disrupted the business models of traditional media channels. In a digital world, whoever conjures the most shocking headlines will gather the most clicks. And whoever accumulates the most clicks might be able to keep their jobs.” Scottish American (SAIN) Investment Manager’s review.
Strong
That’s how Chairman Lord Macpherson of Earl’s Court describes Scottish American’s (SAIN) full-year performance: “SAINTS delivered a strong absolute return over the year…net asset value total return…was 11.8%.” Despite this, “…SAINTS’ returns did not keep up with global equities (as measured by the total of return of the FTSE All-World Index in sterling terms) which returned 15.7% over 2023…” The Chairman highlights “…two principal reasons why SAINTS’ NAV return did not keep pace with the market, both of which relate to features which the Board regard as intrinsic strengths of SAINTS. The first is the nature of its equity portfolio, which is built for and has delivered dependability and growth in income and capital over the long term. Many of the large technology related companies which have dominated market returns over the year do not sit well with this approach, and so SAINTS has not owned them…The second reason relates to SAINTS’ diversification of assets and in particular to its property investments. These bring benefits in terms of diversifying sources of return, spreading risk and boosting revenues, but will not always keep pace with equities.”
In terms of outlook, the Chairman believes “Whether the landing is soft or hard, it is likely to be a year in which pricing power and balance sheet strength are of growing importance. At the same time, both the changing world and entrenched competitive advantages will continue to present opportunities for secular growth at the company level…As a Board, we believe a long-term approach based on investing globally for sustainable growth is the best route to achieving SAINTS’ aim of growing the dividend ahead of inflation over time. As we look ahead, we also take considerable comfort from the nature of SAINTS’ investments, and from the managers’ emphasis on quality, on dependability and on growth far out into the future…SAINTS has been working for individual investors for 150 years. It is built to help shareholders’ income keep pace with inflation, as well as providing capital growth. And it is built for resilience.”
Numis sees value: “Scottish American offers a differentiated approach to income, with the equity portfolio supplemented by a small allocation to bonds, infrastructure and property. The fund…looks to invest in income generating stocks, which also offer growth potential. The fund underperformed during the period, largely owing to underweight mega cap tech exposure, while the property and infrastructure assets were a drag on relative performance. That said, the fund’s long-term track record remains solid, with NAV total returns of 224% (12.5% pa) compared to 212% (12.0% pa) for the MSCI AC World in Sterling terms. The fund has historically traded on a premium, and has averaged a relatively tight discount of c.3% over the last year, however the shares have recently widened to a c.8% discount which we believe offers good value. We do not expect the changes in management team to have a significant impact on the approach, with James Dow remaining lead manager.”
While JPMorgan is staying neutral for now: “Although SAINTS has an impressive track record of dividend increases, it has a yield that is currently lower than the peer group average (2.8% vs 3.7%) and the dividend is now uncovered. The NAV TR has been ahead of the peer group average on a rolling five-year basis but behind the peer group average more recently if looking at rolling three- or one-year periods…In our view, the SAINTS strategy makes it differentiated from peers and also other Baillie Gifford-managed investment companies. It is clear SAINTS is taking a long-term view and aiming to deliver resilient performance in the long term. We like to see companies that are differentiated and that stick to strategies without unnecessary style drift but we also think in the shorter-term SAINTS may remain out of favour vs peers that have more attractive dividend yields in a sector where investors are clearly focused on income and in particular if its NAV TR continues to weaken vs peers. We remain Neutral.”
Illusion of the week
“There is a well-known pictorial illusion which, depending upon the viewer’s perspective, can look like a duck or a rabbit (Google ‘duck or rabbit’ to see). For much of the second half of 2023 this was what faced investors. Inflation rates were falling sharply, and interest rates had reached a plateau, but was the reason that higher rates were leading economies towards a recession (the hard landing fear) or that inflation had been more transitory than was diagnosed in 2022 so that its elimination did not require a recession and economies could rebound as it fell?” Diverse Income (DIVI) Chairman’s Statement.
Frustrating
That’s how Chair Simon Cordery describes Polar Capital Global Financials’ (PCFT) year: “2023 proved to be a most frustrating year for investors in the global financials sector. While we saw broad stock market improvements over the period, predominantly led by technology, the financials sector underperformed, following a few years of relative out-performance.” Over to the investment managers for the numbers: “…net asset value fell 2.9% while the benchmark index, the MSCI All Country World Financials Index, rose 0.3% and the MSCI All Country World Index rose 6%…Performance in the first half of the year was largely satisfactory but the second half was disappointing. While we had no holdings in Credit Suisse, First Republic Bank or Signature Bank and only a very small holding in Silicon Valley Bank (SVB) an overweight position in US banks was a headwind to performance…our bias to higher quality companies hurt performance as they lagged peers and our overweight position in defensive names towards the end of the year led to some underperformance on a sharp rotation and market rally.”
Sticking with the investment managers for the outlook: “Financials are a play on a soft landing, as illustrated by the sharp jump in US bank shares on the more dovish language used by Federal Reserve Chair Jerome Powell in December when he left interest rates on hold and indicated the era of rises was over…if actions follow words, a more accommodative policy will reduce the tail risk of a sharper downturn in the shorter term. Consequently, we are constructive on the outlook for the sector as the policy reduces many of the concerns around the US banking system with regard to the unrealised losses on securities portfolios and the potential for increased loan losses…Underlying operating performance is good and will be underpinned at much higher levels unless interest rates return to the levels seen two plus years ago. Consequently, we remain very constructive on the outlook for returns from the sector over the coming year.”
Numis is a fan: “The fund is managed by a strong and experienced team who use their sector expertise to give access to specialist areas of the market that more generalist investors may find hard to analyse. Exposure is broader than traditional banks, including exposure to payment systems and insurers. We note that John Yakas retired in June last year, but we believe that the fund is in safe hands under Nick Brind and George Barrow, whilst the team has been bolstered by Tom Dorner joining. Since the fund’s reconstruction in April 2020, PCFT has returned 68.8% on a NAV total return basis, as compared to 67.7% for the MSCI ACWI Financials. We believe the fund is an attractive holding for exposure to financials. Polar Capital Global Financials is currently trading on a 9% discount to NAV.”
Just because of the week
“…just because something is important doesn’t mean it is valuable…” Brunner Investment Trust (BUT) Portfolio Manager’s Review.
Attractively valued
City of London (CTY) Chairman Sir Laurie Magnus CBE gets straight to the point with his half-year statement: “City of London achieved a 6.5% net asset value total return during the six months to 31 December 2023 against a backdrop of falling inflation and market expectations that interest rates have peaked.” That’s a better outcome than the index: “The UK equity market returned 5.2%, as measured by the FTSE All-Share Index, with medium-sized and small companies slightly outperforming larger peers.” As for the fund’s performance drivers: “Stock and sector selection contributed by 171 bps. The underweight positions in pharmaceuticals and AstraZeneca were respectively the biggest sector and stock contributors. The second biggest sector impact arose from being overweight in real estate investment trusts, with Land Securities a notable stock contributor…Other notable stock contributors were 3i, whose main asset is its shareholding in Action, a fast-growing discount retailer in Europe, and Round Hill Music Royalties Fund, which was taken over.”
The Chairman goes on to say: “UK equities remain attractively valued relative to overseas equivalents. This has encouraged further takeovers of UK companies by private equity firms and foreign businesses, including the acquisition of Round Hill Music Royalties Fund from the Company’s portfolio. There has subsequently been a bid in January 2024 for Wincanton, another of City of London’s investee companies, from a large French private company. More takeovers can be expected while the discounted value of UK equities relative to global peers persists. Although the prospect of political change in the UK may weigh on equity valuations until after the general election, the compelling dividend yields from many companies effectively ‘pay investors to hold on’ and should help to mitigate the downside risks of current uncertainties.”
Numis sounds positive: “We continue to view City of London IT as a solid option for investors seeking income from UK equities. Job Curtis has managed the fund since 1991 and his track record over the past 10 years is strong, with NAV total returns of 72% (5.6% pa) compared to 66% (5.2% pa) for the FTSE All Share…The fund pays a yield of 5.2% compared to an average of 4.4% for the sector and the fund has increased its dividend every year since 1967 – and it has significant distributable reserves to continue this (revenue and capital reserves). The fund is the largest within its peer group, with net assets of £2.0bn and shareholders benefit from a low ongoing charges ratio of 0.37%, which will reduce following the fee reduction to 0.30% pa (from 0.325% pa). It is interesting to see the secondary listing in New Zealand being delisted, historically UK Listed Investment Companies have been an attractive tax-efficient way for New Zealand based investors to invest internationally, and secondary listing were popular, although less so in recent years as we expect NZ investors may now have a wider range of options available.”
Stat of the week
“A study by Hendrik Bessembinder, a finance professor at Arizona State University, found that half of all wealth generation by US stocks between 1926 and 2019 came from fewer than 100 stocks: a tiny fraction of the overall universe.” Brunner Investment Trust (BUT) Portfolio Manager’s Review.
This Is Money
Story by Jeff Prestridge •
It also pays shareholders an income linked to the growth in the trust’s assets. In simple terms, if the assets increase in value, shareholders see their dividends boosted.
For the current financial year to the end of June, it will pay quarterly dividend payments of 4.61p a share, 8.5 per cent higher than in the previous year (two have already been paid). They equate to an annual dividend of 3.2 per cent with the shares trading just above £5.30. The payments come from a mix of income from the portfolio and use of the trust’s income and capital reserves.
These factors – performance, investment clarity and growing income – have combined to turn this JP Morgan flagship trust into something of a must-have investment. As a result, demand for its shares from a combination of private investors and wealth managers is such that they trade just above the value of the trust’s assets – at a so-called premium.
It’s going to be ‘two steps forward, one step back’ with inflation, says JPMorgan’s Meera Pandit
This healthy position has persuaded the trust’s board to expand the fund by £40 million through a placing of shares and a retail offer. The placing is expected to be taken up by wealth managers keen to get clients on board while the retail offer will attract a mix of existing and new private investors. The offer shuts on Tuesday.

JPMORGAN GLOBAL GROWTH & INCOME: The £2.3bn ‘all-weather’ fund that seeks out the world’s best.
The numbers back what Cook says. Over the past five discrete one-year periods, the trust has delivered total returns of 17.1 (in the year to February 2024), 5.8, 18.9, 15.9 and 20.3 per cent. The triumvirate of fund managers is supported by some 80 in-house analysts who scour the world in search of companies that could fit into the fund’s all-weather portfolio. Currently, they have about 2,500 stocks on their radar, but only 52 sit inside the fund.
The trust’s portfolio is skewed towards the United States with 65 per cent of assets in the US and eight of the top ten holdings being big American companies.
Although some of the ‘magnificent seven’ US stocks are held – Amazon, Meta, Microsoft and Nvidia – it eschews Alphabet, Apple and Tesla because there are better alternatives.

JPMORGAN GLOBAL GROWTH & INCOME: The £2.3bn ‘all-weather’ fund that seeks out the world’s best© Provided by This Is Money
The four it holds are primarily liked because they are at the forefront of the ongoing Artificial Intelligence (AI) revolution.
Other stocks that the managers are keen on include Swedish car and truck manufacturer Volvo and semi-conductor giants Taiwan Semiconductor Manufacturing Company and Dutch-based ASML.
Cook says that the trust’s expansion will not change the composition of the portfolio with the cash raised employed across all 52 stocks.
While Cook says company profit margins are likely to come down in the coming months as demand in the world economy decreases, he still thinks there are opportunities for astute managers to generate returns by identifying strong companies standing at attractive valuations.
The fund’s stock market ticker is JGGI and its identification code BYMKY69. Ongoing fund charges are competitive at 0.5 per cent.
Experts reveal what funds they would buy to benefit from a revival of UK equities.
By Jean-Baptiste Andrieux,
Reporter, Trustnet
UK equities haven’t been particularly popular with investors in recent years, as their returns have significantly lagged those offered by their international competitors, in particular US mega-cap growth stocks.
The UK hasn’t helped itself either, as the country has been plagued with political instability and gloomy forecasts for the domestic economy.
As a result, UK equities are now trading on a forward price-to-earnings multiple of approximately 10.7x versus 16.5x for their global peers. Moreover, UK equities are also trading below their historic average, which means there may be room for a positive re-rating.
Jason Hollands, managing director at Bestinvest, said: “Those prepared to go against the herd now and buy, could see a significant uplift over time if UK stocks re-rate towards more normal levels.
“That could come from overseas predators on the hunt for a bargain, but also from companies themselves as a notable trend has been a significant uptick in companies using cash on their balance sheets to buy back their shares. Around half of UK companies are estimated to have announced buyback programmes over the past year.”
Below, three experts explain how investors can build a comprehensive allocation to the UK market by pairing complementary funds.
Simon Evan-Cook, manager of the VT Downing Fox funds range
Evan-Cook is enthusiastic about the prospects for UK equities, thanks to their attractive valuations, the opportunity set and strong corporate governance.
To benefit from a UK equity revival, he suggested pairing VT Cape Wrath Focus with VT Castlebay UK Equity.
Performance of funds over 10yrs vs sector and benchmark
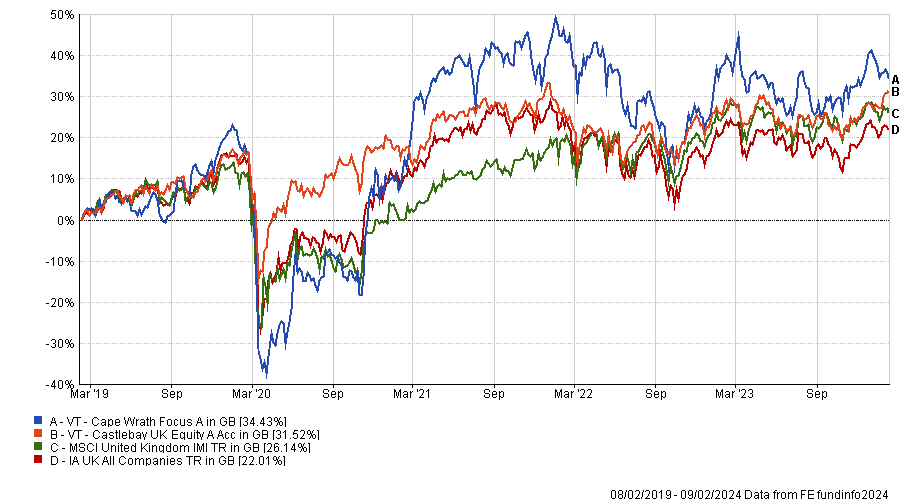
Source: FE Analytics
Evan-Cook said: “To my mind the epitome of the perfect pairing is Marmite and toast. I wouldn’t normally use this to represent a fund pairing though, as both parties would object to being the love-it-or-hate-it Marmite. But in the case of Adam Rackley and his VT Cape Wrath Focus fund, I suspect he’ll take it as the compliment it is.
“This fund is Marmitesque because it’s small-cap, UK-focused and run on a contrarian value basis. These are things that, apparently, cause many professional fund buyers to be a bit sick in their mouth. Rackley is unapologetic for this. He knows, as do we, that if you want to make the highest long-term returns, there’s no richer hunting ground than small-cap value.”
Yet, Evan-Cook warned that investors in this fund are in for a bumpy ride, which is why it should be held alongside a few other UK equity funds that can compensate when it’s out of favour.
This is where VT Castlebay UK Equity, managed by David Ridland, intervenes. The fund focuses on quality companies higher up in the market-cap scale.
Evan-Cook said: “Pairings like these are bread and butter (plus spreads) for us within our Downing Fox funds. We want our investors to benefit from holding great active funds, but we also want them to have an emotionally easier journey than holding just one by itself.”
Over five years, the two funds have a 0.69 correlation with each other, according to FE Analytics.
Jason Hollands, managing director at Bestinvest
For his ideal allocation to UK equities, Hollands picked WS Evenlode Income, Artemis UK Select and Fidelity Special Situations.
Performance of funds over 10yrs vs sector and benchmark
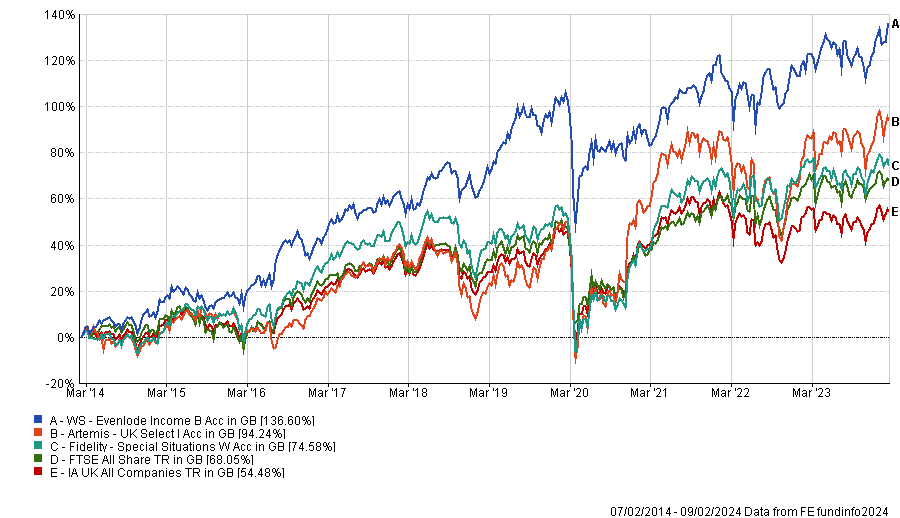
Source: FE Analytics
WS Evenlode Income has a quality-growth bias and a strong international flavour, as most of its investee companies generate their earnings overseas, despite being based in the UK.
Hollands said: “The fund is managed with a team-based, collegiate approach from a barn conversion in Oxfordshire and targets companies with low capital intensity and high returns on capital that generate strong free cash flow, which can compound returns over time.
“The approach has a quality bias, with companies bought on a buy-and-hold, long-term basis. The investment process of avoiding companies involved in activities that require constant investment in plant and machinery means it has no exposure to capital intensive sectors like energy, but instead it has high relative weightings to industrials, consumer staples and technology.”
The Artemis UK Select fund offers a different sector exposure, with energy giants such as BP and Shell as well as banking stalwarts Barclays, Natwest and HSBC among its top holdings.
The fund’s managers, Ambrose Faulks and FE fundinfo Alpha Manager Ed Legget, roam across the whole UK market-cap spectrum to identify the best ideas, although they tends to focus more on large- and mid-cap stocks rather than smaller companies.
Hollands said: “The managers seek out companies they believe have good earnings growth prospects but where they believe the current valuations are too conservative and therefore have the potential to be rerated. While the fund isn’t a dogmatic ‘value’ fund that is solely focused on cheap shares, it does have a modest value style bias.”
Another particularity of the fund is its flexibility to take selective short positions in stocks the managers believe have got too expensive and/or where the share price could decline. It currently has three short positions.
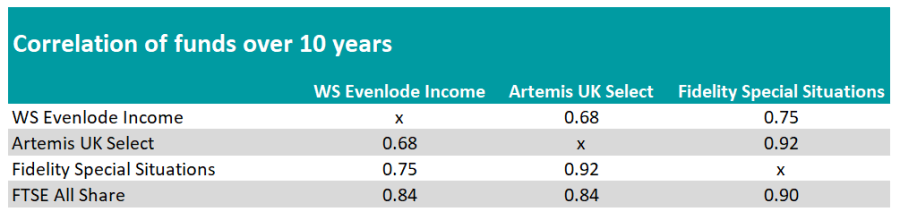
Finally, the role of Fidelity Special Situations is to provide exposure to UK small and mid-cap companies. Although they have been out of favour in recent years, Hollands highlighted that ‘smid’-caps have historically provided “significant opportunities” for generating high returns over the long-term.
“Managers Alex Wright and Jonathan Winton are contrarian investors who seek out unloved companies with the potential for positive change. This can mean companies that have seen a change of management, which are undergoing a turnaround, have been hit by worries about regulatory disruption or where the competitive environment is improving,” Hollands explained.
“Backing these companies early enables the managers to benefit from re-rating as the wider markets eventually recognise the improving situation.”
Nick Wood, head of fund research at Quilter Cheviot
Nick Wood, head of fund research at Quilter Cheviot, recommended building an allocation to UK equities with Schroder Recovery and Liontrust UK Growth.
Performance of funds over 10yrs vs sector and benchmark
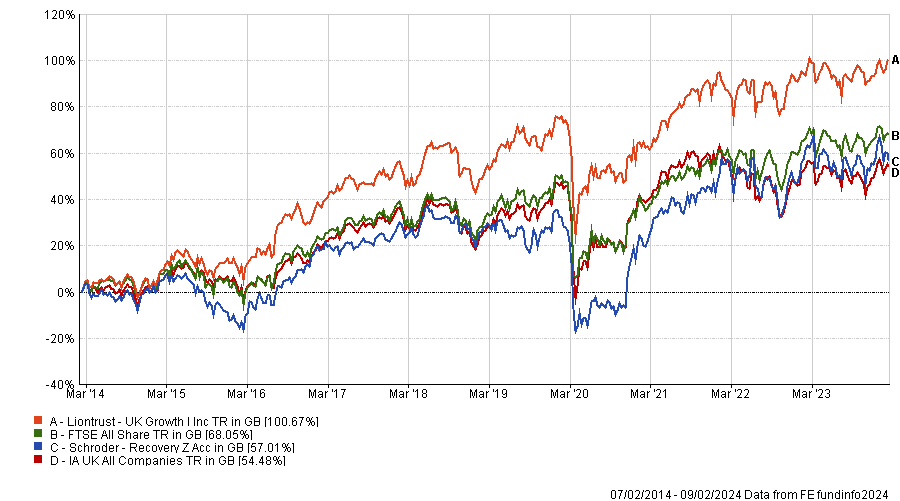
Source: FE Analytics
Schroder Recovery is a value fund, which currently has a meaningful bias down the cap scale relative to the index.
Wood said: “Schroder Recovery is one of the few pure value managers in the UK, with a track record of managing in the same way counted in decades.
“The team has been adept at managing through periods in which their style is somewhat out of favour, with the last 10 years primarily favouring growth investors, yet the fund proving able to match the market over that period.”
Liontrust UK Growth is the polar opposite of Schroder Recovery, as it follows a quality-growth style and has little exposure to the small and mid-cap space. Over 10 years, both funds have a correlation of 0.76 according to FE Analytics.
Wood added: “The team looks for companies with sustainable structural advantages and has a bias towards higher quality growth companies. There is a bias towards industrials, consumer and energy stocks, although the manager tends to avoid miners and banks.”
© 2026 Passive Income Live
Theme by Anders Noren — Up ↑