
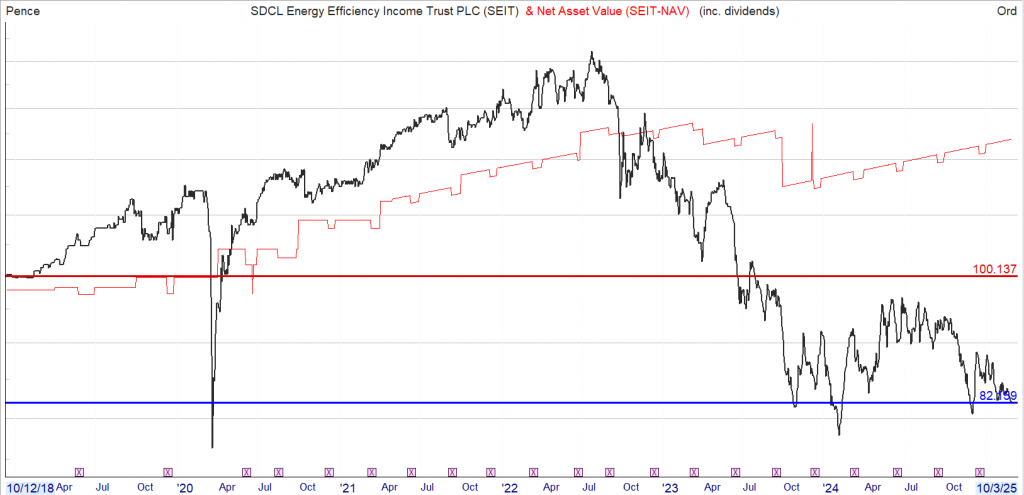
10 year chart with dividends re-invested back into the Trust.
Current yield 1.29%
Current discount to NAV 7%
Investment Trust Dividends
10 year chart with dividends re-invested back into the Trust.
Current yield 1.29%
Current discount to NAV 7%

GOLD MEDAL
The UK’s biggest investment trust, Baillie Gifford-managed Scottish Mortgage, is the clear winner over 20 years, generating a total share price return of 1,978%, equivalent to an annualised return of 16.4% a year.
The bulk of the gains (76%) have come from capital gains, with just 24% coming from reinvested dividends, whereas the average split across the illustrious group of dividend heroes is 60% from income and 40% from capital.
This split isn’t too surprising given SMT’s investment philosophy, which is to own ‘the world’s most exceptional growth companies’.
These types of companies tend to be leaders in their fields and at the cutting edge of new industries, meaning they prioritise investing in growth over paying out dividends.
Fund managers Tom Slater and Lawrence Burns believe share prices follow business fundamentals over the long-term, while short-term price movements are overwhelmingly driven by other factors.
During 2022, rising interest rates impacted growth companies disproportionately, leading to underperformance of the trust, but the managers believe part of their edge is the ability to look through such ‘noise’ and focus on long-term business performance.
Arguably, the trust’s long-term success reflects the managers’ good judgement in backing the best growth companies which is then reflected in higher share prices.
Looking outside the publicly-quoted holdings, around a quarter of the fund is invested in private companies.
Scottish Mortgage owns stakes in half the world’s top 10 unicorns (private companies valued at more than $1 billion), including SpaceX, the fund’s largest position, Chinese social media group and Tik-Tok owner ByteDance, online payment processing group Stripe and video games maker Epic Games.
Some of the private companies the trust originally invested in have become publicly traded and still remain in the fund, such as music streaming firm Spotify (SPOT:NYSE) and Chinese shopping platform Meituan (3690:HKG).
The top 30 positions in the fund represent 79% of the portfolio and three have been held for more than a decade, including Amazon (AMZN:NASDAQ), Tesla (TLSA:NASDAQ) and Dutch semiconductor equipment maker ASML (ASML:AMS).
Over the last decade, the trust’s top five performing holdings have contributed nearly 60% of the fund’s total returns, with Amazon contributing the most in terms of absolute percentage points, while AI darling Nvidia (NVDA:NASDAQ) is the fund’s best performing holding, rising an incredible 10,188% over that timeframe.
Looking forward, it seems a fair bet the proven investment skills of Slater and Burns should continue to deliver strong investment returns, although, as they themselves acknowledge, returns are often accompanied by high volatility. [MG]https://datawrapper.dwcdn.net/vEGri/1/
SILVER MEDAL
Launched back in 1868, F&C (FCIT) has the distinction of being the world’s oldest collective investment trust.
Although it is a Dividend Hero, with more than 50 years of consecutive increases, it has always focused more on growth investing than income.
In the late 19th century, it owned government bonds in countries which today we might think of as emerging markets like Brazil, Egypt and Turkey, as well as US railroad company bonds just as investment in the railways boomed.
In the 1920s, the trust diversified into stocks, and since the early 2000s it has invested in private equity, both as a way of diversifying risk and creating potential for large capital gains.
Until 2013, much of the trust’s equity holdings were in UK-listed companies, but since then it has renewed its original focus of investing overseas and today less than 10% of its assets are in UK-listed stocks.
A look at the top holdings shows the focus on growth and foreign markets, with the six of the ‘Magnificent Seven’ in the top six positions by weight.
Speaking to the AIC (Association of Investment Companies) in December on the outlook for markets in 2025, manager Paul Niven said he was ‘relatively constructive on equities,’ in particular US tech stocks, where he argued earnings growth outweighed any valuation concerns.
‘Valuations are high, though this tends to be concentrated in the US and in the obvious names such as the Magnificent Seven. Although the premium levels of growth which are expected from this area look set to diminish, their earnings delivery should still comfortably outstrip that of the wider market. While numerous other areas and markets are trading at lower levels of valuation, growth prospects in these areas typically still appear far more fragile or anaemic.’
However, it would be wrong to assume US tech stocks have driven the trust’s performance – if we rewind to 2014, the 10-year total return was 173%, yet there was just one tech stock in the top 10 holdings, Alphabet (GOOG:NASDAQ), or Google as it was called back then, while the rest were mainly US and European health care companies plus BP (BP.A) and HSBC (HSBA).
There are a number of stocks in the portfolio today which were in the portfolio 20 years ago, including Shell (SHEL), which was one of the trust’s first ever equity purchases in 1925, and has returned around 300% over the past 20 years.
Other names which the trust owned 20 years ago, and which are still in the portfolio today, include AstraZeneca (AZN) (total return 1,110%), Elevance Health (ELV:NYSE) (1,080%), RELX (REL) (1,200%), SAP (SAP:ETR) (1,370%) and TSMC (2330:TPE) (7,000%).
BRONZE MEDAL
Less well-known than the other podium-placed names in our list of dividend heroes measured by 20-year total return, BlackRock Smaller Companies has found the going a little more tough in recent times.
This, and the trust’s near 13% discount to net asset value, is a reflection of the relatively weak sentiment towards the small-cap space.
Nonetheless, it’s not a huge surprise to see a smaller companies trust score well over the long term given small-caps have more scope to grow than their larger listed counterparts.
Run by Roland Arnold for nearly seven of the past 20 years, the trust is almost exclusively UK-focused and as its strong total return record would imply it has consistently beaten the benchmark.
These are ‘smaller’ rather than small companies – the top 10 holdings have an average market cap of roughly £950 million.
Some names have been in the portfolio for some time: flexible office space provider Workspace (WKP), for example, was a holding 10 years ago.
Other names in the top 10 are publishing outfit Bloomsbury (BMY), engineering and infrastructure firm Hill & Smith (HILS) and mobile payments company Boku (BOKU:AIM).
House broker Shore Capital outlines the trust’s investment process: ‘Through bottom-up stock selection, the manager seeks quality companies with the potential to grow significantly. Typical attributes include competent management teams, attractive growth prospects irrespective of market conditions, good cash generation and strong balance sheets.
To identify these opportunities, the BlackRock team spends a considerable amount of time with company management teams, often attending over 700 company meetings a year.
As Shore notes, the focus is on capital appreciation but it is the bias towards cash-generative companies which has supported the trust’s ability to keep raising the dividend for 21 years and counting.
The financial discipline required to pay a regular dividend can be a good marker of quality in a universe where corporate failures are more commonplace.
In his most recent commentary on the trust’s performance, manager Arnold notes the valuation of UK small- and mid-cap companies is ‘attractive on an historic basis’.
‘As we move through this near-term noise, the opportunity presented by UK small- and mid-caps will present itself, and maybe we will finally see investors looking to allocate back to what has historically been a profitable asset class,’ adds Arnold.
The ongoing charge is 0.8%, which is fairly competitive compared with other trusts in the Association of Investment Companies UK Smaller Companies sector.
The names which have delivered the most to investors
Thursday 27 Feb 2025

Hotter-than expected UK inflation for January, with headline CPI up 3% year-on-year versus the 2.8% expected, combined with a volatile geopolitical backdrop, means investors should be seeking ways to protect their income.
Shares has long championed the unique advantage investment trusts have when it comes to paying regular and progressive dividends, since these funds are able to hold back up to 15% of the income they receive from their investments in their revenue reserves.
They can use these reserves to boost dividends during lean spells when businesses may be cutting their payouts. This structural benefit has enabled many investment companies to pay consistently rising dividends through both good and bad years for many decades, a record unrivaled by other funds such as unit trusts.
You may have heard of the AIC’s (Association of Investment Companies) ‘Dividend Heroes’, classified as trusts which have increased their dividends for 20 or more years in a row – impressively, 10 of these dividend heroes have over half a century of unbroken annual increases under their belts.
The AIC’s well-followed list helps you spot products with lengthy dividend growth streaks, but you’ll need to do some digging to discover which ‘heroes’ have consistently delivered the best total returns, or for that matter, whether those returns have predominantly come from capital growth or income.
Fear not, however, as care of our friends at the AIC, Shares has crunched the numbers going back 20 years to see which dividend heroes have made the most money for shareholders.
Read on for a run-through of the heroes which have consistently delivered for shareholders and for detailed profiles of the top three performers, who take their place on our winners’ podium adorned with gold, silver and bronze

HOLDING OUT FOR SOME HEROES
In recent years, the concept of dividend heroes has really taken off with qualifying investment trusts eager to hold on to their position within the AIC’s index. After all, dividend hero status is a valuable marketing tool.
At the time of writing, there are 19 investment trusts qualifying for dividend hero status, with City of London (CTY), Bankers (BNKR) and Alliance Witan (ALW) sporting 58 consecutive years of dividend hikes apiece; these three trusts started paying their shareholders higher dividends in the same year England won the World Cup, and they’ve not stopped since!
Hot on their heels is the Cayzer family-controlled Caledonia Investments (CLDN) with 57 years of consecutive payout growth to crow about, followed by The Global Smaller Companies Trust (GSCT) on 54 years, with F&C (FCIT) and Brunner (BUT) tied on 53 years apiece.

A simple re-invest the dividend strategy back into the share, using good ole hindsight it would have been better to re-invest in another high yielding Trust but for better or worse etc.,
As always timing and then timein is important.


Results analysis from Kepler Trust Intelligence
SDCL Energy Efficiency Income (SEIT) has reported its interim results to 30/09/2024, with the NAV stable at 90.6p (31/03/2024: 90.5p) and aggregate dividends of 3.16p compared to 3.12p for the same period last year. SEIT made a profit before tax of £35 million (2023 equivalent period: Loss of £89m). At the current share price, SEIT yields c. 11%. First half dividends were covered 1.1x by cash and the board reaffirmed its dividend guidance for the year ending 31/03/2025 of 6.32p (2024: 6.24p). SEIT’s portfolio valuation was £1,103m compared to £1,117m at 31/03/2023, with the main difference being the sale of UU Solar for £90m in May 2024.
SEIT’s gearing was 35% LTV, with 11% at a fund level through the trust’s revolving credit facility (RCF) and 24% at a project level. The same figures calculated as a percentage of NAV were 54%, split 17% at the trust level and 37% at a project level. The average interest rate was 5.6% and the average remaining life 4.1 years. Over 80% of debt at a project level is amortising, meaning it will naturally run off over time. SEIT’s discount at the half year end was c. 30% and is currently c. 36%. The Morningstar Renewable Energy Infrastructure peer group average was c. 20% and is currently c. 28%. The board and manager set out a plan to address the discount in the final results to 31/03/2024, the main points focusing on disposals, NAV return, capital allocation and reducing short term borrowings.
Kepler View
In the weeks before SDCL Energy Efficiency Income’s (SEIT) results announcement, the Morningstar Renewable Energy Infrastructure peer group in which it sits experienced significant discount widening, seemingly a result of the US election and investor worries about the different approach the new administration is expected to take to renewable energy. Share prices of other renewable energy companies were similarly hit. While it’s quite likely in our view that this is a sector-wide over-reaction, SEIT has some specific differences in its business model compared to the peer group.
First, the vast majority of SEIT’s revenues do not rely on any form of subsidy or incentive, and its projects are primarily rooted in their commercial attractions. Second, SEIT has very limited merchant exposure, with most of its long-term revenues contracted, and low direct exposure to power prices. SEIT is really an equity investor in platforms that provide corporate customers with efficiency solutions, so it participates not only in the contracted revenues that come from these solutions, but in the growth of the platforms themselves. Third, SEIT’s project-level debt is mostly amortising and so is repaid over a period of time, with many of its assets and investments extending well beyond the life of the debt, giving the trust different options in the future to enhance earnings. The team also point out one of the first moves made by the new US administration was the formation of a new Department of Government Efficiency, so ‘efficiency’ appears to be a positive theme in the US, which SDCL counts as its single largest country exposure at 67%.
Without getting into the flamboyant rhetoric, it is fair to say that the incoming US administration has an agenda much less focused on ‘energy transition’ and whatever the practical realities that unfold over the next few years, this is a negative for investor sentiment right now. We think SEIT’s business model, while aligned with energy transition, is relevant to customers with concerns about energy security, either more locally due to extreme weather events, or more widely due to geopolitical instability, as well as more straightforwardly simply helping customers to reduce costs. Thus, in our view, SEIT’s business model doesn’t really align with the main negatives of investor sentiment, and as the board’s plan to address the discount unfolds, the current discount could prove to be a significant opportunity.
09/12/2024
Current yield 12.5%
Current discount to NAV 46%
“Mistakes are the best teachers. One does not learn from success. It is desirable to learn vicariously from other people’s failures, but it gets much more firmly seared in when they are your own” – Mohnish Pabrai

Successful long-term investing can be very rewarding, but it is crucial to avoid common mistakes that can impair investment returns. By focusing on diversification, making rational decisions, conducting thorough research, avoiding market timing, regularly rebalancing the portfolio, refraining from overtrading, and combatting the fear of missing out, private investors can increase their chances of achieving their financial goals and maximising investment returns. Luck may grant a fleeting taste of success, but lasting wealth is forged in discipline and sound strategy.
It is important to remember that as an investor, your goal is to have Emotional Intelligence (EQ) when investing because emotions underpin your decisions and your job is to understand and manage them wisely, otherwise they could rob you of long-term investing success.
Peter Higgins

A simple plan to re-invest the earned dividends back into the share.
During 2023 you would have achieved the holy grail of investing that you could take out your stake and invest in another high yielder and have a share in your portfolio producing income at a zero, zilch nothing cost.
After you have re-invested your capital, you could carry on re-investing your dividends back into the share and try to do it all over again, or re-invest your dividends subject to the available yields in the market.


| Dividends per share paid since inception | 82.99p |
Current yield 10.2% Current discount to NAV 30%
If you re-invested the dividends elsewhere, you are still only a few years away from having all your capital returned and you will have two shares adding dividends to your Snowball.
Dividend target per share 8.90p from 8.80p
John Scott, Chair of Bluefield Solar, said:
“These results mark another period of sound operational performance. The Company has raised its dividend target, continuing our record of dividend growth since inception which is once again expected to be fully covered by cash post debt amortisation. The Company also energised two of its largest assets – Yelvertoft (48.4MW) and Mauxhall (44.5MW) – and work on the extensive and accretive development pipeline continued within the constraints of being unable to raise fresh capital.
“As I have reported previously, the discount to which the Company’s shares trade has been a clear focus of the Board, and strategic measures to add shareholder value have continued to be executed successfully during the course of the year. These measures include the completion of Phase Two of our innovative Strategic Partnership with GLIL Infrastructure in September 2024 which released c.£70 million to BSIF. The completion of the Company’s £20 million share buyback programme and the reduction of the Company’s Revolving Credit Facility (‘RCF’) to £133.5 million also represented notable milestones.
“Despite these achievements, the Company’s share price discount to net asset value, whilst being among the narrowest of our peers, has continued to widen. Given this situation, the Board has concluded that it is the right time to explore strategic initiatives and options including reviewing fee arrangements, to address the share price discount and to continue to seek to maximise value for our shareholders.
The Board is committed to reviewing all options available to the Company and we will look to update shareholders on progress as appropriate.
Dividend Target per Share
8.90pps 8.80pps(actual)
“Don’t believe the hype” – Public Enemy

Fear of missing out (FOMO) is possibly one of our longest and most enduring failings; those religious amongst us would say it goes all the way back to Adam and Eve in the Garden of Eden and that juicy apple.
Fear of missing out (FOMO) is a common emotional investing mistake that can lead to impulsive decisions and poor risk management when investors chase fabulous, exciting, new, shiny and well-marketed ideas. Investors are surrounded by social media, bulletin boards, chatrooms, blogs, podcasts and investing channels on YouTube, and the frequency and level of information disseminated with regards to a single stock, fund, investment company or asset class at any one time can make it extremely overwhelming, for the inexperienced and even the experienced investor.
The confidence of a well-spoken, articulate, well-written and well-meaning individual about e.g. stock X, can lead to private investors being drawn into something which may not be for them and may not be as great, in reality. We can sometimes, make the mistake, through our ‘fear of missing out’ on committing to a ‘surefire, fast-rising, winning, opportunity’, irrespective of where stock X is in its growth journey, revenue generation or even fundraising* activity.
Daniel Kahneman sums this beautifully when he states, “Wherever there is prediction, there is ignorance, and probably more of it than we think.” If we are all thinking alike, then how many of us are actually thinking about the challenges, the risks and the issues? This is not to say that all marketing and sales persuasion is unhelpful, but what it does mean is that you should conduct your own due diligence to make sure that you know what you are buying and what you may realistically gain in return.
*Fundraising activity – means that the marketing and sales persuasion is elevated to gain interest and to increase the return for those who already hold or are looking to sell into the momentum of a rising stock. This often happens with AIM penny shares and private investors can experience a hugely discounted placing after an initial purchase. This can also happen with established, profitable, and even larger market-capitalised companies.
Ultimately, controlling FOMO is about maintaining and improving one’s own strict research strategy and being open to continual learning. Not falling for the next hype stock or asset class. Not believing the investment performance hype of your favoured anonymous Fintwit avatar individual whose proof of buys or sells you have absolutely no clue about. Instead of falling for FOMO, please take the time to analyse, research and evaluate each investing opportunity thoroughly and independently of the hype or noise of any individual or the crowd. There are no investment gurus and all that glitters is not gold! Or as Benjamin Graham famously said, “If everyone is thinking alike, then no one is thinking”.
VPC Specialty Lending Investments PLC
(the “Company”)
DIVIDEND DECLARATION
The Board of Directors of the Company has declared an interim dividend of 1.06 pence per share for the three-month period to 31 December 2024. The dividend will be paid on 3 April 2025 to shareholders on the register as at 7 March 2025. The ex-dividend date is 6 March 2025. The 1.06 pence per share dividend represents the net revenue return earned by the Company for the three-month period to 31 December 2024.
Doceo Fund Monitor
Achilles (AIC) does what no other fund in London has managed to do in recent years – raise over £50m as part of an initial public offering; Foresight Solar (FSFL) joins the growing ranks of funds adopting more shareholder-friendly management fee structures and is also exploring all options in terms of its future strategy; while Assura (AGR) turns down a 48p per share cash offer from KKR.

By Frank Buhagiar

Achilles (AIC) has done what others have failed to do in recent years – raised over £50m as part of an initial public offering (IPO) in London’s investment company space. As per the press release o21 February 2025, the fund will invest in a “concentrated portfolio of closed-ended investment companies, admitted to trading on a market of the London Stock Exchange, with a focus on alternative assets (being assets other than publicly quoted equities) and to seek to maximise value for Shareholders through constructive activism.” The fund’s managers, Christopher Mills and Robert Naylor have form when it comes to getting the maximum value out of alternative assets – both played key roles in the successful sales of music royalty investors Roundhill Music and Hipgnosis. Investors clearly thinking the pair can repeat the trick elsewhere in the alternatives sector.
Liberum: “There does tend to be less activist involvement in Alternatives. Compared to equity funds, shares are far more widely held by institutions and wealth managers. While AIC’s ticket sizes may not be particularly large, it is likely that it will have the support/backing of some of the largest owners of Alternative funds and will therefore be able to represent the views of a large portion of registers in the funds it targets. We think the more good outcomes that can be delivered, the more chances there are for good strategies caught in the crossfires to come back into favour and the more likely it is for the sector to successfully introduce a wider pool of buyers.” Achilles to the rescue!
Foresight Solar (FSFL) joins the growing ranks of funds adopting more shareholder-friendly management fee structures. “The Board and the Investment Manager are acutely aware of the growing preference from investors for management fee structures to more closely reflect the share price performance experienced by shareholders.” Two “significant improvements” have been made. Under the new arrangements, rather than being wholly applied to net asset value (NAV), the new management fee will be applied to an equal weighting of (i) the average of the closing daily market capitalisation during each quarter and (ii) the published NAV for the quarter.
There’s also been a change to the fee rate charged. Previously, the Investment Manager received an annual management fee calculated at the rate of 1% p.a. of NAV up to £500m and 0.9% p.a. of NAV greater than £500m. From 1 March 2025, new fee rates of 0.95% up to £500m and 0.8% over £500m will be applied. As for what this means in terms of savings, the company helpfully provides an example. Using the 17 February 2025 77.7p share price, £436.3m market capitalisation and 31 December 2024 NAV of £634.4m, the changes would generate an annualised saving of c.£1.2m (19%).
Further changes could be afoot too. That’s because the Board has been talking with shareholders who “have expressed a range of views to the Board. While some have expressed a desire for liquidity, others are seeking ongoing exposure to the listed renewables sector through a vehicle with greater secondary market liquidity and scale to drive efficiencies. The Board’s role is to balance these objectives and deliver value to Shareholders in an efficient and effective manner by exploring all options available.” So, watch this space.
Jefferies: “the fee reduction and the fact that the board is ‘exploring all options available’ in terms of the future strategy of the fund should be welcomed by shareholders, with the hope that a more specific path forward is outlined ahead of this year’s discontinuation vote.”
Healthcare property co. Assura (AGR) put out a press release in response to an announcement from KKR “relating to the indicative, non-binding proposal that it submitted to the Assura Board on 13 February 2025 regarding a possible cash offer for the entire issued share capital of the Company.” The AGR Board however deemed the 48p per share offer “materially undervalued the Company and its prospects and therefore rejected it unanimously.” Ball back in KKR’s court.
Numis: “KKR confirmed that it has to-date made four indicative non-binding proposals to the Board. The latest proposal reflects a 28% premium to Thursday’s closing price, a 27% premium to the three-month volume weighted price, and a 2.8% discount to the September 2024 NTA.”
© 2026 Passive Income Live
Theme by Anders Noren — Up ↑