Here’s how £20k of savings could one day generate £841 of monthly passive income
A passive income plan built around investing in dividend shares could be a simple but potentially lucrative way to earn money without working for it.
Posted by Christopher Ruane
Published 5 July
Image source: Getty Images
When investing, your capital is at risk. The value of your investments can go down as well as up and you may get back less than you put in.
You’re reading a free article with opinions that may differ from The Motley Fool’s Premium Investing Services. Become a Motley Fool member today to get instant access to our top analyst recommendations, in-depth research, investing resources, and more.
One popular way to earn passive income is investing in shares that pay dividends. It is an approach that can be tailored to someone’s individual financial circumstances.
It can also be pretty lucrative, especially if that someone has patience to wait and adopt a long-term approach to investing.
As an illustration, here is how they could target a monthly average passive income of £841 from an initial investment of £20k.
That compounding could involve both capital gain and any dividends paid. Share prices can fall though, and that also would affect the overall performance, so the final figure is by no means guaranteed.
As for a 9% yield 20 years down the line, based on today’s market there are some quality shares yielding that much – but careful selection is important. Some shares have high yields because investors doubt that the dividend can be sustained.
Finding shares to buy
What sort of shares do I have in mind here? As an example, one I think investors should consider is FTSE 100 asset manager M&G (LSE: MNG).
For some years, it has had a policy of aiming to maintain or grow its dividend annually. It has recently simplified that to a policy of targeting annual increases in the dividend per share. I see that as a vote of confidence by the company’s board.
That is likely music to shareholders’ ears, especially as M&G already yields an impressive 7.8%. That is over double the FTSE 100 average.
The company has a number of strengths, including a large customer base, strong brand and long experience in asset management.
A recent tie-up with a Japanese financial services firm could help bring in more funds to manage. I see that as positive, because one of the risks that has been concerning me about M&G shares is that policyholders have been withdrawing more funds than they put in. That is a risk to profits.
Getting started
All shares have risks, of course. One simple way smart investors aim to mitigate them is to diversify across different shares. Twenty grand is ample to do that.
It is also important to choose high-quality shares trading at attractive prices. It can be hard to know whether shares really fit that bill. Like billionaire investor Warren Buffett, I therefore stick to businesses I feel confident I can understand.
It is all very well having a passive income plan – but how can someone turn it into reality? A useful first step, in my view, is to set up a way to put the £20k to work in the market. Actually, it is possible to start with less, but the passive income streams would be proportionately smaller.
To do that, an investor could compare some different options for a share-dealing account, Stocks and Shares ISA or share trading app.
Do you like the idea of dividend income?
The prospect of investing in a company just once, then sitting back and watching as it potentially pays a dividend out over and over?
If you’re excited by the thought of regular passive income payments, as well as the potential for significant growth on your initial investment…
This 14% Dividend Tells Us One Thing: The Smart Money Is BUYING America
Contrarian Outlook
Michael Foster, Investment Strategist Updated: July 3, 2025
Well, that didn’t last long.
A few months ago, all we heard from the mainstream media is that the “sell America” trend was going to stick around for a long time.
Nowadays, we’re still hearing that. But one corner of the market—closed-end funds (CEFs)—is telling us something interesting: That investors are starting to turn their attention back to the US.
That’s given us an opportunity to front-run this quiet shift now, while it’s still early, with some high-yield CEFs trading at attractive discounts. In a second, I’ll walk you through the signal we’re getting from two of the biggest US-focused CEFs—one holding stocks, the other corporate bonds.
First, though, let’s talk about what the real data says about one of the biggest fears that’s been driving the so-called “sell America” theme—US debt.
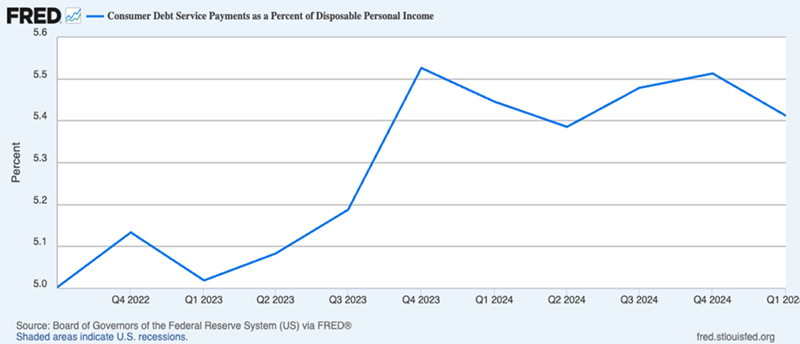
This chart shows how much US households pay to manage their debt, as a percentage of disposable income. It’s the main evidence supporting the argument that fears about US economic stability are warranted.
To be fair, this chart does show a jump—about 10% in the last three years. In other words, yes, Americans’ debt costs are higher than they were in 2022. That’s a sure sign the US consumer is tapped out, right?
If this all sounds familiar, it’s because it’s the same story the press pushed in 2022, with headlines like “Consumer Debt Surges at Fastest Pace in 15 Years.” Three years later, the US economy remains strong. So maybe it’s going to finally falter now?
That’s what the Wall Street Journal has been saying. In March, it published a story titled, “Consumers Keep Bailing Out the Economy. Now They Might Be Maxed Out,” and another headlined: “Recession Fears Stoke Concerns Americans Are Overstretched.”
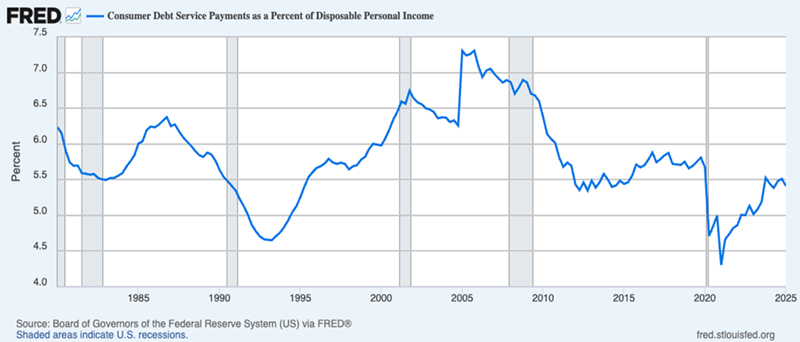
Now let’s look at a chart that starts to dispel this fear and tell us the real story here.
Household debt payments definitely rose from their all-time low in 2021. Now they’ve leveled off at around 5.5% of disposable income. That’s about where they were in the early 2010s. Today’s level is also far below the average in the 1980s, 1990s and 2000s.
In other words, Americans are not maxed out. In fact, their household-debt levels are quite low. According to IMF data, US households are less indebted than those in much of Europe and Asia, as well as Australia and Canada, both of which are places thought to be fiscally responsible.
At current levels of American disposable income (which is among the highest in the world) and debt levels (one of the lowest), the average US household is paying about $282 per month on its debt. That’s hardly a lot of money for most people!
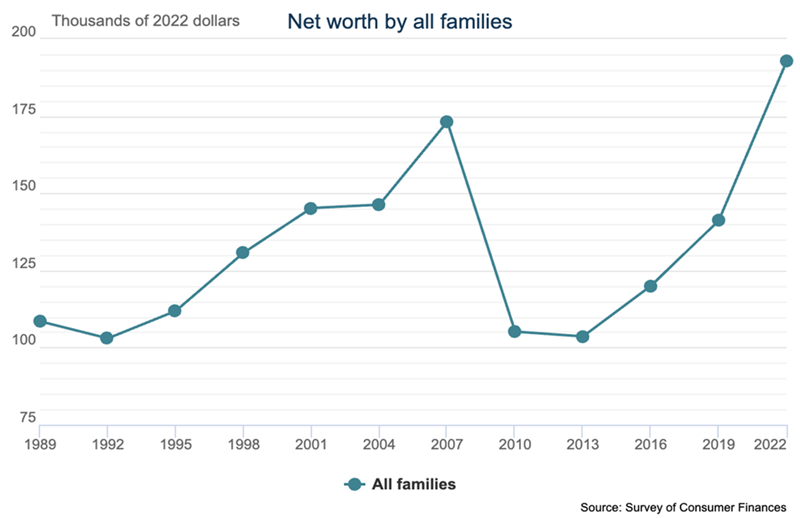
It’s also worth pointing out that the average American family’s net worth had risen to $192,700 by 2022 (when the Federal Reserve did its latest survey), fully recovering from the Great Recession:
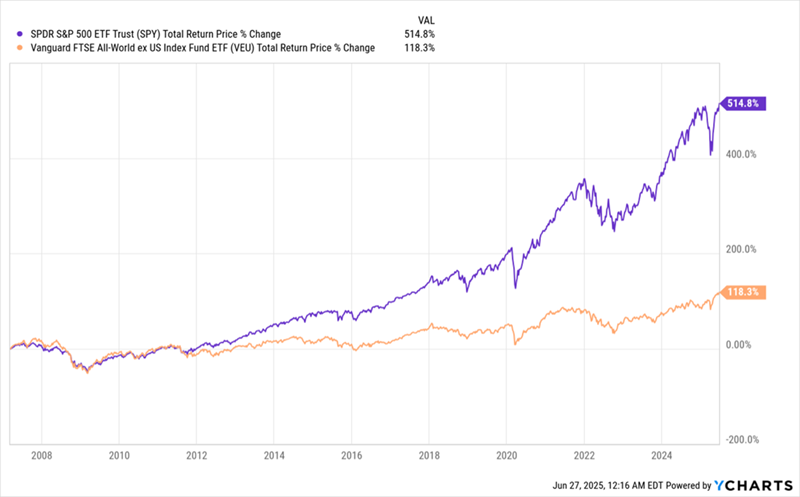
There’s a direct line between this financial improvement and the S&P 500’s world-beating long-term performance:
US Stocks Take On All Comers—and Win
Which brings me back to that indication CEFs are giving us that investors may finally be catching on to the strength of the US consumer.
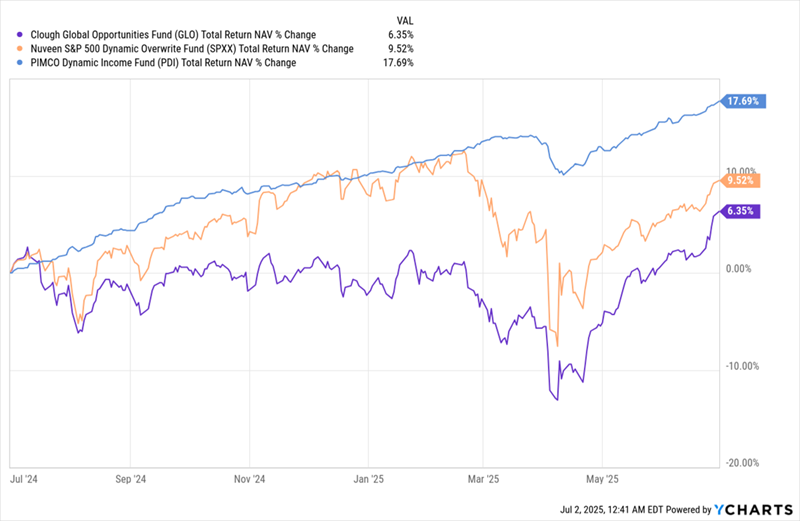
To get at that, let’s look at a major corporate-bond CEF, the PIMCO Dynamic Income Fund (PDI), and the Nuveen S&P 500 Dynamic Overwrite Fund (SPXX). As SPXX’s name says, it holds the S&P 500, but it also sells call options—a low-risk way to support its dividend.
In a June 9 article on our Contrarian Outlook website, we talked about how SPXX and PDI work together to give an investor a nicely diversified “mini-portfolio” of stocks and bonds. We also identified an international fund, the Clough Global Opportunities Fund (GLO), as a less-effective way to diversify.
With CEFs, we have two measures of performance: total return based on net asset value (NAV, or the value of a fund’s underlying portfolio) and total return based on market price.
These can be different, with NAV a better measure of the fund’s portfolio management and market price a measure of the fund’s overall performance, subject to investor whim. When we look at the total NAV returns of the US-focused funds in the past year (SPXX, in orange below, and PDI, in blue), we see that they exceed that of the more global fund, GLO (in purple), by a fair margin:
US Stock, Bond Funds’ Portfolios Top Their Global Rival …
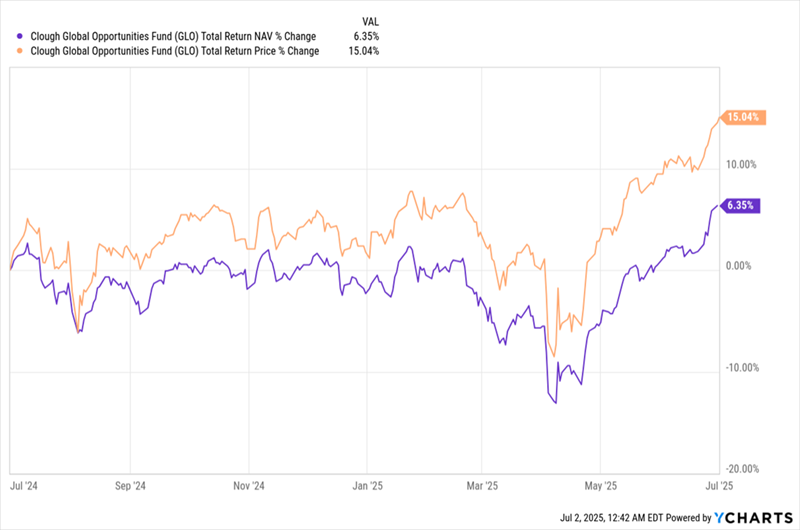
But if we pivot away from NAV for a moment and look at GLO’s total price return, we see that the global fund, GLO, has a far better performance, returning 15% (in orange below), far higher than the 6.4% return on its NAV (in purple) and indeed ahead of SPXX.
Here’s what’s really happening: Market demand for this fund is outpacing the fundamentals by a lot. That’s causing GLO’s discount to NAV to narrow (it’s now 11.7%).
Over time, investors will likely realize that fundamentals are underperforming market demand here and that, when compared to SPXX’s 7.6% yield and PDI’s 14% payout, both funds are better contenders than GLO to deliver strong total returns alongside a rotation back into America.
And that means there’s still time to profit from these two funds and avoid the growing possibility of underperforming by holding GLO, as that fund’s market-price gains run ahead of its fundamentals, potentially setting it up for a fall.
In short, the “pivot back to America” trade is wide open in CEF-land, where big (and often monthly paid) dividends are also on the table—if you stick to the data and ignore media fearmongering.
SPXX and PDI are both well-known, smartly run CEFs. You may actually hold one or both now.
If you do, great! You’re already enjoying strong payouts and are nicely positioned for gains as “sell America” fizzles.
CPMG which own Trusts the manager considers have the best growth potential.
CPMI which own Trusts the manager considers have the best income/growth potential.
Let’s research CPMI which currently yields 6.5%
Fourth Interim Dividend for the financial year ended 31 May 2025
CT Global Managed Portfolio Trust PLC (‘the Company’) announces a fourth interim dividend in respect of the financial year ended 31 May 2025 of 2.05 pence per Income share.
This dividend is payable on 11 July 2025 to shareholders on the register on 13 June 2025, with an ex-dividend date of 12 June 2025.
The normal pattern for the Company is to pay four quarterly interim dividends per financial year.
For the full financial year ended 31 May 2025, total dividends have increased by 2.7% to 7.6 pence per Income share (financial year ended 31 May 2024: 7.40 pence per Income share).
Financial year to 31 May 2026
In the absence of unforeseen circumstances, it is the Board’s current intention to pay four quarterly interim dividends each of at least 1.9 pence per Income share and that the aggregate dividends for the financial year to 31 May 2026 will be at least 7.6 pence per Income share (2025: 7.6 pence per Income share).
Whilst it’s difficult to make a capital gain but not impossible, a steady income producer to provide funds to re-invest into your snowball, as you build up your knowledge of the portfolio shares held within the Trust.
If you are able to buy just before the next xd date, you could receive 5 dividends in a little over a year yielding around 8%, one of the safest dividends in the Investment Trust Universe.
A equal weighted Investment Trust portfolio of higher risk and lower risk shares.
The blended yield is 8.9%, maybe for those that are closer to their retirement date, who have less time to recover from buying a clunker, although that is still a possibility.
This is definitely
But it is definitely a tale of the tail and not the dog.
Everything crossed for a market crash were you could get a better yield.
Debt funds finally have their day in the sun – how to invest
Story by Rupert Hargreaves
In the world of bonds and fixed income, US billionaire Howard Marks is a titan. After making a name for himself at Citicorp in the 1970s and then TCW Group in the 1980s trading distressed bonds, he founded Oaktree Capital Management in 1995, focusing on high-yield debt, distressed debt and private equity. Today, Oaktree manages about $200 billion in assets for its clients across distressed-debt and private-equity funds. Over the years, Marks, one of the most successful debt investors of all time, has become famous for his so-called investment “memos”. These are emailed to clients and posted online, and contain his thoughts on everything from the state of the markets to the economy and even family life.
With 55 years of experience behind him, Marks has witnessed multiple investment markets and cycles, including crashes, inflation peaks, interest-rate cycles and booms. His memos have become particularly poignant in the last few years as he is one of the handful of remaining fund managers who experienced the rate-hiking and inflationary periods of the 1970s and 1980s.
Debt trumps equity
When discussing investments, equities often take centre stage, but global debt markets are far larger, more diverse and more significant to the global economy. According to the Institute of International Finance (IIF), global debt reached a record high of more than $324 trillion in the first quarter of 2025 – that’s around three times the size of the entire market capitalisation of all global equity markets.
Howard Marks and Oaktree have carved out a niche in the distressed-debt section of the market. When a bond or a loan is first issued, it’s issued at what is known as “par”. This is generally a round number such as £1,000 or £100,000. This is both the issue price and the redemption price. Bonds are issued at a round number and then repaid at the same number. Prices are then quoted in pennies or cents and this gives an indication of what the market thinks about the instrument. For example, if a bond is trading at 97p on the £1, it indicates that the market believes it will be repaid in full. However, if the value of the bond slumps to, say, $0.30 on the $1, that’s a strong indication the market believes the bond won’t be repaid in full. Bonds trading at a significant discount to their issue price are generally described as being distressed. Transactions can be conducted at any point between the parties that own the bonds, even the company itself. Oaktree, for example, may come in and buy a bond at $0.10 on the $1. As a distressed-debt investor, it buys in the hope it will be able to generate some sort of profit either in a bankruptcy situation, or if the business makes a strong recovery.
A rough guide to bonds
Bonds have a stronger claim on a company’s assets than equity does. The most senior debt type is generally the senior secured first-lien, then there’s the secured second-lien loan, senior unsecured debt, senior subordinated, subordinated and junior subordinated. Other types of debt may exist below these senior debts, but in the worst-case scenario, these are the ones that are going to be paid first. Senior secured debt is both higher in the capital structure and secured against an asset, so if a company should fail, the security of that asset, such as a large warehouse, can be used to pay off the bond. Oaktree may come in and acquire a senior secured bond at pennies on the dollar from another debt holder and then pursue the company through the courts to reclaim the asset and potentially achieve a return of multiple times its initial investment.
That’s a rough guide to the trading value of bonds and the seniority of capital structures. The other core component of a bond or loan is the interest rate paid to investors. In many respects, the interest rate on a bond or loan tells investors more about the quality of the debt than the price. Pricing the interest rate on debt is somewhat of a fine art and will often depend on the quality of the debt, the level of debt in the capital structure and the position of the borrower, whether the debt is secured or not, and the duration of the debt as well as the firm’s credit rating.
A credit-rating agency such as Standard & Poor’s, Moody’s and Fitch Ratings are usually paid to assess the risk of every credit instrument and give a rating of credit quality. AAA is generally the highest (each agency has a slightly different system); C or D are the lowest ratings. The credit rating will affect the bond’s price and the interest-rate spread. The spread relates to the interest rate offered on the debt compared with a fixed benchmark, often referred to as the “risk-free rate”, such as the Bank of England base rate, or, more commonly, a US treasury of the same duration (the number of years outstanding: a ten-year Treasury vs a ten-year bond, for example). The wider the spread, the more risky the debt instrument is perceived to be.
Interest rates are set when the bond is issued, but prices and rates move inversely as the bond trades. If the price of the bond falls, the interest rate, which is set based on the issue price, will rise. For example, a £100 bond with a 5% yield will pay out £5 in interest a year. That won’t change, but the price could fall to £80 (80p on the £1). The £5 annual interest remains unchanged, which means investors purchasing at the lower price are buying with a yield of 6.3%. The same happens if the price of the bond rises above par, although in that case, the yield will decline.
Interest rates themselves can be fixed or variable. A fixed interest rate, often referred to as a “fixed coupon rate”, means that the bond issues a constant, predetermined interest payment (coupon) at regular intervals (semi-annually, for example) throughout its entire life, from issuance until maturity. A floating interest-rate bond, or “floater”, is a debt instrument whose coupon payments are not fixed, but rather adjust periodically (quarterly or semi-annually, for example) based on a benchmark interest rate plus a specified spread. Common benchmarks include the Secured Overnight Financing Rate (SOFR) or the Euro Interbank Offered Rate (EURIBOR).
Understanding the key risks
This, in a nutshell, is how bonds, loans and credit instruments work. When trying to understand the risk associated with any particular credit investment, investors only need to be concerned with two metrics: duration risk and credit risk. Credit risk, also known as default risk, represents the likelihood of the issuer making timely interest payments and repaying the principal amount at maturity. It’s the risk that the bond issuer will fail to meet its financial obligations. Duration risk is a measure of a bond’s price sensitivity to changes in interest rates. The longer a bond’s duration, the more sensitive its price will be to interest-rate fluctuations.
Austria’s 100-year bond, which launched at the peak of the zero-interest rate era, is the best example of duration risk. The bond was issued at par with a yield of 0.9%, with a modified duration of 40%. That means that for a 100bps increase or decrease in yield, the bond price moves by 40%. As interest rates have surged, the value of the bond has fallen by nearly 70%. Investors who are able to hold until maturity in 100 years’ time will still see redemption at par, but anyone selling today will have to stomach a 70% loss of principal (the yield has risen to 2.6%). Short-term bonds and those credit instruments with floating interest rates have the lowest duration risks. Long-term fixed-rate products have the highest duration risk.
Despite the size of the credit and debt markets, these areas are usually out of reach of individual investors. Wholesale bonds, typically traded by institutional investors, often have minimum denominations of £100,000, and most brokers won’t even bother dealing with trades below several million pounds in size. The more esoteric debt instruments, where the best returns and opportunities can be found, aren’t usually publicly traded. However, there’s a range of investment trusts that specialise in just this area, and right now investors can build a portfolio of credit with a near double-digit yield and reduced down-side risk compared with an equity portfolio.
The investment trusts to buy now
Investment trusts are perfectly suited to holding different types of debt, especially in situations where there isn’t a liquid market. There are 24 listed debt and lending trusts and, of these, nine have less than £100 million in assets under management and don’t really have the scale needed to compete effectively. GCP Infrastructure Investments (LSE: GCP), Sequoia Economic Infrastructure (LSE: SEQI) and BioPharma Credit (LSE: BPCR)are the largest.
GCP and Sequoia both specialise in lending to infrastructure projects. Sequoia, the largest of the two, has an average investment of £23.7 million with a weighted average maturity of 3.5 years. Just under two-thirds of the debt is senior and secured against an asset, with 41% on floating interest rates. The floating-rate nature of the portfolio, coupled with the relatively short duration of assets, means duration risk is relatively low. It’s an active trader of assets when opportunities emerge. For example, it recently acquired the bonds of Navigator Holdings, a market-leading owner and operator of liquefied gas carriers, owning 56 vessels, at 7.25% – 10/2029 bonds for $8.0 million. That’s a small holding for the portfolio, but it’s an attractive debt play that’s not available to the average investor.
Sequoia’s portfolio has a much shorter duration compared with GCP, with the average life of GCP’s investments standing at 11 years. With the shorter lifespans in the portfolio, Sequoia has been able to recycle its assets into higher-yield investments to take advantage of the changing interest-rate environment and, on a purely net-asset-value basis, Sequoia does offer the higher yield. At the end of May Sequoia’s net asset value (NAV) stood at just under 92p per share, suggesting the shares are currently trading at a discount of 14%. The yield is just under 9%. GCP’s last-reported NAV is around 102p, but it’s trading down at 74p, a discount of nearly 30%. This is a reflection of the long-duration of the assets. With a target annual dividend of 7p, the stock yields around 9.5%.
BioPharma Credit is managed by Pharmakon Advisors, LP, a specialist $10 billion biotechnology investor that’s been around since 2009. BioPharma lends money to small and mid-sized companies in the life-sciences sector. As Pedro Gonzalez de Cosio, co-founder and chief executive officer of Pharmakon Advisors, said earlier this year, this is a niche but lucrative market if you get it right. These businesses have “a monopoly in treating a certain disease in a certain way… but most of these companies are at a stage where they are probably still investing more in launching the product… So they have these assets worth a lot of money, but they’re still burning cash”.
At the end of January, just over 60% of the portfolio was allocated to just three senior loans (to three separate companies). However, as Pedro argued, the portfolio shouldn’t be viewed in isolation. “I can guarantee you that [by] investing in us [you] diversify your portfolio because there is no other way that you can get access to these assets.” The bulk (76%) of the portfolio is floating rate, to be repaid within two years at interest rates of between 8% and 12%. And companies generally commit to additional payments if the bonds are repaid earlier than scheduled. That’s helped the trust pay around 50% more in special dividends than was initially projected at its initial public offering. At the end of May the trust was trading at a discount to net asset value of 12.8% and offered a dividend yield of 11.6%.
There are two debt trusts managed by TwentyFour Asset Management, a boutique manager of the Swiss-based Vontobel Group. The Swiss group manages £18.1 billion in total, of which Twenty Four Income (LSE: TFIF) accounts for about £850 million and TwentyFour Select Monthly Income (LSE: SMIF)makes up £250 million. The larger trust is a rarity among UK investment trusts in that it currently trades at a premium, and it’s been issuing new stock to take advantage of strong demand for the shares. A total of 42% of its portfolio is in residential mortgage-backed securities (RMBS) and the rest of the portfolio is a mix of other securities, such as student loans and commercial mortgage-backed securities (CMBS). These assets, which are a bit further up the risk curve than the senior and secured loans typically held by other trusts, offer more in the way of yield. At the end of May, the average yield of the portfolio was close to 12%. Over the past year, the company has paid a dividend yield of 11p per share, boosted by higher interest rates as its portfolio has rolled over, a dividend yield of around 10% on the current share price.
CVC Income & Growth (LSE: CVCG) is part of the private-equity giant CVC Group. Overall, the CVC Group has €200 billion of assets under management and buys high-yielding sub-investmentgrade loans in the direct lending market. Like TwentyFour, this market can be perceived to be a bit riskier than other loan and debt markets, but CVC is very careful about where it puts its investors’ money. “We attach at a 50% loan-to-value [ratio],”
Mitchell Glynn, the assistant portfolio manager, said and “80% is secured…we are a secured investor,” he adds. As a result, “there’s a big equity cushion below us, so there’s protection if something goes wrong”. Often, CVC is lending money to companies that have been shut out of other markets, which means the fund can charge 12%-13% or more to borrowers. If it’s able to buy debt on the open market at a discount, returns are even higher.
That’s happening a lot right now as highly leveraged firms are struggling in the higher-rate environment. There’s an “abundance of opportunities”, but there’s also an “abundance of toxic opportunities”, says Glynn. The fund is also trading at a premium and has been raising money to take advantage of the increased demand for its shares. The company is guiding for 9.25p per share in dividends over the coming year, giving a dividend yield of 7.8%, although it’s likely to top this up with special dividends. However, this isn’t just an income play – over the past five years, CVC’s debt-trading strategy has helped it generate both income and capital growth. The trust has generated an annualised total return of 16.7% over the past five years, with a total return of 29.2% last year for the sterling shares and 18.1% in 2023.
AI generated image, doesn’t yet understand the game of cricket.