I like a good investment trust, and some of the real estate variety (REITs) seem especially good value to me. Possibly my top pick, Primary Health Properties (LSE: PHP), looks even better after first-half results on 24 July.
It puts the shares on a 10% discount to NAV. And in this case, I don’t think that’s the best way to value the stock anyway.
Please note that tax treatment depends on the individual circumstances of each client and may be subject to change in future. The content in this article is provided for information purposes only. It is not intended to be, neither does it constitute, any form of tax advice.
Rising income
Primary Health invests in healthcare facilities. And it rents them out on long-term leases, with the NHS one of its key clients. If the rents keep coming in at a steady pace, why would anyone really care about the value of the buildings? I don’t.
For those who do care about the underlying property market, CEO Mark Davies had some welcome words. He said: “The improving rental growth outlook and a stabilisation of our property yields at 5.25% signal that we’ve moved through a key inflexion point in the property cycle.”
The CEO also spoke of the new government ’10-year Health Plan.’ He said: “We welcome the government’s commitment to strengthening the NHS, particularly its emphasis on shifting more services to modern primary care facilities embedded in local communities. This plays directly to our strengths and our long-standing partnerships across the NHS.“
Merger
One key thing is overshadowing quarter-by-quarter earnings right now. It’s the planned acquisition of fellow healthcare REIT Assura. The deal, valued at £1.79bn, was recommended by the Assura board. And at the Primary Health AGM on 1 July, over 99% of shareholder voted to approve.
It throws a pretty big unknown into the ring. Forecasts for the two independent companies are scrap paper now. And the latest report talks of potential third-party joint ventures.
I suspect that’s partly why the Primary Health share price has been slipping since the AGM resolution, while Assura is up 31% year to date.
It can take some time for a merger like this to shake out. And for us to get a clear picture of the combined entity and its potential valuation. I do think investors buying now could risk share price falls in the short-ish term.
Very tempting
I don’t know what the forward valuation and dividend prospects are going to look like. But what I do know is that both REITs were already among my favourites. I reckon those who share my thought that two should be better than one might want to consider it.
If you start work and saving for retirement at 22, your pension pot by the time you reach 68 be approximately £210,000. However, if you delay this by just five years and only start saving at 27, you’ll be £40,000 worse off with just £170,000 at 68.
This is according to a new report by Standard Life, as seen by Money Week. And the calculations just get worse the more you put off saving for retirement.
If young workers only start saving into a workplace pension at 32, they’ll be looking at around £136,000 by the time they’re likely to qualify for a state pension.
Delaying saving by 15 years will make them £103,000 worse off than someone who started saving at 22, proving that each moment counts when it comes to pension funds.
These figures are based on an person starting employment with a £25,000 starting salary at 22 and receiving a yearly pay increase of 3.5%. The experts also factor in a 5% personal pension contribution and a 3% employer contribution to a scheme yielding a 5% investment return.
Rapid rises in interest rates from historically low levels have added to borrowing costs for everyone – and investment trusts are no exception.
The cost of borrowing is relevant to this type of fund because one of the unique features of the investment trust structure is the ability to use gearing – to borrow money to invest alongside shareholders’ capital.
Some trusts use gearing to boost capital returns, while others deploy it to augment income. Gearing amplifies returns on both the upside and the downside but over time it tends to play to investors’ favour. It is one of the oft-touted reasons for the long-term outperformance of investment trusts over sister open-ended funds.
Let’s take a quick look at how gearing works in practice before exploring which trusts have been fortunate enough to lock in low-cost borrowing before interest rates started to rise.
Gearing explained
Investment trust boards set the maximum level of gearing. The investment manager determines how much of this to deploy at any given time, often in consultation with the board.
Some trusts run a certain level of structural gearing, while others tend to use it tactically – depending on how good they perceive the investment opportunity to be. Crucially, this must be weighed up against the cost of debt.
To have certainty over the cost of borrowing, many trusts at least partially fund their gearing through long-term, fixed rate loans – and did so with gusto when interest rates were at rock bottom. From the start of 2016 to mid-2021, a period characterised by historically low interest rates, boards locked in £4.1 billion of low-cost debt fixed for at least two years, according to data from the Association of Investment Companies (AIC).
Since the end of 2021, the Bank of England base rate has risen from 0.1% to 5.25% and is chief among the reasons for investment trust discounts moving to their widest level since the depths of the financial crisis in 2008.
Discount widening has most severely affected trusts investing in less-liquid asset classes, such as property, infrastructure and private equity, as investors fret over the hidden cost of higher interest rates on private companies and the prospect of write-downs in the value of underlying assets. That means caution is particularly required when bargain-hunting in the illiquid market.
James Wallace, an infrastructure and renewables research analyst at Winterflood Securities, notes: “The impact of rising interest rates on financing costs has been an important area of focus for investment trusts with significant gearing, predominantly those investing in alternative asset classes.
“When assessing which funds are best positioned, not only is it important to identify those with low interest costs but it is also key to understand the portion of debt that is fixed or hedged, the payback profile and the relevant maturities to assess refinancing risk.”
We asked advisers and analysts for their top low-cost-debt picks that should be in a strong position when investor sentiment improves.
1) Edinburgh Investment Trust
UK equity income trusts often deploy gearing to help maintain their strong track records of growing dividends paid to shareholders. Many have gross gearing around the 10% mark but their net gearing is generally less at present.
“looks to be in the best place going forward”, according to David Liddell, a director at IpsoFacto Investor.
It had a debenture costing 7.75% per annum, which matured in September 2022. However, a year prior to its maturity, the management team locked in replacement debt at a much lower rate of 2.44%, maturing in tranches between 2037 and 2057 – highly attractive relative to current market rates.
Although stock selection was the key driver of returns in the six months to 30 September, the revaluation of the company’s debt continued to enhance returns, adding around 1% to net asset value (NAV).
At the end of October, Edinburgh Investment Trust had net gearing of 5.2%.
has the longest track record of dividend increases of any investment trust at 57 years. It is a member of interactive investor’s
The trust has £80 million of low-cost debt of between 23 and 26-year maturity with a fixed rate of interest of 2.8% on a weighted average basis. Overall, it has £115 million of long-term structural gearing in place, as well as a more flexible overdraft facility of up to £120 million available to be deployed tactically.
“With short-term gearing relatively expensive currently, not to mention the uncertain outlook for markets, manager Job Curtis hasn’t employed any of the flexible overdraft,” says William Heathcoat Amory, a partner at Kepler Trust Intelligence.
He added: “That said, he views the long-term, fixed-rate borrowings that the board judiciously took out when interest rates were significantly lower as a big competitive advantage both in terms of generating yield and capital growth.”
The trust had net gearing of 6% at the end of October.
3) Mercantile Investment Trust
Kepler Trust Intelligence highlights the “very strong” balance sheet boasted by the UK mid-cap trust Mercantile Ord
thanks to the board securing long-term structural gearing at a “highly competitive” rate.
In September 2021, the board refinanced the trust’s ultra long-term debt, securing a total of £150 million at a blended rate of 1.9%. This consists of three tranches of senior notes including a £55 million note paying 1.98% maturing in 2041, a £50 million note paying 2.05% maturing in 2051 and a £45 million note paying 1.77% maturing in 2061. The notes run alongside a £175 million debenture at 6.125% expiring in 2030.
“These have secured the long-term funding requirements for the trust at a rate we believe can offer significant support to long-term returns,” says investment trust research analyst Ryan Lightfoot-Aminoff, also of Kepler Trust Intelligence.
The trust was geared to the tune of 13.4% on 31 October.
is committed to using long-term structural gearing to enhance long-term returns. Manager Paul Niven has the ultimate responsibility for determining the trust’s level and the timing of gearing.
During 2021 and the first half of 2022, the board took advantage of historically low interest rates to extend the maturity of its fixed rate debt with varying maturity dates between 2037 and 2061 to take total borrowings to £581.8 million at a blended rate of 2.4% – a significant reduction from 7.1% at the end of 2013.
At the end of October, the trust’s net gearing was 5%. “This level is at the lower end of a five-year range, which has averaged 7.5%, and combined with the higher levels of liquidity reflects Paul’s more cautious outlook,” says Kepler analyst Nicholas Todd.
“However, this gives Niven the flexibility to take advantage of the cheap debt whenever he sees an opportunity to do so and a lower hurdle rate for returns on investments to ensure it remains accretive to performance over the long term.”
and in particular the reduction in its short-term floating rate debt. It has been the most active among peers with regard to disposals and made £324 million of divestments in the six months to 30 September, all above their respective March 2023 valuations.
The trust had net debt of £496.8 million at the end of the period. On completion of the disposals, its £650 million revolving credit facility is expected to be around £115 million drawn, down from £494 million at its peak in April.
Fund-level gearing will comprise of these drawings, around £87 million in letters of credit and £150 million in loan notes. Net of cash, this will represent just over 10% of NAV. To protect against further interest rate rises, in July the trust bought an option to cap £200 million of its exposure to SONIA (the average rate at which financial institutions lend to each other overnight) to 6.5% for three years.
“We continue to believe that HICL has an important role to play in diversifying income streams and portfolio returns and reiterate our buy recommendation,” says Investec analyst Ben Newell.
Gearing a positive in rising markets and a negative in falling markets.
If I could leave you with just one nugget of investing wisdom today, it would be to NEVER overlook the incredible wealth-building power of dividends.
Few investors realize how important these unglamorous workhorses actually are.
Here’s a perfect example…
If you put $1,000 in the dividend-paying stocks of the S&P 500 back in 1973, you would have had $87,560 by 2023, or 87x your money.
But the same $1,000 in the non-dividend payers would have grown to just $8,430 — 90% less.
That’s why I’m a dividend fan.
The stock market is a fantastic wealth-building machine, but it doesn’t always go straight up!
There have been plenty of 10-year periods where the only money investors made was in dividends.
And that’s what gives us dividend investors such an edge.
When you lock in an 8%+ yield, you’re booking an income stream that’s bigger than the stock market’s long-term average return right off the bat.
Of course you can’t just buy every ticker symbol out there with a flashy yield, or you’ll get burned pretty fast.
So let’s wipe the false promises of mainstream finance from our minds and start thinking the “No Withdrawal” way…
Step 1: Forget “Buy and Hope” Investing
Most half-million-dollar stashes are piled into “America’s ticker” SPY.
The SPDR S&P 500 ETF (SPY) is the most popular symbol in the land. For many 401(K)’s, this is all there is.
And that’s sad for two reasons.
First, SPY yields just 1.2%. That’s $6,000 per year on $500K invested… poverty level stuff.
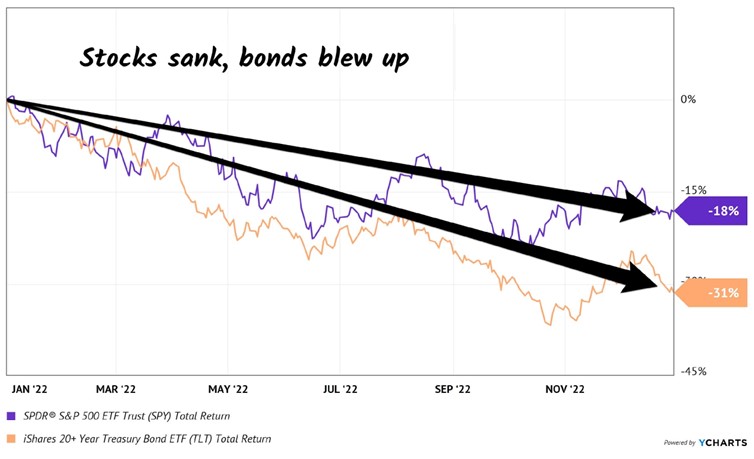
Second, consider 2022 for a moment (and only a moment, I promise!).
SPY was down nearly 20% that year. That is no bueno, because that $500K would have been reduced to $400K.
The last thing we want to do is lose the money we’re getting in dividends (or more) to losses in the share price. Which is why we must protect our capital at all costs.
Step 2: Ditch 60/40, Too
The 60/40 portfolio has been exposed as senseless.
Retirees were sold a bill of goods when promised that a 60% slice of stocks and 40% of bonds would somehow be a “safe mix” that would not drop together.
Oops.
Inflation — plus an aggressive Federal Reserve, plus a (thus far) persistently steady economy — drop-kicked equities and fixed income before they went on a serious bull run in 2023 and 2024.
It just goes to show that bonds are not the haven guaranteed by the 60/40 high priests. They could easily plunge just as hard (or harder) than stocks in the next economic crisis.
Just like they did in 2022 (sorry, we’re only going to spend one more second on that disaster of a year). US Treasuries plunged, which resulted in the iShares 20+ Year Treasury Bond ETF (TLT) getting tagged.
Sure, it still paid its dividend. But even including payouts, the fund was down 31% — worse than the S&P 500. Ouch!
When stocks and bonds are dicey, where do we turn? To a better bet.
A strategy to retire on dividends alone that leaves that beautiful pile of cash untouched.
Step 3: Create a “No Withdrawal” Portfolio
My colleague Tom Jacobs and I literally wrote the book on a dividend-powered retirement.
In How to Retire on Dividends: Earn a Safe 8%, Leave Your Principal Intact, we outline our “no withdrawal” approach to retirement:
Save a bunch of money. (“Check.”)
Buy safe dividend stocks with big yields
Enjoy the income while keeping the original principal intact.
Investing The top UK dividend stocks as payouts come under pressure Dividend payouts dropped in the second quarter due to exchange rate and economic pressures
By Marc Shoffman
A steep decline in special dividends and poor exchange rates hit income-hungry investors during the second quarter and payouts could fall further, research suggests.
Dividend stocks are popular among investors when looking at the top funds to invest in as they provide income and capital growth, but the companies behind them are not immune from stock market uncertainty, which can make payouts hard to predict.
Share transfer company Computershare’s latest Dividend Monitor shows UK companies distributed dividends of £35.1 billion during the second quarter of 2025, falling 1.4% on a headline basis year-on-year. It follows a 4.6% drop in the first quarter.
Get 6 issues for £1
a free notebook Stay ahead of the curve with MoneyWeek magazine and enjoy the latest financial news and expert analysis.
MoneyWeek The decline was attributed to one-off special dividends halving to £2 billion, knocking five percentage points off the headline growth rate.
The weakening dollar also had an impact, reducing the sterling value of payments declared in dollars by £934 million during the second quarter alone.
The median growth in company payouts was 4.1%, just ahead of inflation but still relatively modest, and a proportionally large 22% of companies cut their dividends year-on-year, according to the report.
There are more positive ways to look at the dividend data though.
Once you strip out the special dividends and exchange rate factors, regular dividends were actually 6.8% higher at £33.1 billion, beating Computershare’s forecast by £230m.
Defence contractors and financials accounted for three quarters of the growth in dividends during this period.
“The outcome was even better than we anticipated owing to pockets of strength in a few sectors like finance and aerospace,” said Mark Cleland, chief executive of issuer services at Computershare.
“Overall, companies are cautious, tending not to announce significant increases in their dividends – indeed many have made cuts – and special dividends are in steep decline this year too.”
The top sectors for UK dividends Aerospace and defence contractors Rolls-Royce and BAE Systems made the biggest contribution to growth, according to the research.
This was helped by Rolls-Royce, which paid its first dividend since the pandemic, with a £508 million payout to shareholders.
Its payout accounted for just under a quarter of UK underlying dividend growth in the second quarter, Computershare said.
Banks and insurers also made a significant contribution to second quarter dividend growth.
Payouts from banks jumped 8.1% during the quarter, contributing one third of the increase.
Rising profits among insurers, thanks to higher premiums, meant a 15% increase in their dividends, making up one fifth of the second quarter increase.
Mining stocks had the largest negative impact on dividends during the second quarter, where payouts fell 9.2%.
Rio Tinto cut its dividend in early 2025 as a direct response to weaker profits driven by falling iron ore prices and rising production costs. It was joined by reductions from Anglo American and Glencore.
Top UK dividend stocks HSBC tops the table for dividend payouts in the second quarter, followed by Rio Tinto, Shell, Playtech and British American Tobacco.
The top five paid out £12.8 billion to investors during the quarter, 36% of all dividends paid during the period.
What is the outlook for UK dividends? Dividend payouts are reliant on companies making a decent profit.
That is becoming more of a challenge in the UK amid rising taxes and economic uncertainty, while dollar exchange rates amid Trump tariff concerns are also putting pressure on payouts.
Computershare has cut its headline forecast for 2025 by £1.8 billion.
It blamed an expected drop in one-off special dividends, more share buybacks and exchange-rate factors, pushing the headline total down 1.4% year-on-year to £88.3 billion.
However, after stripping out exchange rates and one-off special payments, the relatively strong first half is enough to compensate for softness in the second half of the year and means an overall upgrade to underlying growth, Computershare suggests.
As a result, the report now projects an underlying increase of 2.8%, previously 1.8%, for the full year, delivering regular dividends of £85.1 billion in 2025.
Broken down by quarter, Computershare expects a 0.6% dip in the next three months and for payouts to be flat in the final months of the year.
Cleland added: “The underlying growth rate is the best way to understand how dividends are increasing over time, however the headline total is the actual income shareholders receive – and this remains under prolonged pressure.
“2025 is anticipated to be the third year of stagnation as slow underlying dividend growth, the strong pound, and lower special dividends as well as the drag caused by significant share buyback activity, are all combining to keep pressure on the amount companies are opting to distribute as dividends.
“Sustained economic growth in the UK and around the world is the key to driving UK payouts higher again, because it will enable companies to grow the profits investors want to see.”
Another look at Regional REIT The Oak Bloke Jul 22
Dear reader
I last looked at RGL in July 2024 in “RGL-me-this”. Looked twice actually. After all, I wrote an article basing my numbers on the data from both HL and Stocko but both were wrong. Their numbers were incorrect. I rewrote the article but it was the last time I took their data at face value. Oh how the detractors chortled at my error!
I revised my article based on new evidence and came away with a No, on balance at 137.4p.
A year later it is 125p so I was spot on where RGL dropped to 101p post Lib day in April. But it is up about a quarter over the past 3 months.
So worth another look? Upwards from here?
House broker Shore Capital say sure it is. “It’s now in robust strategic shape and increasingly now in charge of its own destiny”.
Hmmm.
They explain: “An ongoing programme continues…. a further pipeline of 40 assets currently valued at £102.6m is either in sale progress, on the market or being prepared for sale and we remain optimistic the majority of it can be successfully realised.”
Hmmm.
Disposals (net of costs) were £28.6m in 2024 and £25m in 2023. Years in which RGL was desperate to raise cash. So how will they accelerate their disposals by 2X to realise the majority? Or are we just talking 50.0001% of that £102.6m? What majority are we speaking of?
The reason I worry about Shore being so sure is I have one eye on the Bank Debt and £99.8m in due in just 12 months. Can they roll that forward? Probably. They are well within their covenants now. They stiffed their shareholders to stay in them in 2024 with a £110.5m equity raise which doubled the number of shares. Luckily for OB readers who followed my article they’d sold out before then.
The 2023 accounts showed a -£80m reduction in property values and 2024 followed with further bad news and the portfolio dropped a further -£50m, although there’s a tiny bounce up in 1Q25 of +£1.9m to £607.8m (NB disposals in the period were £1.6m). The start of a recovery?
“Today” was what I wrote in last July’s article (so the estimated position back last year) and “Tomorrow” was how I modelled for the year end (of 2024). The DEC-24 columns shows the actual result. Debt lower, with drops in working capital too.
Similarly I expected a drop in rental income, but the £14.33m result in 1Q25 shocks me a bit. That’s quite a bit lower. We also see higher property costs in 2024 too. -£19.3m is -£4.8m per quarter. Net profit of £20.9m is -19.7% lower than 2023. Is that a “robust strategic shape” you can see there? Not Shore about that.
Although there is better news that in 2025 seven new lettings and eight renewals worth £1.6m a year were let at 6.32% above ERV (estimated rental value).
That’s only £0.1m above, big deal?
But what if we apply that to the expiry profile let’s see what that means for income.
Nothing dramatic but applying some small rises and a period of zero rises, followed by some more small rises gets me to a renewed rentals of £64m, based on the current portfolio.
Disposals The current portfolio is not going to remain as is. It’s going to change.
We learn that in 1Q25 they disposed of -£1.6m and post period -£6.2m more. So 2025 is so far going the same speed of disposals in 2023 and 2024 then.
The next bit is where it begins to get exciting. RGL speak of splitting its portfolio into four. Core is the good stuff, and fair play it’s 88.1% occupied and it’s the majority of the portfolio. Nice. A definite ray of sunshine appears, sure as eggs is eggs.
“Capex to Core” are the ones we are told we can expect shall be upgraded and therefore become core and enjoy a higher per square foot rental. I’m assuming a 25% increase and that the occupancy moves from 77.6% to 88.1%.
The third type “Value Add” are all about adding value and doing stuff to achieve a higher disposal value than its current book value. This will be change of use and potentially involve obtaining planning permission. Deduct £31m if you disagree with that idea but RGL speak of “greater potential” and quote examples with strong upside.
The “Sales” segment on the other hand I’m assuming lose about 20% of their value i.e. they get realised for 80% of their valuation.
If that’s the case then here’s the result:
We see that pro-rata to the rentals for the properties with occupancy is £496m of the property portfolio is actually occupied and generating rents (at the end of 2024). By completing the disposals the Core and Capex to Core gets you to £510m. The ERV (100% rent) was £77m but drops to £62.5m and at 88.1% occupancy but with a 5% bump that’s a £57.33m annual rent…..
But that assumes 88.1% occupancy is the best it can get. Clearly that not true in a more robust environment. As the portfolio rises above 90% (on the basis of a recovery in the demand for offices) the prior £60.7m rental income appears achievable. To speed that outcome, rental values are rising again in 2025 and are reflected in the 2025 letttings PSF rates achieved.
The real benefit is that an estimated £150m capital potentially reduces debt down or put another way there’s £200m+ of headroom “to do something”.
I can’t shake the feeling that the plan in that scenario could be to develop one or more of its assets under the “value add”. Using debt and that headroom to fund one or two potential GDVs of gross development values of £100m+ and £200m+ on properties that today are valued circa £10m, leaves potential for RGL plus a developer to make a mutual return. OB idea Watkin Jones is one such example of a potential partner.
Valuation RGL has always been a good dividend payer and its recent news to increase the dividend to 2.5p per quarter means 10p a year and 10% yield for those lucky enough to buy at the April low, and a still decent 8% yield for today’s punter. Is that tempting?
I can see a £23m adj. net profit from the rentals in a reasonably near future. On a marcap of £204m that’s an 11.5% return.
But then you must compound the expectations that a ~£500m property portfolio of mainly freehold offices can expect to appreciate in value too. By 5% a year? That’s a £25m gain on top.
11.5% becomes a 24% ROE. Now we’re talking.
The ~£500m of property are valued at £106.1m per square foot. That’s £1,141 per square metre. That’s about 60% BELOW the replacement cost of building an office. These construction cost numbers are from 2023 so are proably higher in 2025 too.
Conclusion Given we see the turning of the tide I’m turning my decision from a SELL to a BUY. I was initially sceptical of the broker’s breezy optimism. Could the refinance be a menace? Yes it could. There is a theoretical risk, although it also seems unlikely to think a bank will not support a property manager with existing cash, in a rising market, and where the debt is quite low, not near to covenants and fully covered by income.
Regards
The Oak Bloke
Disclaimers:
This is not advice – you make your own investment decisions.
The big fall in the chart was the ending of the dotcom bubble.
For dotcom read AI, dotcom mania took a long while to reach it’s conclusion so it’s better to follow than repeat. TR or a Dividend Re-investment plan ?
The graph includes earned dividends which could be re-invested in a high yielding Investment Trust, earning more dividends to re-invest in a high yielding Investment trust.