There’s no question that valuations are starting to look stretched in some parts of the stock market. But I don’t think that should deter investors from looking for shares to buy.
Valuations
Both the FTSE 100 and the S&P 500 are trading at some of their highest price-to-earnings (P/E) multiples in recent years. And that’s because share prices have gone up faster than profits.
That makes the equation less attractive for investors, but this certainly doesn’t mean a crash is imminent. And I don’t think it’s a good reason to stay away from the stock market entirely.
In general, the fact that a stock trades at an unusually low P/E multiple doesn’t mean it has to go up any time soon. It can take weeks, months, or even years.
Equally, there’s no rule that stocks trading at high multiples have to crash in the near future. Even at a P/S multiple of 120, it’s not illegal for Palantir shares to keep going up!
It’s nearly always the case in the stock market that there are shares that trade at relatively low prices but could be very rewarding long term. And I think there’s one name that’s hiding in plain sight at the moment.
Inefficiencies
Shares in Amazon (NASDAQ:AMZN) fell 8% after the firm released its earnings report for the second quarter of 2025. But revenues were up 13% and earnings per share increased by 33%.
The reason the stock fell was because the company’s forecast operating income for Q3 of between $15.5bn and $20.5bn is roughly in line with where it was in 2024.
One potential cause of this is the impact of US tariffs and this is a risk for investors to consider. But at $217, I think the valuation multiple means the stock’s well worth a closer look.
I find it hard to see that as anything other than a stock market inefficiency. And that’s without factoring in Amazon’s advertising business growing at 23% a year and AWS posting 17% growth.
Importantly, I also don’t see tariffs as a genuine threat to Amazon’s long-term competitive position. So I don’t think the stock should be trading at an unusually low P/E multiple.
Opportunities
The truth about the stock market is that there are always shares that are overvalued somewhere. I think that applies to quite a few right now, so it might be fair to say there’s a bubble forming.
Equally though, there are always shares that are undervalued. And the best thing for investors to do is keep looking for these, even when they might seem hard to find.
I have a lot of stocks on my watchlist where I think they’re in bubble territory. But Amazon’s one I’m looking at for my portfolio this month.
AI Is Driving Huge Profits, These Are Best Dividends up to 13%
Michael Foster, Investment Strategist Updated: July 31, 2025
By now you’ve no doubt heard the argument that AI is a bubble, and there’s no way Big Tech will make a significant profit from it, given the massive amounts of cash they’ve already piled in.
That take is just plain wrong—truth is, the tech giants are already booking profits from AI. And we closed-end fund (CEF) investors can grab our share at a discount—and at dividend rates running all the way up to 13%, too.
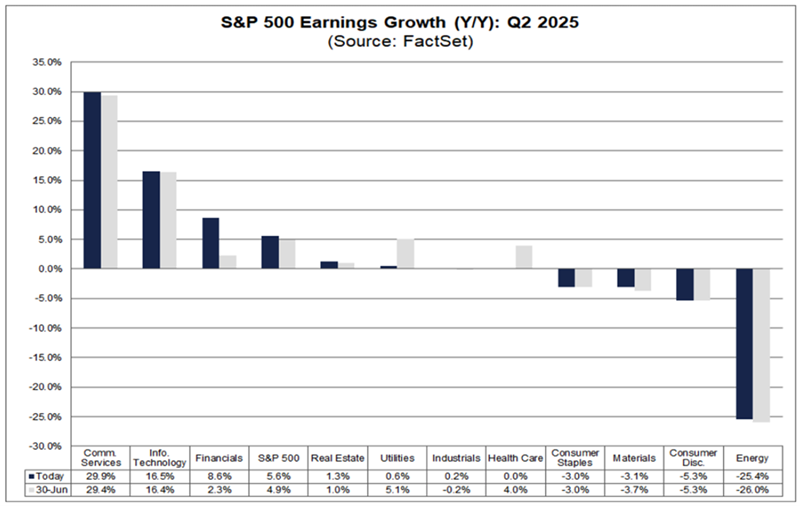
This next chart tells us straight-up why the “AI-is-unprofitable” theory is off the mark.
Look at the far left of this chart and you see that communication-services stocks led in profit growth in the second quarter of 2025.
Alphabet (GOOGL) and Meta Platforms (META) are both titans of that sector, and both have invested billions in AI. They’ve largely done it by buying chips and other hardware, as well as software, from IT firms like NVIDIA (NVDA).
That pop in communication-services earnings proves that these companies are profiting from AI. Similarly, the second-highest earnings gains in the chart above, in IT, confirms that AI actually does make money for Big Tech.
Tech-Focused CEFs Go on a Tear
When it comes to high-yielding, tech-focused CEFs, there are basically four tickers that income investors look to. Let’s check in on those now.
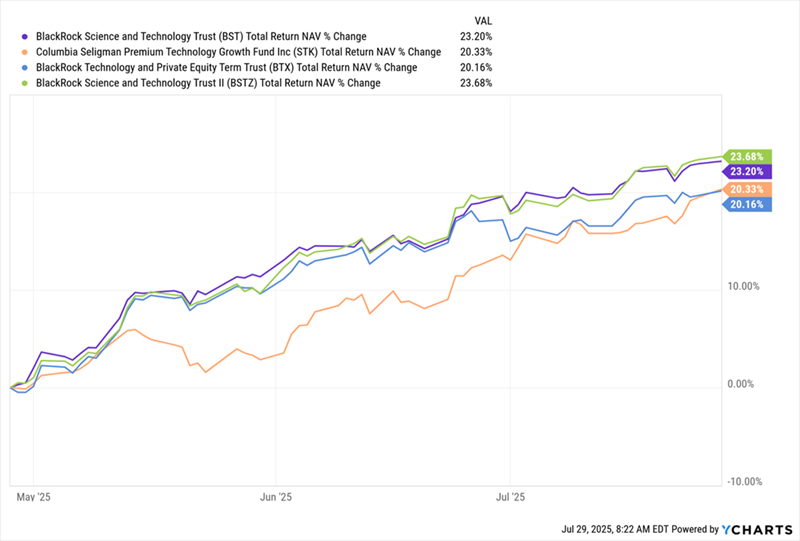
As you can see in the chart below, all four of these funds’ net asset values have been roaring higher, with the 12.3%-yielding BlackRock Science and Technology Term Trust (BSTZ), in green, leading by a small amount over the last three months. It’s followed closely by its sister fund, the 7.7%-yielding BlackRock Science and Technology Trust (BST), in purple.
The BlackRock Technology and Private Equity Term Trust (BTX), with its huge 13% yield (in blue), and the Columbia Seligman Premium Technology Growth Fund (STK), (in orange and paying 6%) bring up the rear.
Tech CEFs Rise Across the Board
The Best Tech CEFs Are Still Great Bargains
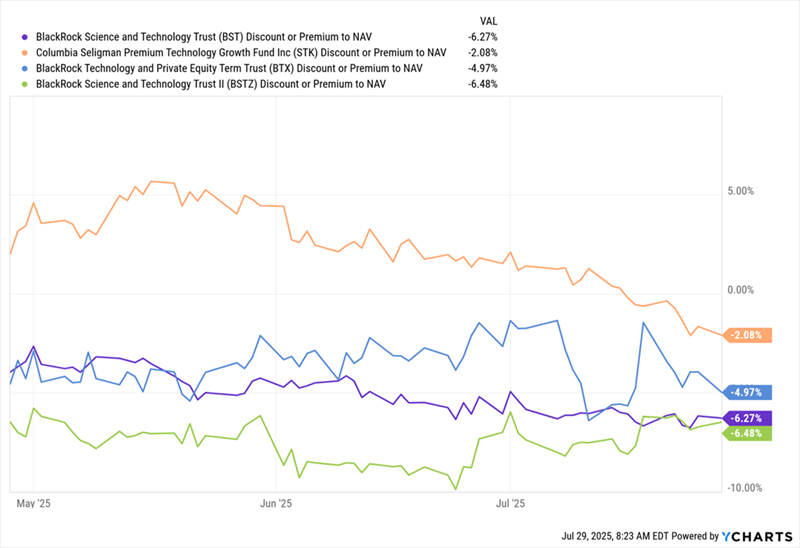
The interesting thing, however, is the fact that these funds still trade at discounts to net asset value (NAV). The best values are the three BlackRock funds (again in green, blue and purple):
Tech CEFs Get Cheaper, Led By BlackRock Funds
We’ve seen BSTZ’s discount remain basically where it was three months ago, despite its strong NAV return in that time, while BST’s discount has widened slightly, despite its strong performance.
The third BlackRock tech CEF, the BlackRock Technology and Private Equity Term Trust (BTX), has seen its discount narrow slightly (April was a great time to buy BTX). The Columbia Seligman Premium Technology Growth Fund (STK) is the priciest of our quartet, but context matters here, as its premium to NAV, which it has held for much of the last decade, suddenly disappeared.
Let’s stick with STK for a bit. Despite that fund’s smaller discount, is it still worth our time? I’d say yes, given the next chart. But there is a caveat that we’ll get into shortly.
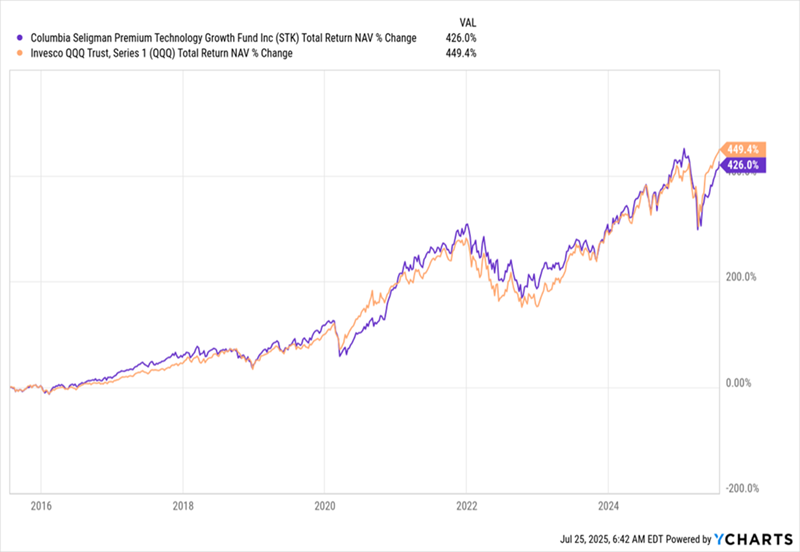
STK Tracks the NASDAQ Higher, Pays a Bigger Dividend
Before we get to that, we see that STK, whose NAV (in purple above) has closely matched the NASDAQ 100 (whose benchmark index fund is shown in orange) over the last decade. That makes STK a good way to get tech exposure, plus the index’s diversification.
I mention that diversification because STK is tech-heavy, with core names like Microsoft (MSFT), NVIDIA and Apple (AAPL). But like the NASDAQ, it also branches out a bit, with holdings in companies like Visa (V) and Bloom Energy (BE), which focuses on products that help customers generate power on-site.
On the dividend side, STK’s 6% yield far outruns the NASDAQ’s 0.5%, and the CEF has also never cut its payouts. However, STK is contending with funds yielding a lot more—up to 13% in the case of the highest-paying BlackRock fund, BTX.
That’s the real reason for STK’s growing discount: Even though it was swept up in the tech rally, its lower payouts aren’t enough for many income investors, now that there’s more competition, plus dividends that nearly double STK’s 6% yield, among tech CEFs.
This is why the bigger discounts offered by the BlackRock funds are the better deals here, and why STK’s discount isn’t yet big enough to warrant our attention.
These Tech CEFs Are Just the Start. Here Are the Real AI “Dividend Winners”
We’re still in the early stages of AI’s stunning growth. As this breakthrough tech embeds itself across the economy, it’ll drive massive productivity gains—fattening the profits of AI providers and AI users alike.
Return to the Office? Try Revenge of the Office. This Surging Divvie Loves It.
Brett Owens, Chief Investment Strategist Updated: July 29, 2025
I have to laugh when I hear the phrase “return to the office.”
I mean, COVID started more than five years ago. With the turnover in Corporate America since then, we can hardly call what’s happening now a “return.”
Most of those “returning” aren’t even the same people!
Nonetheless, the, shall we say, revenge, of the office is real. My wife and I saw it firsthand when we went to an open house here in Sacramento a few months ago. Staring into the front room, labeled “home office,” my wife said, “Programmer.”
“They’re hoping for a rentback,” said the realtor. “The couple has to move out of town for work.” Back to the Bay Area for these two!
They’re far from alone. Major cities—Boston, New York, San Francisco—are shaking off five years of downtown rust, preparing for commuters back four or more days a week.
Funny thing is, many companies issuing back-to-office mandates these days don’t have space for these workers, after shedding leases in 2021. Pinterest (PINS), you may recall, canceled a lease for nearly 490,000 square feet of future office space back then. Meta Platforms (META) walked away from 200,000 square feet in New York.
Nowadays, freshly “returned” workers are elbowing each other out of lousy temporary desks! That means we’re going to be looking at a “reverse 2021” shortly, as companies hunt for more space. And I’ve got a complete strategy for us to play it—and grab some high, and growing payouts, as we do.
“Revenge” of the Office Will Long Outlast Work-From-Home
According to Placer.ai’s Office Index, June was the fourth-best month for in-office visits since COVID. (Placer specializes in foot-traffic data for offices, stores and the like.)
That might make it sound like we’re too late here. But the gap between now and the “old times” is still wide, with office visits down about 27% compared to June 2019.
A shifting trend with at least a 27% runway still ahead? That has our attention.
So how do we tap into it? Here’s my take on two popular office landlords. One is the wrong way to play the shift; another could work as a speculative pickup. Finally, we’ll dive into our very best play on this trend, which isn’t an office REIT at all.
Sell This “Revenge of the Office” Stock Yesterday
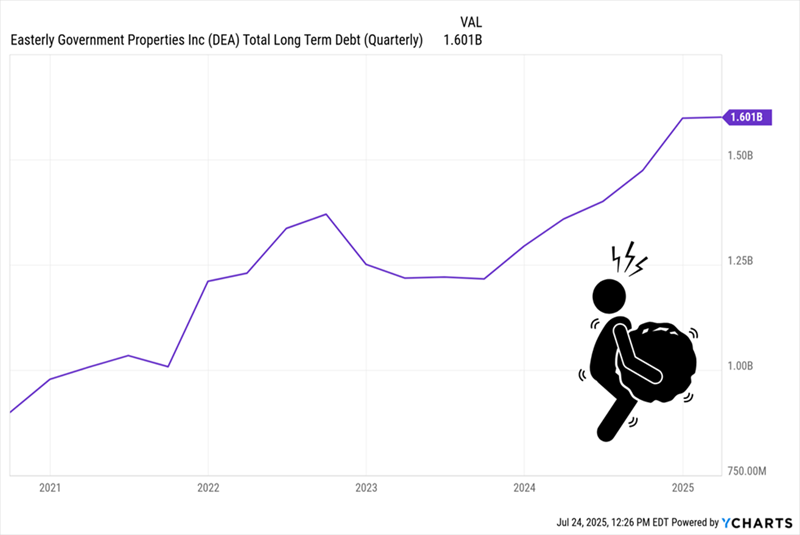
Let’s start with one REIT we’re not going to buy: Easterly Government Properties REIT (DEA).
Back in the “old days,” having a portfolio of mainly government tenants was a plus—Uncle Sam, of course, always paid the rent! But now, a government focused REIT is the opposite of conservative. Uncle Sam has been on a spending bender and has a $2-trillion deficit to tame. That adds risk.
Don’t be pulled in by its 7.7% dividend. DEA’s $1.6-billion of long-term debt eclipses its market cap (or value as a public company) by a lot—about $600 million. And it’s been rising.
DEA Groans Under Heavy Debt Load
DEA also executed a 1 for 2.5 reverse stock split on April 28. This is usually done to reduce its share count and give the impression of a higher share price—not a good look. Neither is the 32% dividend cut the REIT announced earlier in the month. Management still has a lot of work ahead to turn things around, and we don’t need to be here for it.
This NYC Office Landlord Has Appeal—and Risk, Too
Next up is SL Green Realty (SLG), with interests in 53 buildings, or around 31 million square feet, in New York City. SLG yields 5.1% dividend, and that payout is well-covered, at 53% of the midpoint of management’s forecast funds from operations (FFO—the best metric of REIT profitability) for 2025.
In fact, with that low of a ratio (for a REIT—ratios of 80%+ are common in the sector, and safe, thanks to steady rent checks), I’d expect SLG to do more on the payout front. But it’s been holding off for a good reason: Management has been cutting long-term debt, from about $5.5 billion five years ago to around $3.7 billion today.
That’s smart, as interest rates remain elevated. But I’m concerned about the company’s focus on New York, where office visits are only 5.3% below 2019, according to Placer’s June numbers. Moreover, SLG’s occupancy rate is a bit lower than I’d like to see, at around 91%, as of June 2025.
All of this suggests SL’s growth potential may be close to a top. But that’s not the case with the REIT I favor most as a play on “revenge of the office.”
Our Top “Revenge of the Office” Play Isn’t an Office Owner at All
There’s a chance the couple whose open house I attended are headed back to the Bay Area—and renting an apartment there from Equity Residential (EQR).
The REIT yields 4.1% and has interests in nearly 85,000 units in major markets like Boston, New York, Washington, DC, and, on the West Coast, Seattle, San Francisco and Southern California.
Regarding those last three markets, I know there’s been a lot of talk about AI replacing humans in Big Tech, and that trend will continue. But it’ll still take years to play out.
Meantime, Big Tech still employs more people than it did five years ago. Consider Meta, which had 58,604 workers back in 2020. As of March 31, that number stood at 76,834. And even if headcounts just held steady, demands for more in-office time alone will bring more workers back to these areas. Meta, for the record, requires three days a week, while Salesforce (CRM) now requires three days at minimum, with some teams back in their cubicles four and five days.
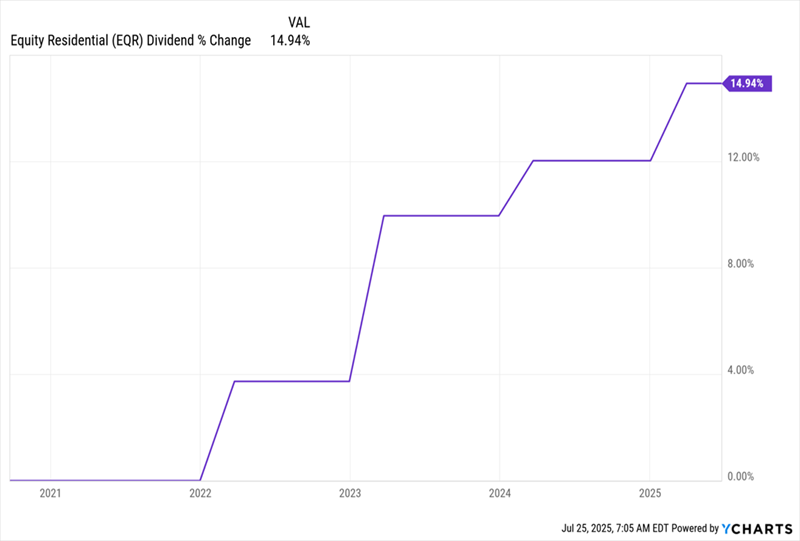
Continued jobs growth supports EQR’s cash flow—and dividend, which has returned to growth after staying flat during the pandemic years. That’s notable, as management has been raising the payout straight through the current higher-rate period, which has been tough on REITs.
EQR’s Dividend Springs Back to Life
To be sure, EQR’s dividend yield is a bit low for us. But it has room to keep growing, with the current yearly amount at 70% of the midpoint of management’s forecast 2025 FFO—again, low for a REIT.
What’s more, EQR is seeing rental rates rise, with the expectation of what it calls “blended rates” rising around 2% to 3% this year. Occupancy is also high: 96.2% as of the end of Q2.
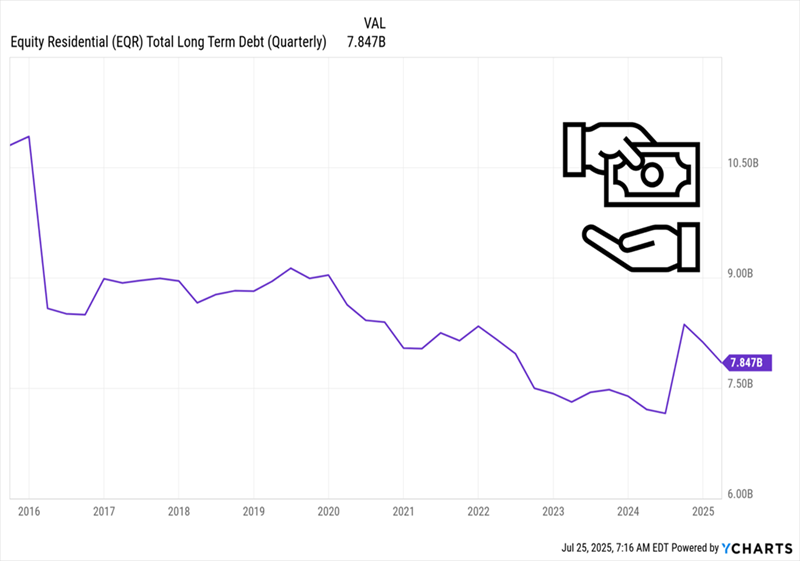
What’s more, the REIT stands to gain as interest rates move lower over time, cutting its borrowing costs. That’s a big plus—and management is already doing a solid job on the debt front, reducing long-term borrowings sharply in the last decade. The current level of $7.85 billion is just 31% of EQR’s market cap, or its value as a public company. That’s a very light debt load for a REIT.
Management Tackles Debt, Leaving More Room for Divs, Expansion
Finally, we love the fact that EQR is smartly culling older buildings from its portfolio and using the proceeds to snap up newer ones. That, of course, boosts its portfolio value and attractiveness to tenants while going easy on its balance sheet.
In the second quarter, the REIT sold off some of its older properties on the coasts and used the cash to pick up 2,064 units in fast-growing Atlanta. Management sees these new additions contributing to FFO in about two years.
Tech workers, after all, love their modern conveniences. EQR’s newer units give them just that—a small consolation, perhaps, for being herded back to the 9-to-5 grind.
These 3 Funds Squeeze Apple and Microsoft for Dividends up to 11%
Brett Owens, Chief Investment Strategist Updated: August 1, 2025
The Nasdaq has been rallying nonstop since April. Let’s discuss three payouts up to 11.2% that play the rally.
The catalyst is the “rise of the machines” with companies replacing expensive humans with cheaper robots and AI tools. Hiring numbers are down and (paradoxically to some) the Nasdaq continues to levitate higher.
This summer heater in tech stocks is no surprise to us contrarians. The Naz tech giants are enjoying expanding profit margins! Amazon (AMZN) CEO Andy Jassy recently admitted the company’s workforce will shrink, replaced by AI. This is bad for those who work at Amazon, but great for those who own AMZN.
Microsoft (MSFT) also announced big layoffs in recent months, especially in sales and support roles easily handled by AI-driven tools. And my friends at Alphabet (GOOG) are looking over their shoulders wondering how much longer their services will be needed.
This is a dicey time to be a rank-and-file tech bro—but an exciting time to be a tech savvy dividend investor. Here are three “one-click” (or one-tap) dividend plays on this megatrend!
Global X Nasdaq 100 Covered Call ETF (QYLD) Dividend Yield: 11.2%
Alphabet (GOOG) will never pay 11.2%. But we can buy GOOG and the rest of Big Tech for 11.2% payouts via a fund like Global X Nasdaq 100 Covered Call ETF (QYLD), which sells (“writes”) covered call funds on the Naz index itself to generate additional income.
QYLD buys the stocks in the Nasdaq-100 and simultaneously writes covered calls on the index itself to generate income—which it pays out monthly.
It’s not perfect exposure to technology. The Nasdaq-100 is made up of the 100 largest nonfinancial companies listed on the Nasdaq exchange, and in fact, it includes stocks from 10 different sectors. However, it’s still tech-heavy, at 60% of the index’s weight, and includes trillion-dollar tech firms like Apple (AAPL) and Microsoft (MSFT), so it’s generally treated as a proxy for the sector.
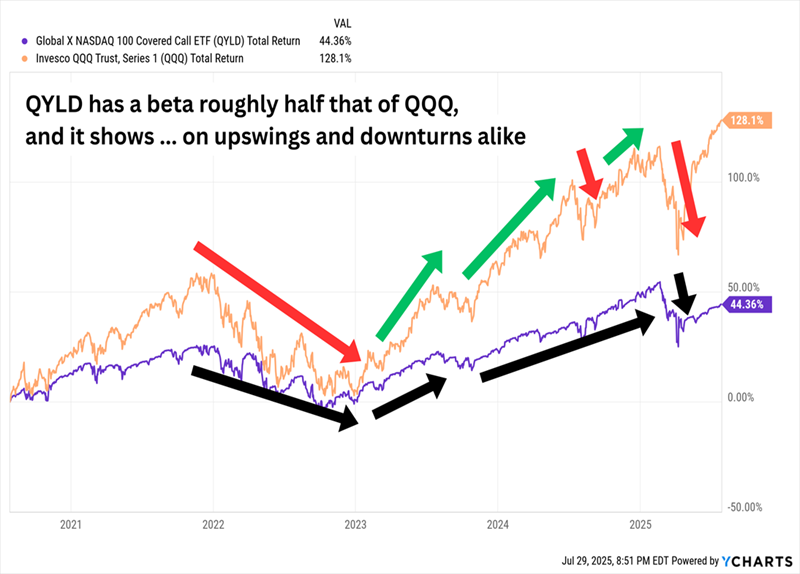
But that’s a marginal consideration. The real tradeoff to weigh is tactical. By selling covered calls against the Nasdaq, we’re sacrificing potential upside in return for a.) much more stability and b.) the very high income from the options premiums it collects.
QYLD will rarely outperform the “QQQs” to the upside. But it also has less downside exposure, thanks to the constant income it generates by selling the call options.
QYLD: Wilder Rips, But Deeper Dips
JPMorgan Nasdaq Equity Premium Income (JEPQ) Dividend Yield: 10.8%
The JPMorgan Nasdaq Equity Premium Income (JEPQ) uses a similar strategy, owning roughly 100 or so Nasdaq stocks while selling calls against the Nasdaq-100. It also doles out its massive dividend in monthly distributions.
But it’s a little more flexible because of a big difference between it and QYLD: management. Whereas QYLD tracks an index and typically has only one options position at any given moment, JEPQ is led by 38-year veteran Hamilton Reiner and a team of four co-managers who can sell multiple contracts.
I’ve also pointed out in the past that while both funds hold pretty much the same stocks, JEPQ is more heavily weighted in mega-cap names than QYLD. But that’s not by definition. Indeed, today, JEPQ has a smaller percentage of assets invested in each of its top 10 holdings than QYLD.
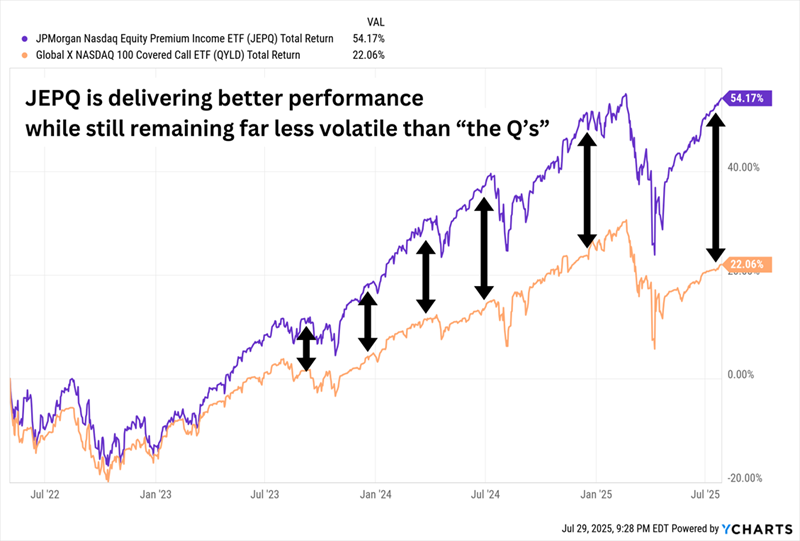
These might not seem like meaningful differences, but over time we see that JPMorgan’s “homemade” strategy beat QYLD’s straightforward approach.
JEPQ Has More Than Doubled Up QYLD Since Inception
Active management can make a world of difference—so much so that I typically prefer closed-end funds (CEFs) over comparable ETFs. Let’s walk over to the CEF side of the border to review our final call writer.
Columbia Seligman Premium Technology Growth Fund (STK) Distribution Rate: 6.0%
Columbia Seligman Premium Technology Growth Fund (STK) is a CEF, while QYLD and JEPQ are ETFs. But the differences go far beyond fund type.
Paul Wick, who has nearly four decades of experience, and a team of five other managers run a slimmer portfolio of about 55 holdings. The portfolio is also a purer—though not pure—play on technology, with about 70% of assets dedicated to the sector. STK also is interested in “growth at a reasonable price” (GARP); a relatively more value-priced portfolio shows it, with price-to-earnings, sales, book, and cash flow all lower than the other ETFs.
And whereas QYLD tries to own Nasdaq-100 stocks (and while JEPQ has a broader mandate but looks index-esque in its larger holdings), STK is much more willing to take some shots—stocks such as Lam Research (LRCX) and industrial Bloom Energy (BE) punch well above their weight.
Columbia Seligman’s CEF writes covered calls, too—typically on the Nasdaq-100, but again, it has more flexibility. For instance, right now, management is selling Apple calls, too.
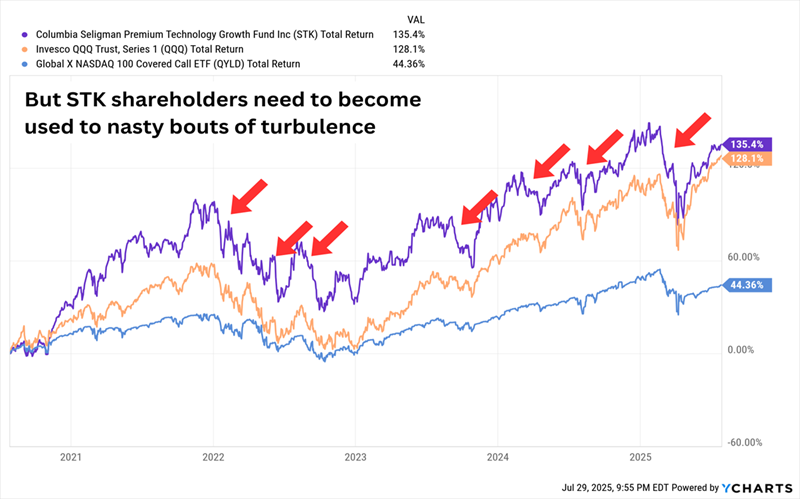
The strategy works. In fact, it works mighty well.
In Fact, STK Often Outperforms the QQQ!
STK still has its drawbacks. Unlike other covered-call funds, Columbia Seligman’s fund is actually more volatile than the Nasdaq, not less. Moreover, while the ETFs pay monthly, this CEF is only paying us on a quarterly schedule—and at current prices (which admittedly represent a slight discount to net asset value), it’s paying us just half as much as JEPQ and QYLD.
I’ve included dividends re-invested, as dividends are automatically included in the quoted price.
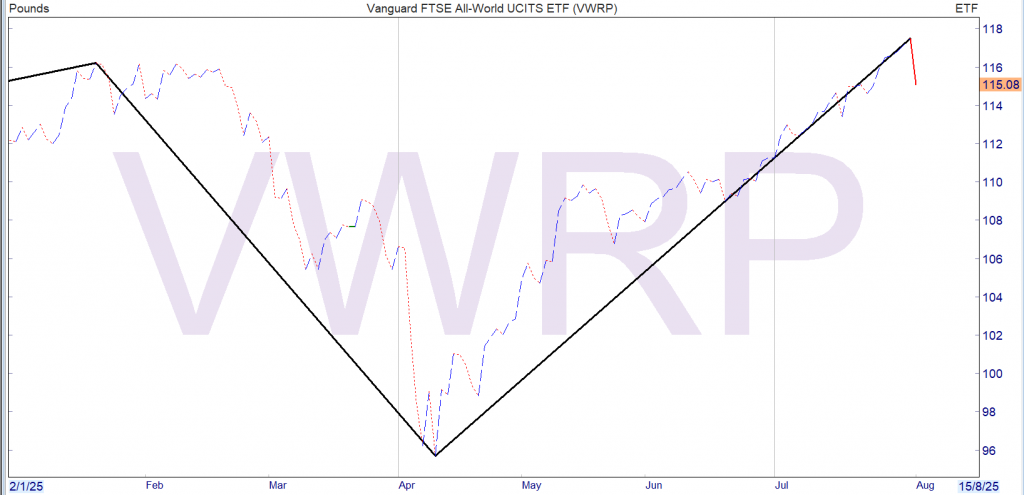
Looks look forward, in twenty years time you are 2 years from you planned retirement date and if you have been paying attention you know with compound interest that you earn more income in the last few years than in most of the early years, here you have earned, zero, zilch, nothing.
If we compare to the Snowball in twenty years time:
In year one you could earn £25,738
In year two £27,539
Of course, you could be lucky and VWRP goes up by more but do you really want to rely on luck to fund your retirement ?
Our columnist explains why these investment trusts are in his forever fund and how they could be a good match for investors who want to diminish risk by diversification.
31st July 2025
by Ian Cowie from interactive investor
Tilting at windmills was an early sign that Don Quixote was going mad in the famous 1605 novel of that name. Now that Donald Trump, the American president, has taken a tilt at Britain’s wind turbines this week, is it time to reconsider investment trusts exposed to renewable energy?
Trump told reporters at Prestwick Airport in Scotland: “You see these windmills all over the place, ruining your beautiful fields and valleys and killing your birds, and if they’re stuck in the ocean, ruining your oceans.”
He claimed the turbines drive whales “loco” and added: “The whole thing is a con job. Germany tried it, and wind doesn’t work.”
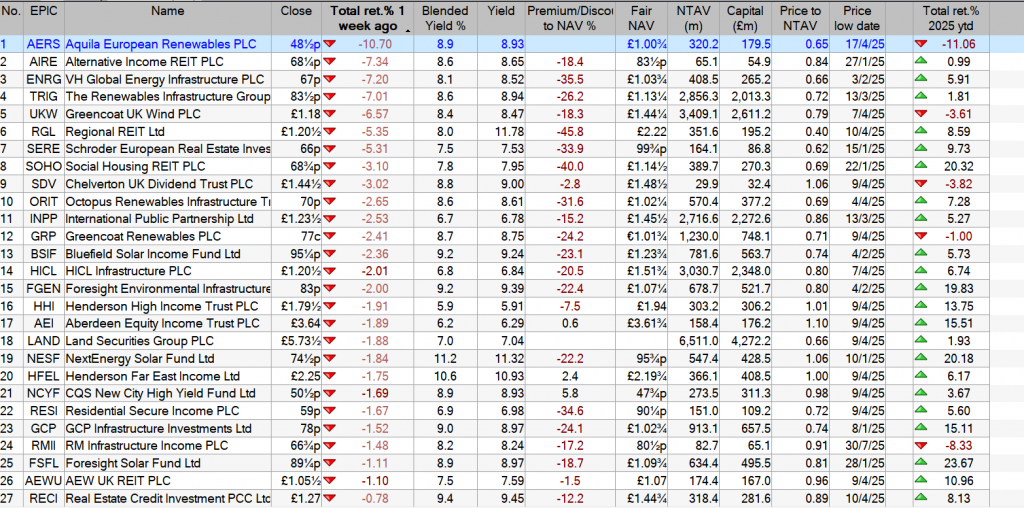
Never mind all that hot air, the £2.6 billion investment trust Greencoat UK Wind UKW
currently blows out 8.3% dividend income, which has risen by an annual average of 7.6% over the past five years, according to independent statisticians LSEG; formerly London Stock Exchange Group.
It is important to beware that dividends are not guaranteed and can be cut or cancelled without notice. However, if that rate of ascent could be sustained, it would double shareholders’ already substantial income in less than a decade.
This exhilarating prospect is enough to earn UKW a place in my ISA, where I hope its handy four-figure annual tax-free income will help to pay for an enjoyable retirement. Better still for buyers today, despite strong long-term returns, recent performance has been disappointing and is reflected in the shares being priced 17% below their net asset value (NAV).
UKW is the top performer over the past decade in the Association of Investment Companies (AIC) “Renewable Energy Infrastructure” sector and ranked second over the past five years, before shrinking over the past year. Its total returns over the three periods were, respectively, 88%; 12% and minus 9.4%.
Elements of the explanation for recent share price weakness include falling electricity output, doubts about dividend cover and NAV. Iain Scouller at the stockbroker Stifel said on Wednesday: “This morning, UKW announced first-half (H1) electricity generation was 14% below budget due to low wind speeds.
“As a result, dividend cover was 1.4 times earnings for H1 as a whole, including two times in Q1 2025, which implies Q2 was barely covered, if at all.
“The NAV also saw a fall over H1 from 151.2p at the end of December last year to 143.4p at June 30, 2025, a decline of minus 5.2%. This is a disappointing set of results given the size of the NAV fall, decline in dividend cover, and we think the discount is vulnerable to widening.”
Against all that, Ben Newell at the stockbroker Investec, noted that UKW has increased its dividends every year since its launch in 2013 by at least as much as the Retail Prices Index (RPI), and repeated his “buy” recommendation. A long track record of preserving the real purchasing power of our income is a powerful attraction for investors nearing retirement.
What do the board of directors think? Three out of UKW’s six directors have more invested in its shares than their annual fees but two of them hold no stock at all and the chair, who has been in place since 2019, holds little more than a tenth of her annual fee in this stock.
More encouragingly, the fund management team hold UKW shares worth £7.1 million, according to Investec’s “skin in the game” research. So, whatever happens next, at least the fund managers and half the board will experience ordinary shareholders’ pleasure or pain.
To return to where we began, Trump has touched a nerve that divides opinion dramatically but this is not the place to get into the ecology or science, for or against, his allegations. From a purely financial point of view, investors who wish to diminish risk by diversification across a wider range of renewable energies might prefer the £3 billion Renewables Infrastructure Grp TRIG
which yields 8.6% income, rising by 2.5% on the same basis as above.
But TRIG’s total returns have been disappointing recently; over 10 years they were 52%; over five years they were minus 13%; and over one year it lost 11%. No wonder TRIG is trading at a 25% discount to NAV.
Even more diversification across all forms of renewable energy, including controversial nuclear power, is provided by my biggest investment trust holding, Ecofin Global Utilities & Infra Ord EGL
.This £294 million fund yields 3.8% income, rising by 5% per annum, and trades 9.8% below NAV.
Unfortunately for investors who seek a long track record of historical data on which to base decisions, EGL won’t celebrate its 10th anniversary before September next year. But its total returns over the past five years were 59% followed by 26% over the past year.
This earns EGL its place as the fifth-most valuable holding in my 50-stock “forever fund” and shows how it can pay to accept a lower initial income, albeit rising strongly, in the hope of higher total returns. That is likely to remain true whatever Trump says or whichever way the wind blows.
Ian Cowie is a freelance contributor and not a direct employee of interactive investor.
Remember most of the compounded gains are made in the final few years rather than in all the early years, so the sooner you start the sooner you will finish.
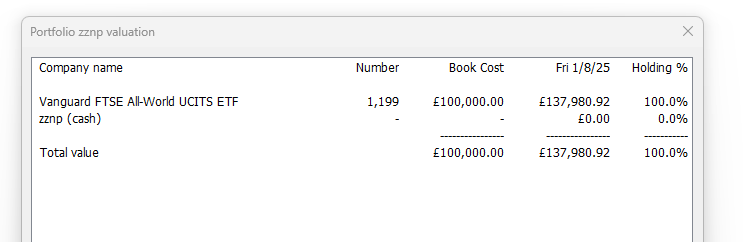
Current earned dividends for the Snowball £7,393, less £1,933 from VPC which has been re-invested to earn more dividends but is not a repeatable dividend.
£5,460, which would equate to income for £9,360 which would be ahead of the plan of £9,120 and the target for next year would be £9,758, if the Snowball manages to outperform, hopefully we will be able to skip a year.
Remember that the table shows the compounded interest added at the end of the year but you will receive dividends every month to invest, to earn more dividends. There is a cost to re-invest so the minimum amount re-invested is around 1k,. Any rebalancing costs uses the markets money so could be less.