Investment Trust Dividends

Month: August 2025 (Page 3 of 13)

Strategy

Trust Intelligence from Kepler Partners

Corridor of uncertainty

Anyone who is not a cricket fan will not know what is wrong with the above meme.

Can an alternative interpretation of discounts identify new opportunities ?

Ryan Lightfoot-Aminoff

Updated 14 Aug 2025

Disclaimer

This is not substantive investment research or a research recommendation, as it does not constitute substantive research or analysis. This material should be considered as general market commentary.

Early August saw a thrilling, albeit rather abrupt, end to English cricket’s summer of test matches with a rollercoaster, nail-biting defeat to India to level the series. These five games were vintage test cricket and a testament to its enduring appeal as a sport and spectacle. Whilst the ebbs and flows and challenges of patience and persistence will always be the main draw behind five-day test cricket, one of the most alluring elements (well, if the evidence of our offices is anything to go by) is the statistics.

The series was a fascinating one from a statistical angle, with numerous records broken in both bowling and batting stats, as well as combined scores. Taking any one of these stats in isolation could be used to show utter dominance by either team, especially with India’s batting stats, and, yet ultimately, the test will go down in the record books as a draw, which India just snatched by the narrowest of margins on the final day.

This use of statistics arguably draws many parallels with finance, where a variety of figures can be used to make a very compelling case for or against a certain investment. In our research notes, we undertake statistical analysis on a trust’s discount in particular, usually comparing the current level to its own history, as well as how it shapes up versus its peers. However, by combining these approaches, we can tell a different story, by revealing a trust’s relative rating versus its peers’, over time. This can identify potential discount opportunities that may have been overlooked using more straightforward analysis.

Opening the bowling

To try and identify these opportunities, we have gone through the AIC universe, excluding trusts with under five years’ worth of data, and sectors with fewer than three trusts or which make poor comparators, such as those including trusts currently winding up. We have compared each trust’s monthly discounts to the simple average of their peer group, looking at how this has changed over time. We have then taken the average of a trust’s relative rating over the five years and compared that to its current level. This has allowed us to identify trusts that have previously traded at a premium rating to peers, but now look cheap. Rather than looking at absolute discounts, this might be a better way to identify opportunities.

The table below shows the ten cheapest trusts on this metric across all sectors. They are ranked by the difference between the current discount to their peer group and its average over five years (given in the final column). The figure in the third column shows the five-year average rating relative to the peer group, with a positive figure indicating a premium. Using Lindsell Train as an example, it has, on average, traded at a 6.3 percentage point premium to its peer group average, yet it is currently trading 12.3 percentage points lower than this (therefore a 6% discount to the sector average). One of the most interesting trusts in this list is RIT Capital Partners (RCP). With a track record of trading on a premium, a consistent absolute discount has opened up in recent years, which is currently as wide as 27%. There has been plenty of turnover in the investment team, including the departure of the late Lord Rothschild, and so it is possible the discount will persist until a decent track record has been built up again. Notably, the recent half-year returns for the trust were positive, with particularly good returns in the directly owned private investments, three realisations being made at an average 112% premium to carrying value. Another notable entry in this table is Schroder Income Growth (SCF). SCF has performed well under the tenure of manager Sue Noffke, although in recent years the mid-cap bias has worked against it. Its discount looks attractive on both an absolute basis and in terms of its relative rating versus the sector, as our data highlights.

THE SCORECARD

TrustAIC sectorAverage relative ratingAverage versus current
Regional REITProperty – UK Commercial-10.92-14.87
ICG-Longbow Senior Sec. UK Prop DebtProperty – Debt-9.94-13.18
RIT Capital PartnersFlexible Investment1.18-12.47
Lindsell TrainGlobal6.34-12.32
Baker Steel ResourcesCommodities & Natural Resources-13.21-10.77
Canadian General InvestmentsNorth America-20.61-9.8
Custodian Property Income REITProperty – UK Commercial6.99-9.22
Schiehallion FundGrowth Capital18.12-7.55
Partners Group Private EquityPrivate Equity6.05-6.31
Schroder Income GrowthUK Equity Income-0.31-6.17

Source: Morningstar, as at 31/07/2025

There are a number of alternative asset classes represented in this chart, including property. We see several reasons behind this, stemming from the more volatile economic environment over the past five years. The earlier part of this period was dominated by near-zero interest rates, implemented to try stimulate economic growth during the pandemic. As economies reopened, though, spending returned and led to a spike in inflation, followed by an increase in interest rates to manage this, which led to wide discounts emerging in rate-sensitive assets. Many of these discounts have been steadily closing as rates have been cut and the outlook changed, creating some volatility in relative ratings.

It’s a similar story with Schiehallion (MNTN) in the growth capital sector. Managed by Peter Singlehurst and Robert Natzler, MNTN owns a portfolio of stakes in late-stage private businesses. The managers take a long-term time horizon, looking to capture the potentially transformative growth opportunities in this part of the market, ahead of listing. Examples of portfolio companies include ByteDance, the owner of TikTok, and SpaceX, Elon Musk’s space exploration company. As such, MNTN offers investors exposure to private companies with high-growth potential that would otherwise be out of reach for most investors. For much of the initial five-year period, the trust traded at a wide premium to NAV, although this was partly as a result of a highly concentrated shareholder base, meaning liquidity was incredibly thin. This changed as the trust’s C shares were converted into the main share class in September 2023; however, by this point, the trust was trading at a discount to NAV, occasionally at a wider level than the sector average. The relative rating has recovered a little since, but compared to the highs at the beginning of the period, it appears relatively good value on our metrics.

MNTM DISCOUNT VERSUS PEERS

Source: Morningstar

Picking gaps in the field

Further down the table, there are other interesting themes. One of the standout equity trusts on these metrics is Merchants (MRCH), a UK equity income trust managed by Simon Gergel and his team. The trust has traded close to NAV for much of the past five years, at an average level of -0.5% as a result of a combination of factors such as size, as it offers institutional investors good liquidity, its comparatively low costs, and above-market dividend yield. This is supported by one of the longest continuous records of dividend increases of any UK-listed company, at over 40 years. However, in 2025, the discount has twice widened significantly, first from January through to April, where it briefly narrowed later in the month, before widening sharply again to its current level of c. 7% (as at 01/08/2025). This latest move has come in a period where the broader UK equity income sector average has narrowed, from around 5% at the turn of the year to 3.4% now. Whilst this isn’t much in absolute terms, it is a notable change when considering it is an average of 18 trusts.

As a result of both moves, MRCH’s premium rating to the sector average has collapsed in the past nine months, from being 5.5 percentage points ahead in November 2024 to 3.2 percentage points behind as at the beginning of August 2025, which we have shown in the chart below. Whilst looking at MRCH’s discount in isolation might suggest value, we think it looks even cheaper when considering its relative rating.

MRCH DISCOUNT VERSUS PEERS

Source: Morningstar

Another example is JPMorgan Asia Growth & Income (JAGI), which traded at a sustained premium early in the five-year period under consideration, whilst the sector average was at a discount. However, as both Asian and UK markets sold off in 2022 as interest rates rose to tackle inflation, and as China persisted with its zero-COVID policy, JAGI fell to a discount where it has remained since. The level of discount, though, is considerably wider than the peer group average, meaning the premium rating has all gone. This has actually widened even more in the near term, with JAGI’s discount currently six percentage points wider than the peer group average, versus a five-year average of 2.9 percentage points.

JAGI DISCOUNT VERSUS PEERS

Source: Morningstar

JAGI is one of a number of growth trusts that stand out in our analysis. This is a result of the changing investing backdrop and interest rate environment mentioned above. As a general rule, growth strategies perform better in lower interest rate environments but struggle in periods of higher rates. As such, many growth-focussed investment trusts now trade at discounts to their peer group, having previously traded at premium ratings earlier in the five-year period, contributing to them standing out in our analysis.

The corollary is that some value trusts that were previously trading at discounted ratings to the peer group have since recovered strongly to trade at premium ratings. One such example is Invesco Global Equity Income (IGET), which has a notable value tilt to it, as is expected of an income-focussed vehicle. The trust traded at a discount to NAV and to the sector average for much of the past five years. However, in 2025, this sharply reversed, with the trust swinging to a small premium and on a vastly better rating than the sector average. IGET absorbed the assets of the three other share classes of the Invesco Select trust during the period, and it is possible there was an overhang of stock that has now cleared. However, the near-term performance has also been very strong, which may well have contributed to its rerating. In its annual report, to 31/05/2025, the trust demonstrated a NAV TR of 11.9%, versus the MSCI World Index TR of 7.4%.

The recovery in the share price in this period is even stronger, at an impressive 24.6%. This demonstrates how closing discounts can significantly contribute to shareholder returns and why identifying discount anomalies can be useful.

IGET PREMIUM VERSUS PEERS

Source: Morningstar

Aiming for boundaries

With several growth trusts showing up as statistical anomalies in our analysis, it is worth looking into whether this could change in the future. Interest rates have remained higher and for longer than initially expected, but are slowly coming down, providing a more positive backdrop. Furthermore, there are good prospects for AI to become a dominant theme of the next few years, which would be supportive to the tech sector, which often makes up a large portion of growth portfolios.

The potential recovery of growth-focussed vehicles has been a factor behind recent changes to the portfolio of the CT Global Managed Portfolio Trust (CMPG/CMPI). CMPG/CMPI was managed by industry veteran Peter Hewitt. He has retired and handed over management duties to Adam Norris and Paul Green on 01/06/2025, although he continues to assist with a handover until October 2025. The trust is a fund of funds with two share classes, one focussed on growth and one on income. The strategy enables the managers to exploit the numerous opportunities in the investment companies universe, including the discount opportunities that exist at present. In the past 12 months, the managers added to strategies with growth exposure beyond AI, such as those focussed on the energy transition or biotech, with recent additions including Scottish Mortgage (SMT) and International Biotechnology (IBT). Growth trusts were a significant contributor to performance in the past year, with holdings in two tech trusts doing particularly well overall.

Should growth strategies stage a comeback, our analysis has identified several trusts that are trading not only at a discount to their own averages, but also on a low relative rating to their peers. Examples include Smithson (SSON), which currently trades at a discount of c. 10% (as at 07/08/2025), and 1.5 percentage points wider than the peer group average, despite historically trading at three percentage points narrower. Similarly, Montanaro European Smaller Companies (MTE) has a current discount of c. 8% with the current level about one percentage point wider than the peer group average, despite historically trading at a 2.8 percentage-point relative premium.

Umpire’s call

Whilst this statistical analysis has shone light on some interesting discount opportunities, it has also highlighted some other interesting relative ratings, albeit not those trading at discounts. One example is Ashoka India Equity (AIE). This small- and mid-cap focussed trust has delivered exceptional performance since its inception in 2018, which, when combined with other factors such as the managers’ skin in the game, has meant the trust has traded at a premium through much of its existence. By contrast, peers have traded at a fairly persistent discount, leaving AIE having a high relative premium rating that has averaged 13.6 percentage points over the past five years. In the past few months, though, this gap has closed significantly as two peers, in a sector of four, have had strong share price rallies. One of these is arguably related to a tender offer plus the implementation of a new policy. As such, AIE’s premium rating to peers has narrowed significantly to just 5.9 percentage points, meaning it looks very favourable taking our metrics in isolation. However, as AIE continues to trade at or above par, any mean reversion of the relative rating would have to come from its peers’ discounts widening. Given some improved performance and shareholder-friendly measures, we think there are reasons to doubt that.

AIE PREMIUM VERSUS PEERS

Source: Morningstar

And that’s over bowled

With that in mind, we believe examining a trust’s relative rating to its peer group’s can be a useful additional tool to help provide context for how a trust’s discount has evolved over time. As positivity begins to creep back into the market and investment trust sector, discounts have begun to narrow, meaning some of the heavily discounted opportunities may have gone. Whilst there remain many very attractive discount opportunities still available, using additional statistics such as our relative ratings could help investors uncover these less obvious opportunities, and lead to strong total returns should they also close and the market continue to recover after a challenging couple of years.

UKW

Results analysis: Greencoat UK Wind

UKW’s disposals have strengthened confidence in the NAV, with dividend cover remaining resilient.

David Brenchley

Updated 14 Aug 2025

Disclaimer

Disclosure – Non-Independent Marketing Communication

This is a non-independent marketing communication commissioned by Greencoat UK Wind (UKW). The report has not been prepared in accordance with legal requirements designed to promote the independence of investment research and is not subject to any prohibition on the dealing ahead of the dissemination of investment research.

  • Greencoat UK Wind’s (UKW) half-year results for the six months to 30/06/2025 saw the trust announce dividend cover of 1.4x for the first half, despite lower than budgeted wind generation. UKW’s target dividend per share stands at 10.35p for the full-year 2025, up 3.5% from 10p in 2024 and equates to a yield of c. 8.7 % on the current share price. The net asset value (NAV) per share fell c. 5.2% to 143.4p, due primarily to lower-than-budgeted cash generation and a reduction in forecast power prices.
  • During the six-month period, UKW declared total dividends of 5.18p per share, including a 2.5p per share payment with respect to Q4 2024. The dividend is a key plank of UKW’s total return proposition, and the trust has now paid £1.3 billion in dividends to shareholders over its 12-year life, almost half of its current market capitalisation of c. 2.7 billion. In addition, UKW has generated £1bn of excess cash flow which has been re-invested in the company. UKW’s average dividend cover over its life is 1.8x.
  • UKW generated £163 million in net cash in the six months to 30/06/2025, down c. 1.3% from the £165.4 million generated in the six months to 30/06/2024. Despite the fall in NAV, UKW has provided a total shareholder return of 140.7% since listing in 2013, or 7.4% annualised, the highest in its peer group. UKW aims to provide a 10% return to investors on NAV, net of all costs.
  • On capital allocation, UKW reinvested £40 million to buy back its own shares during the period, which added 0.6p per share to the NAV. It has currently completed £131 million of share buybacks in total, at an average price of 130p per share. The trust’s second buyback programme, which was announced in February, provides for at least a further £69 million in cash to be allocated to share buybacks.
  • Excess cashflow beyond that is likely to be applied to a reduction in UKW’s gearing. Aggregate group debt was c. £2.25bn as at 30/06/2025, equivalent to 41.5% of gross asset value (GAV), or c. 71% of NAV. The weighted cost of debt was 4.59% across a range of maturity dates (November 2026 to March 2036).
  • UKW’s capital allocation is supported by the announced partial disposal of three assets (Andershaw, Bishopthorpe and Hornsea 1) for £181 million. All assets were sold at NAV, and cumulative disposals now total £222 million.
  • In total, UKW’s collection of 49 wind farm investments generated 2,581GWh of renewable electricity in that six-month period, an equivalent amount to power approximately 2.2m homes. This was c. 14% below budget, owing to low levels of wind that have been experienced across the industry. As at 30/06/2025, UKW’s portfolio powers 2.2 million homes in the UK and avoids the emissions of 2.4 million tonnes of CO2 per annum.
  • Lucinda Riches, chairman of UKW, commented on capital allocation remaining a key focus, saying: “In the medium term, we can see the significant need for capital in the sector and expect that this should provide investment opportunities that surpass the returns afforded by share buybacks and de-gearing, especially when viewed over a longer-term horizon. The Board and Investment Manager continue to evaluate suitable investments and will remain strategically opportunistic.”

Kepler View

In our view, there are two key considerations when looking at near-term updates for long-term assets such as those owned by Greencoat UK Wind (UKW); the validity of the valuation and resilience of the income. With that in mind, these results contain several positives shareholders, such as a number of disposals at NAV and robust cash generation leading to solid dividend cover that supports a yield of over 8%.

That being said, there have been some challenges in the year, most notably through low wind speeds impacting generation. Furthermore, broader power price forecasts fell, over both the near-term and long-term. Both of these factors have led to downward pressure on NAV and cash generation. However, these are external factors that are broadly out of the control of the managers. Wind generation is a key input, although can fluctuate, and power prices have been volatile in the past few years due to macro factors. Demonstrating this recently, in the post results period, near term spot prices have picked up again which will have a positive impact on the next NAV should things stabilise here.

Despite the impact of these external factors, UKW has still paid dividends in the period that are an increase of 3.5% on the same period last year. These were comfortably covered by net income 1.4x, which, whilst down on the previous period, still represents solid cover in our view. What we believe is particularly encouraging from a shareholder’s perspective are decreases in line items such as finance costs and management fees which have helped support the net cash generation figure, reflecting the reduction in gearing and change to policy respectively in the past few months. These are factors within the trust’s control, demonstrating that, despite the external challenges the trust faced, it has pulled at the levers it has in order to maintain income stability.

The managers have also made many strides in realising capital through over £200m of disposals, all of which have been made at their latest valuation. Ultimately, valuing assets such as these involves some element of estimation, and therefore, these transactions provide crucial, real-world evidence that private asset buyers are not seeing the discount in the valuation of these asset manifest in UKW’s share price. This in turn gives confidence in UKW’s NAV in our view. Furthermore, some of the proceeds of these disposals have been put towards reducing gearing. This has not only supported the cash generation and therefore dividend cover, as mentioned above, but also further de-risked the trust. In a backdrop of higher-for-longer interest rates, we believe this should add reassurance.

Ultimately, whilst these results have seen some important metrics be impacted, the fact the trust remains resilient is a testament to the simplicity of the approach in the first place, and how much margin of safety was built into the model. And whilst the NAV and dividend cover have fallen, we believe the current discount of c. 18 % more than accounts for this, with a yield of over 8% also considerable compensation for those who hold the long-term performance of the trust in mind

DYOR ETF’s

All higher risk ETF’S, so maybe best to be pair traded with another ‘safer’ yielding Trust.

Dividends can change so check the blended yield figure before you hit the buy button.

Navel gazing

Sorry, that’s a different topic.

The Snowball will achieve it’s income fcast for this year of £9,180.

A yield of 9.2% on seed capital.

The comparison share using the 4% rule VWRP £141,553. Not shabby and maybe one to consider when the next market sell off happens.

Using the 4% rule a comparison income of £5,662

Remember it’s the end destination for you plan this is the most important for your retirement. Investor or gambler ? The choice my friend is yours. GL

10 best-selling investment trusts on Fidelity Personal Investing in July

Published 6 August 2025

Richard Evans

Fidelity International

Important information – the value of investments and the income from them can go down as well as up, so you may get back less than you invest.

Green energy has suddenly started to appeal to Fidelity’s investment trust customers. Three trusts that invest in renewable electricity generation – solar and wind farms – appeared in our top 10 list of most-bought listed funds in July. None of the three had previously featured on our best-seller list so far this year.

The three trusts are The Renewables Infrastructure Group (TRIG)Foresight Solar Fund and Bluefield Solar Income Fund. They were respectively the fourth, sixth and seventh most popular listed funds among our customers last month. TRIG is predominantly a wind farm investor (83% of its assets are in wind assets) while Foresight Solar and Bluefield Solar, as you would expect, concentrate on solar farms, although both have a small amount of their money in energy storage assets.

Other green energy trusts to have featured in our top 10 lists so far this year have included Greencoat UK Wind in January and February and GCP Infrastructure Investments (largely a debt fund, with 59% exposure to renewable energy) in April.

We can see no obvious reason for this sudden increase in interest in green energy other than perhaps greater appreciation of these trusts’ yields at a time of falling interest rates. TRIG, Foresight Solar and Bluefield Solar yield 7%, 7.4% and 7.4% respectively while the Bank of England’s official rate has already fallen from a peak of 5.25% in summer last year to 4.25% currently and is widely expected to be cut again to 4% tomorrow. Not only do such declines in the interest rates payable on cash make the trusts’ yields more appealing on a relative basis but they tend to drive increases in the share prices of income-generating trusts as money shifts away from cash.

The one infrastructure trust to feature in Fidelity’s Select 50 list of favourite funds, International Public Partnerships (INPP), which was the eighth most bought investment trust by our customers in July (and June), does not own electricity generation assets, although it has some exposure to electricity transmission.

Away from green energy, the most popular trust in July was again Fidelity Special Values, which has enjoyed a strong run this year. Its share price has risen by 20.8% in 2025, compared with 12.1% for the FTSE 100 index. Please note past performance is not a reliable indicator of future results.

In second place, for the third month in a row, was Scottish Mortgage. It has recovered well since a slump in early April as sentiment collapsed in the wake of the ‘liberation day’ announcement of new American tariffs. From a low of 815p on 7 April the share price has now risen to £10.77. Shares in Polar Capital Technology, in third place in our July top 10, have followed a very similar trajectory.

After TRIG in fourth place came City of London, a perennial favourite thanks to its yield (currently 4.4%, not guaranteed) and unparalleled record of annual dividend increases. In the next three places were the two solar funds and INPP, followed by Fidelity China Special Situations at ninth and JPMorgan Global Growth & Income bringing up the rear.

Top 10 best-selling investment trusts on Fidelity Personal Investing in July 2025:

  1. Fidelity Special Values
  2. Scottish Mortgage
  3. Polar Capital Technology Trust
  4. The Renewables Infrastructure Group
  5. City of London
  6. Foresight Solar Fund
  7. Bluefield Solar Income Fund
  8. International Public Partnerships
  9. Fidelity China Special Situations
  10. JPMorgan Global Growth & Income

High-yielding renewable energy trusts

3 popular high-yielding renewable energy trusts

Published 21 August 2025

Nick Sudbury

Investment writer

Important information – the value of investments and the income from them can go down as well as up, so you may get back less than you invest.

Investment trusts that provide exposure to renewable energy projects such as solar and wind farms have been out of favour for several years, so it was interesting to see that three of these trusts were among the best-sellers on the Fidelity Personal Investing platform in July. This was the first time that these particular funds had featured in the year-to-date numbers. 

The renewable energy sector is known for its high yields, which are often in excess of 7%, but the attractiveness of these income streams was undermined by the sharp rise in interest rates after the pandemic. Please note these yields are not guaranteed. It is likely that investors are being tempted back ahead of further possible rate cuts by the Bank of England.

The Renewables Infrastructure Group

In fourth place on the list of bestsellers was the two billion pound Renewables Infrastructure Group, which owns a diversified portfolio of wind farms and solar parks in the UK and Europe. These generate revenues from the sale of electricity and government-backed green benefits.

The trust aims to provide investors with long-term, stable dividends and to retain the portfolio’s capital value through re-investment of surplus cash flows. Its management has a total return focus, although much of this is in the form of dividends, with the target distribution of 7.55 pence for 2025 giving the shares a prospective yield of 9.2%.1 Please note this is not guaranteed.

As with all of these sorts of funds, the net asset value (NAV) calculation is extremely complicated with lots of assumptions so they only tend to be updated on a quarterly basis. The end of June figure of 108.2p suggests that the shares are available at a discount of around 24%, despite the active buyback programme.

Foresight Solar Fund

Sixth on the list was the £484m Foresight Solar Fund that owns a portfolio of solar farms and battery storage assets in the UK and overseas. It aims to provide investors with a sustainable, progressive quarterly dividend and enhanced capital value, whilst facilitating the transition to a lower-carbon economy.

Foresight’s target dividend for 2025 is 8.1 pence, giving the trust a prospective yield of 9.4%.3 Please note this is not guaranteed. At the end of June the NAV was 108.5p, which equates to a discount of around 20%, although there is an active share buyback programme that has recently been increased to £60m.

The Board is trying to sell its Australian wind farms and intends to use the proceeds to reduce the level of gearing (debt to equity ratio) that currently stands at 40%. However, no bids have been received at time of writing.

Bluefield Solar Income

In seventh position was the £568m Bluefield Solar Income whose main asset is a portfolio of solar farms located in the UK. It aims to provide shareholders with an attractive return, principally in the form of quarterly distributions, with the target dividend for the 2024/25 financial year of not less than 8.90p giving the shares a prospective yield of 9.3%.

Bluefield’s latest available NAV at the end of June was 117.8p, which implies a discount of 19%. The Board is exploring strategic options to address this and maximise shareholder value.

One important feature that differentiates it from its peers is the significant pipeline of development assets identified by the Investment Advisor that provide a future platform for growth. Another is the strategic partnership with a group of UK pension funds, which gives Bluefield a means of recycling capital from its existing projects. 

Across the pond

3 Massive Unloved Dividends up to 16%

Brett Owens, Chief Investment Strategist
Updated: August 22, 2025

Let’s talk about three dividends averaging 12%. I bring them up because everyone on Wall Street hates them.

This is notable because the suits are paid to be bullish. Sell calls are rare, especially among S&P 500 stocks. In fact, analysts shun just one index component today!

Just 1 “Sell” Call Out of 500!

Source: S&P Global Market Intelligence

Buy calls? They are numerous—405 out of 500. Eighty-one percent!

Are 81% of the companies in the S&P 500 really buys? Normally, no, but now—especially not. AI is disrupting business models and many of these Buy-rated names are doomed companies.

Here’s another problem with Buy ratings—there is no room for improvement. Sells are better. They set the stage for upgrades! And it doesn’t take much for analysts to flip a stock from a Sell to a Buy.

Which is why savvy contrarians dig through the Sell bin.

Today we’ll discuss three hated names yielding from 6.1% to 15.7%. Before getting to those, let’s use Prospect Capital (PSEC, 18.7% yield), as a cautionary tale and highlight the difference between being contrarian and being foolish.

PSEC is a business development company (BDC) that provides capital to middle-market companies, primarily through first lien and other secured debt. It has a diverse portfolio of 114 companies across 33 industries. And it’s one of the largest BDCs at well more than $1 billion in market cap.

But despite being a monthly dividend payer with a yield that could be confused for a credit card APR, and despite being the cheapest BDC on the market, Wall Street can’t find a reason to like it. It has just two covering analysts, and only one of them has a rating on the stock (Sell, unsurprisingly). While that smacks of too small a sample size, the lack of coverage itself is telling. Research firms would prefer not to bite the hands that provide them with access, to the point where many would choose to temporarily stop covering a company over calling a spade a spade.

Why the lack of love? Among other reasons, how about three dividend cuts in the past decade, including a 25% reduction less than a year ago.

BDCs as a Whole Haven’t Set the World on Fire, But at Least They’re Not All PSEC

All right. What about a BDC with a slightly less bearish camp? BlackRock TCP Capital Corp. (TCPC, 15.7% yield) is technically a consensus Sell call, but the majority of analysts covering it say it’s a Hold. So at least as far as pro ratings go, it’s not a disaster.

TCPC is a middle-market lender that prefers companies with enterprise values of between $100 million and $1.5 billion. It currently boasts more than 150 portfolio companies across 20 different industries, and its deal mix is heaviest (82%) in first-lien debt, and the vast majority (94%) of its lending is floating-rate in nature.

The case for BlackRock TCP Capital Corp. is BlackRock. The BDC is externally managed by a BlackRock subsidiary, which gives it access to BlackRock resources. In theory, that should make TCPC competitive.

In Practice, It Doesn’t

Again, the pros likely have a legitimate case here. TCPC is in the process of restructuring deals amid credit issues in the portfolio, and management fees have been waived to make up for some of the financial slack. The dividend—which BlackRock TPC cut earlier this year, just a few months after I flagged the potentially brewing trouble in its distribution—isn’t necessarily at risk yet, but it bears watching if portfolio losses continue.

Hated BDCs might be asking for it. Let’s look at other high-yield acronyms instead.

Cheniere Energy Partners LP (CQP, 6.1% yield) is a midstream subsidiary of Cheniere Energy (LNG). It owns the Sabine Pass LNG (liquefied natural gas) terminal in Louisiana, which includes natural gas liquefaction facilities and regasification facilities. It also owns the Creole Trail Pipelines, which connects the Sabine Pass terminal with inter- and intrastate pipelines.

Cheniere Partners owns the Sabine Pass LNG terminal located in Cameron Parish, Louisiana, which has natural gas liquefaction facilities with a total production capacity of over 30 mtpa of LNG. The Sabine Pass LNG terminal also has operational regasification facilities that include five LNG storage tanks, vaporizers, and three marine berths. Cheniere Partners also owns a Corpus Christi liquefaction facility and a connected pipeline, as well as Creole Trail Pipeline, which interconnects the Sabine Pass LNG terminal with a number of large interstate and intrastate pipelines.

CQP is pouring itself into expansions at its Sabine Pass and Corpus Christi facilities—big capital outlays that required Cheniere to reduce its variable distribution in 2024. That payout came up a smidge earlier this year, however, and the company’s underperformance last year has turned into more respectable performance this year.

Shares Stabilizing as Cheniere Builds Toward the Future

There’s no telling what the master limited partnership (MLP) will do in the short term as its various project details are fleshed out. But if these projects do bear fruit, CQP could be looking at a potential explosion of distributable cash flow (DCF) generation a few years down the road.

How about a real estate investment trust (REIT)?

Innovative Industrial Properties (IIPR, 14.4% yield), a REIT tied to the marijuana industry, is what I call a “bearish Hold.” Most of the pros say it’s a Hold or a Sell, but a lone Buy call raises its consensus average.

Still, Wall Street really doesn’t like this stock—a massive change of fortune to a stock that over the past decade has been among both the sector’s biggest success stories and its biggest flops.

One Ticker, But Two Totally Different Stocks Since 2016

IIPR provides capital for the regulated cannabis industry through a sale-leaseback program. It buys freestanding industrial and retail properties (most of which are marijuana growth facilities) from cannabis operators, then leases them right back to the sellers. This provides cannabis operators with much-needed influxes of cash that they can use to expand their operations, and provides the REIT with ongoing cash flow. Currently, IIPR owns 108 properties in 19 states, representing nearly 9 million square feet, which it leases out to 36 tenants.

It’s not like Innovative Industrial Properties has operationally reverted to where it was 10 years ago—not even close. The company went public in 2016 and generated negative $7.5 million in funds from operations (FFO). It has cleared $210 million in FFO in each of the past three years, including $231 million in 2023 and $230 million in 2024.

However, the stock exploded even more than the business did, and the past few years have seen shares come back to earth. And everything’s not exactly rosy in the core business, which still is dealing with a cracked, state-by-state regulatory environment. That’s a big reason why IIPR recently invested $270 million into IQHQ, a life science real estate platform with more than $2 billion in assets—a move that could provide much-needed stability and growth.

It’s worth noting, however, that FFO has been declining significantly over the past few quarters, driving its adjusted FFO payout ratio to nearly 95%; that’s uncomfortably higher than the 85% ratio IIPR averaged between 2017 and 2024.

Avoid the Retirement ‘Death Spiral’: Collect 8% or More for Life

Most retirement investors wouldn’t go near many of these stocks in the first place because they’re outside their safety zone.

You know the drill. Buy blue chips and bonds. Dollar-cost average in. Slow and steady wins the race.

Unfortunately, if you’ve saved and invested “by the book,” you’re already behind—and all it might take to realize that is one poorly timed downturn in retirement.

That could force you to sell a much bigger chunk of your portfolio to withdraw the income you need to pay the bills, and suddenly, you’re way behind the 8-ball for the rest of your post-career years.

But you can avoid the retirement “death spiral” by making sure you live on dividends alone so you never have to touch your capital.

My 8% “No Withdrawal” Retirement Portfolio can do just that: produce a high level of income (without the big question marks posed by the likes of PSEC and IIPR) that allows you to retire on dividend and interest income alone. That means never touching a penny of your nest egg.

Dividend Hunter

The ONE Thing You Must Remember

If I could leave you with just one nugget of investing wisdom today, it would be to NEVER overlook the incredible wealth-building power of dividends.

Few investors realize how important these unglamorous workhorses actually are.

Here’s a perfect example…

If you put $1,000 in the dividend-paying stocks of the S&P 500 back in 1973, you would have had $87,560 by 2023, or 87x your money.

But the same $1,000 in the non-dividend payers would have grown to just $8,430 — 90% less.

That’s why I’m a dividend fan.

The stock market is a fantastic wealth-building machine, but it doesn’t always go straight up!

There have been plenty of 10-year periods where the only money investors made was in dividends.

And that’s what gives us dividend investors such an edge.

When you lock in an 8%+ yield, you’re booking an income stream that’s bigger than the stock market’s long-term average return right off the bat.

Of course you can’t just buy every ticker symbol out there with a flashy yield, or you’ll get burned pretty fast.

So let’s wipe the false promises of mainstream finance from our minds and start thinking the “No Withdrawal” way…

Step 1: Forget “Buy and Hope” Investing

Most half-million-dollar stashes are piled into “America’s ticker” SPY.

The SPDR S&P 500 ETF (SPY) is the most popular symbol in the land. For many 401(K)’s, this is all there is.

And that’s sad for two reasons.

First, SPY yields just 1.2%. That’s $6,000 per year on $500K invested… poverty level stuff.

Second, consider 2022 for a moment (and only a moment, I promise!).

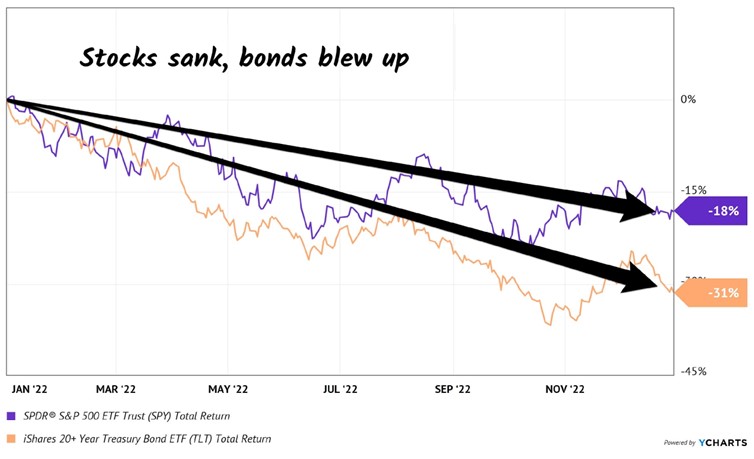
SPY was down nearly 20% that year. That is no bueno, because that $500K would have been reduced to $400K.

The last thing we want to do is lose the money we’re getting in dividends (or more) to losses in the share price. Which is why we must protect our capital at all costs.

Step 2: Ditch 60/40, Too

The 60/40 portfolio has been exposed as senseless.

Retirees were sold a bill of goods when promised that a 60% slice of stocks and 40% of bonds would somehow be a “safe mix” that would not drop together.

Oops.

Inflation — plus an aggressive Federal Reserve, plus a (thus far) persistently steady economy — drop-kicked equities and fixed income before they went on a serious bull run in 2023 and 2024.

It just goes to show that bonds are not the haven guaranteed by the 60/40 high priests. They could easily plunge just as hard (or harder) than stocks in the next economic crisis.

Just like they did in 2022 (sorry, we’re only going to spend one more second on that disaster of a year). US Treasuries plunged, which resulted in the iShares 20+ Year Treasury Bond ETF (TLT) getting tagged.

Sure, it still paid its dividend. But even including payouts, the fund was down 31% — worse than the S&P 500. Ouch!

When stocks and bonds are dicey, where do we turn? To a better bet.

A strategy to retire on dividends alone that leaves that beautiful pile of cash untouched.

Contriain Investor

High or low coupon gilts?

Benstead on Bonds: are long gilts at 5.5% a no-brainer?

Some gilt yields are at their highest since the late 1990s, but should you invest?

20th August 2025 09:18

by Sam Benstead from interactive investor

If someone offered you a guaranteed annual return of 5.5%, locked in for the next 20 to 30 years, would you take it?

Well, that’s what investors can get today if they put money into long-maturity gilts. The latest data puts gilts maturing in 20 years’ time at a yield-to-maturity (YTM) of 5.5%, 25 years at 5.6% and 30 years at 5.6%.

The YTM figure assumes that coupons are reinvested and accounts for both capital and income, giving a pretty accurate estimation of annualised returns over the life of a bond.

And this yield figure is high! For comparison, 20-year government bonds in France are at 4%, Germany at 3.2% and Japan at 2.6%. It’s generally only emerging markets that yield more, and long gilt yields have not been this high since the late 1990s.

Moreover, a way of looking at the value of government bond yields is to assess the “spread”, or excess yield, that you get from owning corporate bonds. For sterling bonds, this is a little under 1%, which is historically low. This means corporate bonds are poor value compared to government bonds, because why would you take on the extra risk for just 1 percentage point of extra yield?

When I say “guaranteed” return from gilts, I am assuming that the British government does not default given that it never has before. While this admittedly does feel increasingly possible, gilts are still as close to being risk-free as investment markets can offer, at least in terms of getting your money back and collecting the two coupons per year.

But there are some other risks with a buy-and-hold gilts strategy. The biggest in my view is inflation – if prices rise at 4% a year for 20 years and your gilt pays you 5.5%, then you are only really increasing your wealth by 1.5% a year, which isn’t much. For comparison, UBS calculates that since 1900, US shares have made on average 8.4% “real”, meaning that they have made 8.4% ahead of the inflation rate over that period. The figure for UK equities is 7.1%.

Inflation in the UK is currently 3.8% and expected to hit 4% in September, before falling back to the Bank of England’s 2% target at the end next year or in early 2027. While it may return to 2% and stay there, there are no guarantees. One useful indicator of where investors think inflation will be is to look at the yield offered on index-linked gilts, which pay a return ahead of the RPI inflation rate.

A 20-year index-linked gilt currently has a yield of 2.4%, according to Tradeweb, which suggests that RPI will be about 3% a year over the next 20 years, based on the difference in yield between a 20-year inflation-linked gilt and a 20-year regular gilt. For investors worried about inflation, and who think it will be above this figure and are eventually proved right, the index-linked option could make a better investment.

While gilt returns are (nearly) guaranteed, investors must be aware that gilt prices will fluctuate a lot, particularly those that mature in 20 to 30 years. On their way to return £100 per gilt owed to the holder on maturity, prices will move due to changes in market conditions.

Say you own the TG50 (UNITED KINGDOM 0.625 22/10/2050 

TG50

0.49%

 gilt, maturing in 25 years’ time. The price today is £35 and on 22 October 2050 it will mature and pay the owner £100. Along the way, 62.5p in coupons are paid each year. Taken together, the YTM is 5.4% annualised.

However, that 5.4% yield may become too generous or too dear depending on what happens in markets.

For example, if interest rates shoot up, then bond prices will have to fall so that yields will come into line with market prices. This would mean a big paper loss for gilts.

And a big jump in yields is definitely possible. Peter Spiller, manager of Capital Gearing Ordinary investment trust for more than 40 years, sees lots of risks ahead for gilts, especially longer maturity ones, where prices are sensitive to the creditworthiness of the UK government.

He says: “One of the most significant issues facing this government is rising interest costs against a backdrop of spiralling debt.

“The behaviour of yields on long-term gilts – the government’s cost of finance, a proxy for market confidence in public finances – suggests a fear that fiscal dominance, where interest rates are dictated by the budgetary needs of government, is a real threat.”

Jason Borbora-Sheen, a fixed-income portfolio manager at Ninety One, says that very few investors really have a time horizon long enough to hold 30-year gilts until maturity, and that the sweet spot for investors looking at gilts is normally below 10 years. His view is that there is a lot of risk in longer-term gilts and investors are better served at the shorter end of the yield curve.

He said: “The UK has a reliance on external funding and is in a poor financial position, which makes long gilts a risk proposition. Any duress in fixed-income markets will be felt hardest in these long gilts.”

So, while investors know that they will get £100 back per gilt owed, they could see their gilts drop in value over their life, which although not a financial problem if there is no need to sell, will definitely not feel great, especially if it’s a large position. On the other hand, long-term gilts could rise in value, giving holders a big paper gain. 

High or low coupon gilts?

It is important to look at the size of the coupon as well if considering a long-maturity gilt. If the coupon is in line with today’s yield of around 5.5%, then the gilt will trade at around its £100 redemption value. This means that the return will come from coupons and not capital gains, which may suit investors better if they want to generate a reliable annual income from their investment.

On the other hand, if the return predominantly comes from capital gains (which are tax free outside an ISA and SIPP), then the pull to par (the £100 redemption value) is what can make up the bulk of returns. Gilts that have coupons below the market yield today will trade at a discount to the redemption value, which means that capital gains will form part of the return. The lower the coupon, the lower more impact capital growth will have.

Because this tax break is well known, it has pulled lots of capital into low-coupon gilts compared with higher coupon gilts maturing at a similar time, which has had the effect of lowering yields.

If you’re looking at long gilts, then here are some popular ones that could be researched further. I’ve included a selection of high and low coupon gilts.

GiltMaturityCouponPriceYield-to-maturity (%)
4½% Treasury Gilt 2042 T420.25%20424.5£91.305.28
UNITED KINGDOM 4.375 31/07/2054 T540.34%20544.375£81.195.55
4¼% Treasury Gilt 2049 T490.36%20494.25£83.465.49
4% Treasury Gilt 2060 TR600.38%20604£76.795.5
UNITED KINGDOM 0.625 22/10/2050 TG500.49%20500.625£34.905.39
UNITED KINGDOM 0.5 22/10/2061 TG610.72%20610.5£24.525.1
Source: interactive investor/Tradeweb, 18 August 2025. 

RGL

Regional REIT Ltd – real estate investment trust – Shore Capital says the company is “positioned to rebuild value creation for shareholders through a series of actions including capital investment to upgrade core assets and either repurpose or dispose of non-core assets”. In a trading update in May, Regional REIT had announced continuous positive leasing momentum in the first quarter of 2025 as rent collections “remained strong”. It had cited an emerging supply and demand imbalance outside of London for office space. Shore says: “A recent survey from Savills also paints a more optimistic picture for regional offices with improving take-up, reduced new supply and more high quality refurbished existing space coming onto the market expected to drive improved rents.” Shore adds: “Regional REIT is now a business in robust strategic shape and with management initiatives expected to drive both improvement in earnings and net tangible assets over the next three years that should improve the investment case.” Regional REIT will publish its results for the first half of 2025 on September 9.

« Older posts Newer posts »

© 2025 Passive Income

Theme by Anders NorenUp ↑