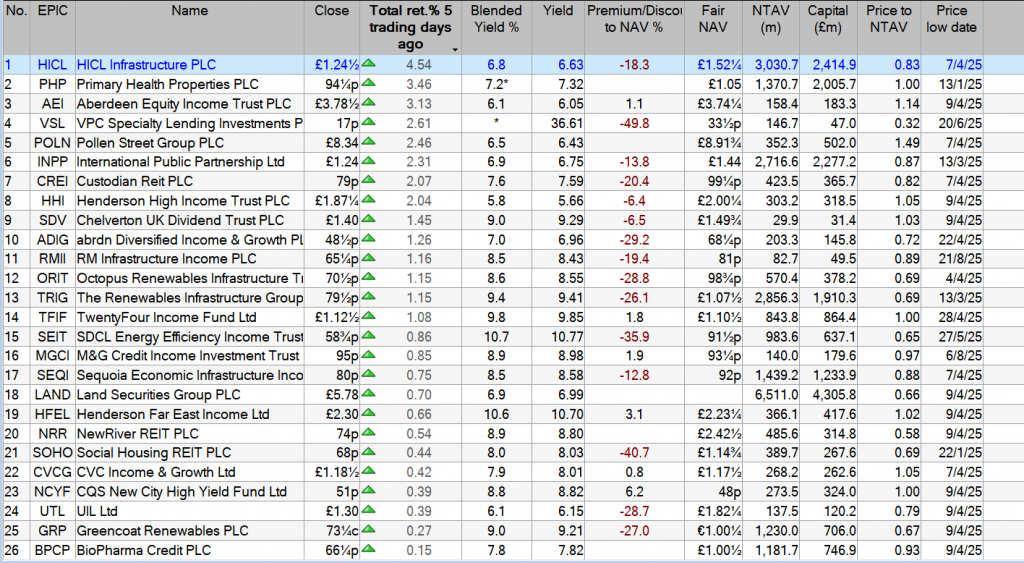
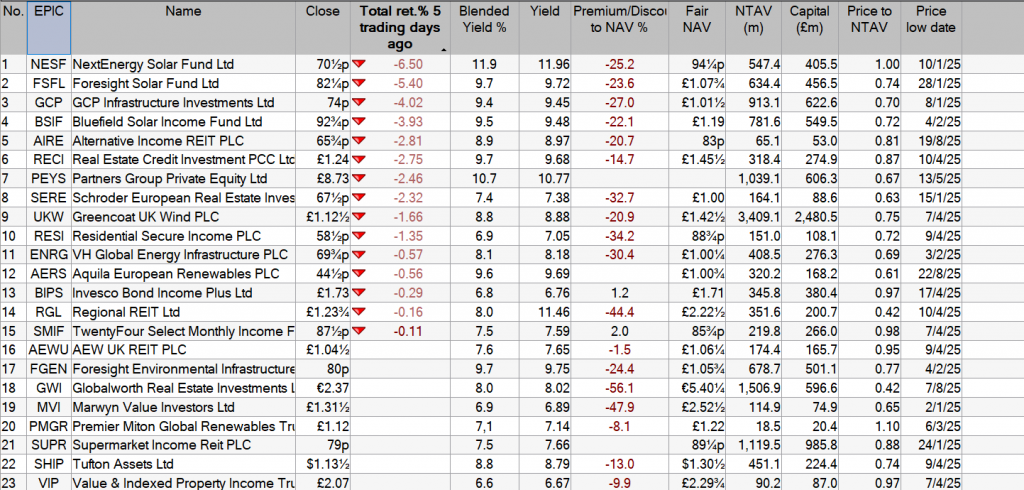
Investment Trust Dividends
Harvey Jones shows how it’s possible to turn a relatively small sum into a £1m pension pot by purchasing FTSE 100 stocks inside a SIPP.
Posted by
Harvey Jones
Published 22 August

When investing, your capital is at risk. The value of your investments can go down as well as up and you may get back less than you put in.
Building a Self-Invested Personal Pension (SIPP) worth £1m sounds like a dream, but it’s not beyond reach for patient investors who start early. A SIPP lets money grow free of tax, and with time and regular contributions, it can build into a life-changing sum.
Let’s imagine a 35-year-old has just transferred £25,000 from legacy pensions or other savings into a new SIPP. They aim to stop working at 67, which gives them 32 years for their investments to compound. If their initial £25k grew at 8% a year, roughly the long-term average total return from the FTSE 100, and with all dividends reinvested, the money would rise to £293,427 by retirement without a single extra contribution.
That shows the power of compound growth. But while nearly £300,000 is a tidy sum, it won’t be enough to fund a comfortable retirement three decades from now. Someone starting with £25,000 at 35 has a solid beginning, but they’ll need to pick up the pace to reach their £1m goal.
To hit that seven-figure milestone, our investor would need to contribute £450 a month. That might look daunting for someone juggling the financial responsibilities of midlife, but pension tax relief helps soften the blow. That £450 will only cost a 40% taxpayer £270, which shows why SIPPs are such an efficient long-term vehicle.
Please note that tax treatment depends on the individual circumstances of each client and may be subject to change in future. The content in this article is provided for information purposes only. It is not intended to be, neither does it constitute, any form of tax advice. Readers are responsible for carrying out their own due diligence and for obtaining professional advice before making any investment decisions.
I’d also suggest increasing contributions gradually over the years to accelerate growth. Personally, I prefer to buy individual shares rather than simply tracking the index, as that gives me a shot at delivering a superior performance. There are risks, but I reduce those by investing in a well-diversified mix of around 15-20 blue-chip stocks.
Building a £1m retirement pot takes time, discipline and a willingness to stick with the plan through good markets and bad. The earlier investors start, the easier the journey becomes. With regular saving, smart stock selection and plenty of patience, the end result could transform life in later years.
And you know what? It can also be fun.

Aug. 16, 2025 Realty Income Corporation

Realty Income (NYSE:O), or the monthly dividend company, was recently released as our contrarian investment pick based on diverse and reliable cash flow. The company’s earnings, recently released, indicate a continued ability to source valuable transactions, which as we’ll see in this article, make the company a valuable investment as rates are expected to decline.
The company is one of the largest REITs with impressive global operations.
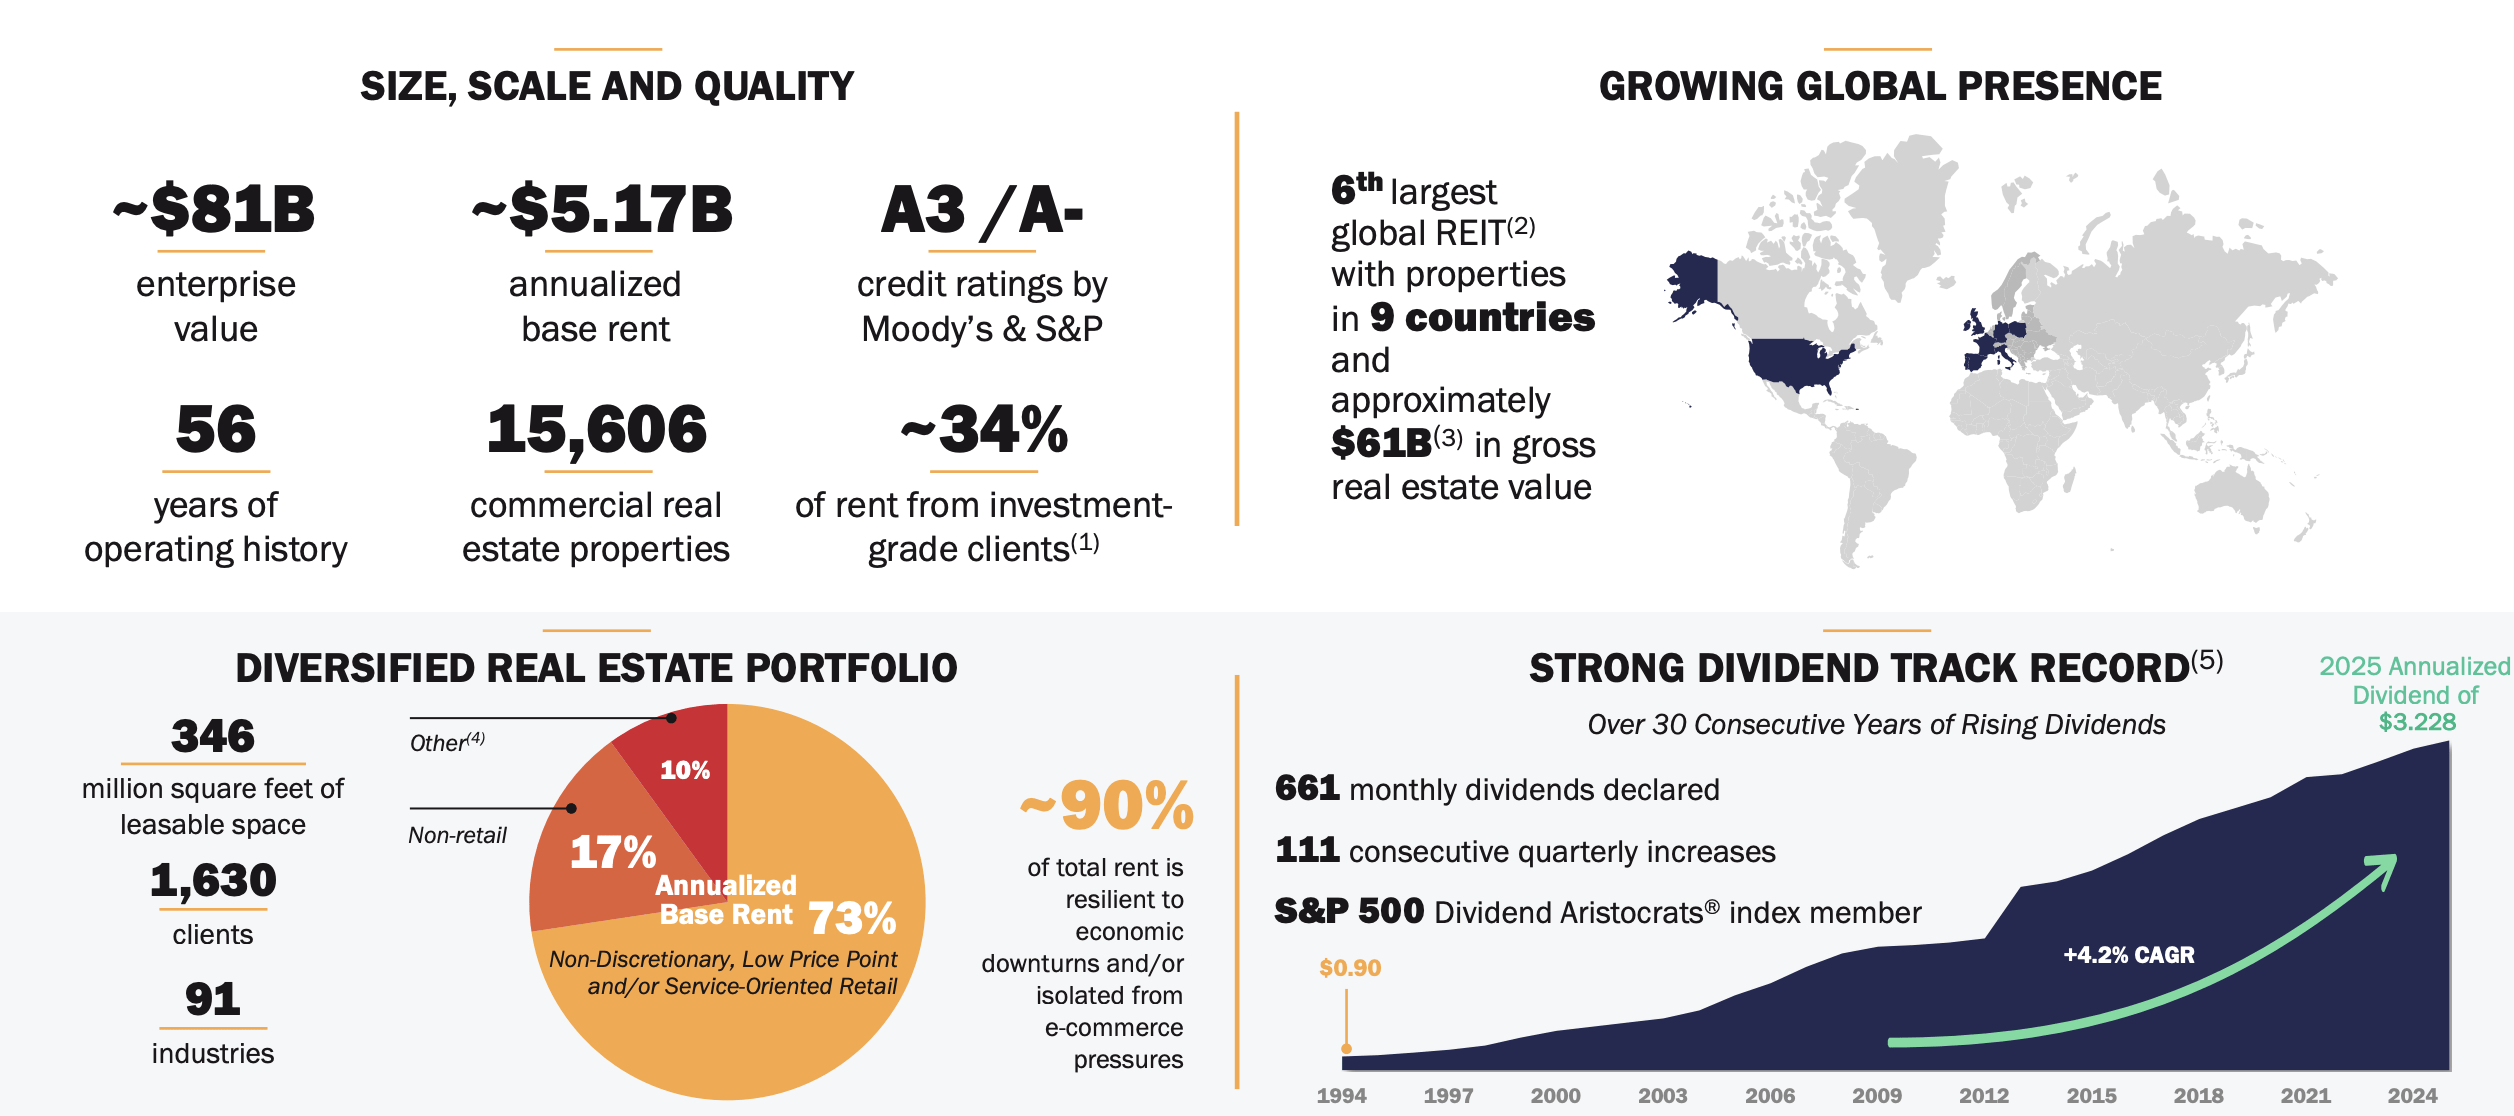
The company has more than 50 years of operating history with a ~$81 billion enterprise value and more than $5 billion in annualized base rent. Versus its market cap, that’s an almost 10% annualized based rent yield. The company’s business is spread across an incredibly high credit rating due to investment grade clients and more than 15 thousand commercial real-estate properties.
The company is known as the monthly dividend company with 111 consecutive quarterly dividend increases and 661 monthly dividends at a 4.2% annualized dividend yield. It’s a strong history of dividends from a diversified history.
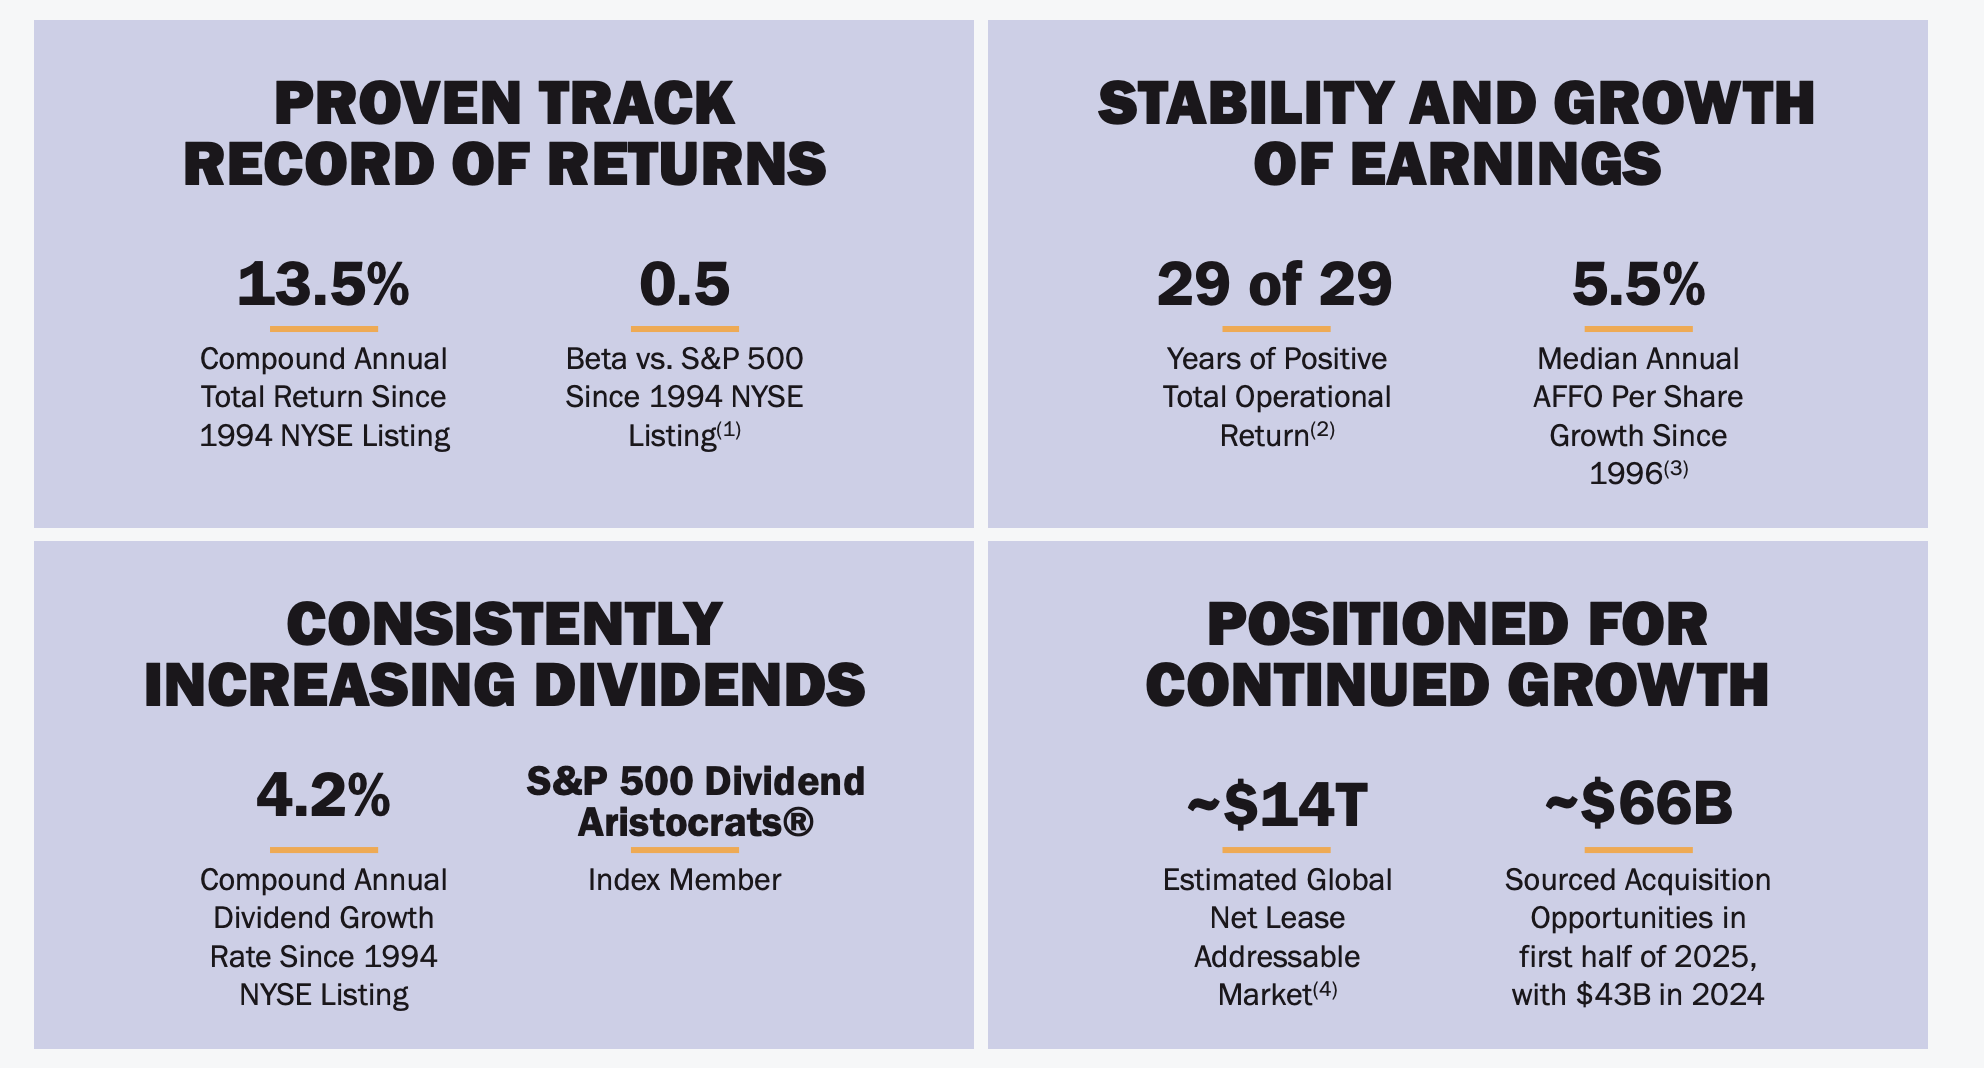
The company has returned 13.5% compounded annually since its NYSE listing with minimal volatility. Realty Income has managed to grow its median annual AFFO by 5.5% driving this, making the company a member of the S&P 500 dividend aristocrats. More importantly, the company has a massive addressable market versus its size.
The company’s estimated addressable market is ~$14 trillion, giving it continued room to grow despite its immense size.
Breaking out the specifics of its 2Q results, the company generated strong results.
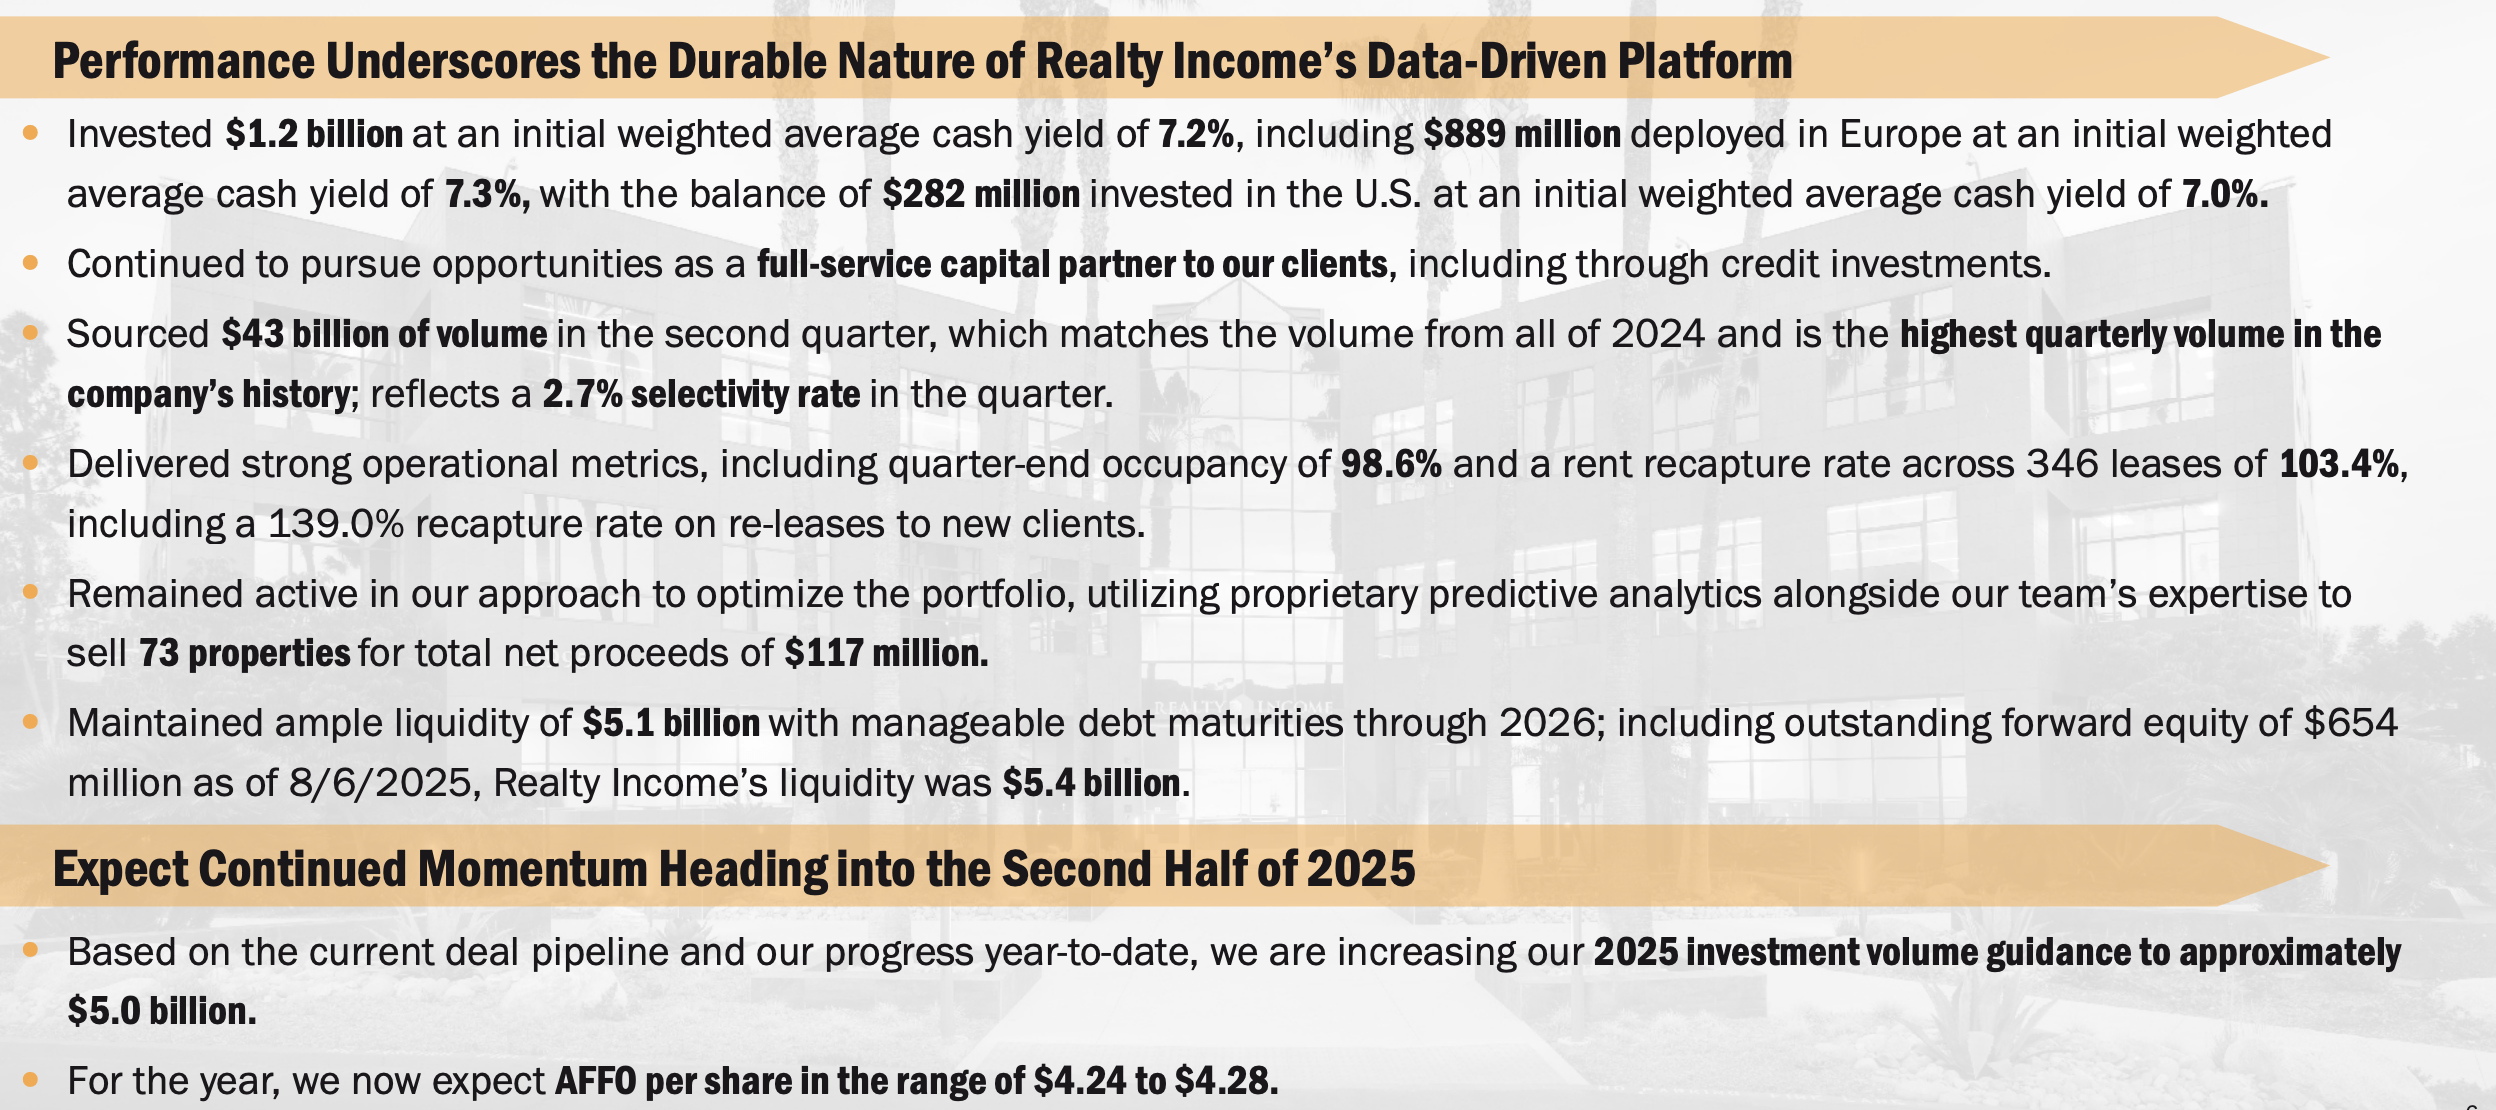
The company invested $1.2 billion in the quarter at an average 7.2% cash yield taking advantage of higher interest rates that enable it to lock in higher returns. Realty Income sourced $43 billion in volume, which shows that, despite its massive scale, it could maintain a 2.7% selectivity rate with 98.6% occupancy.
O had a 103.4% rent recapture rate, showing its ability to raise rents with higher inflation rates, and it’s continued to optimize its portfolio. Going into the 2H, the company expects to find additional investments with ~$5 billion in volume and ~$4.26 in AFFO.
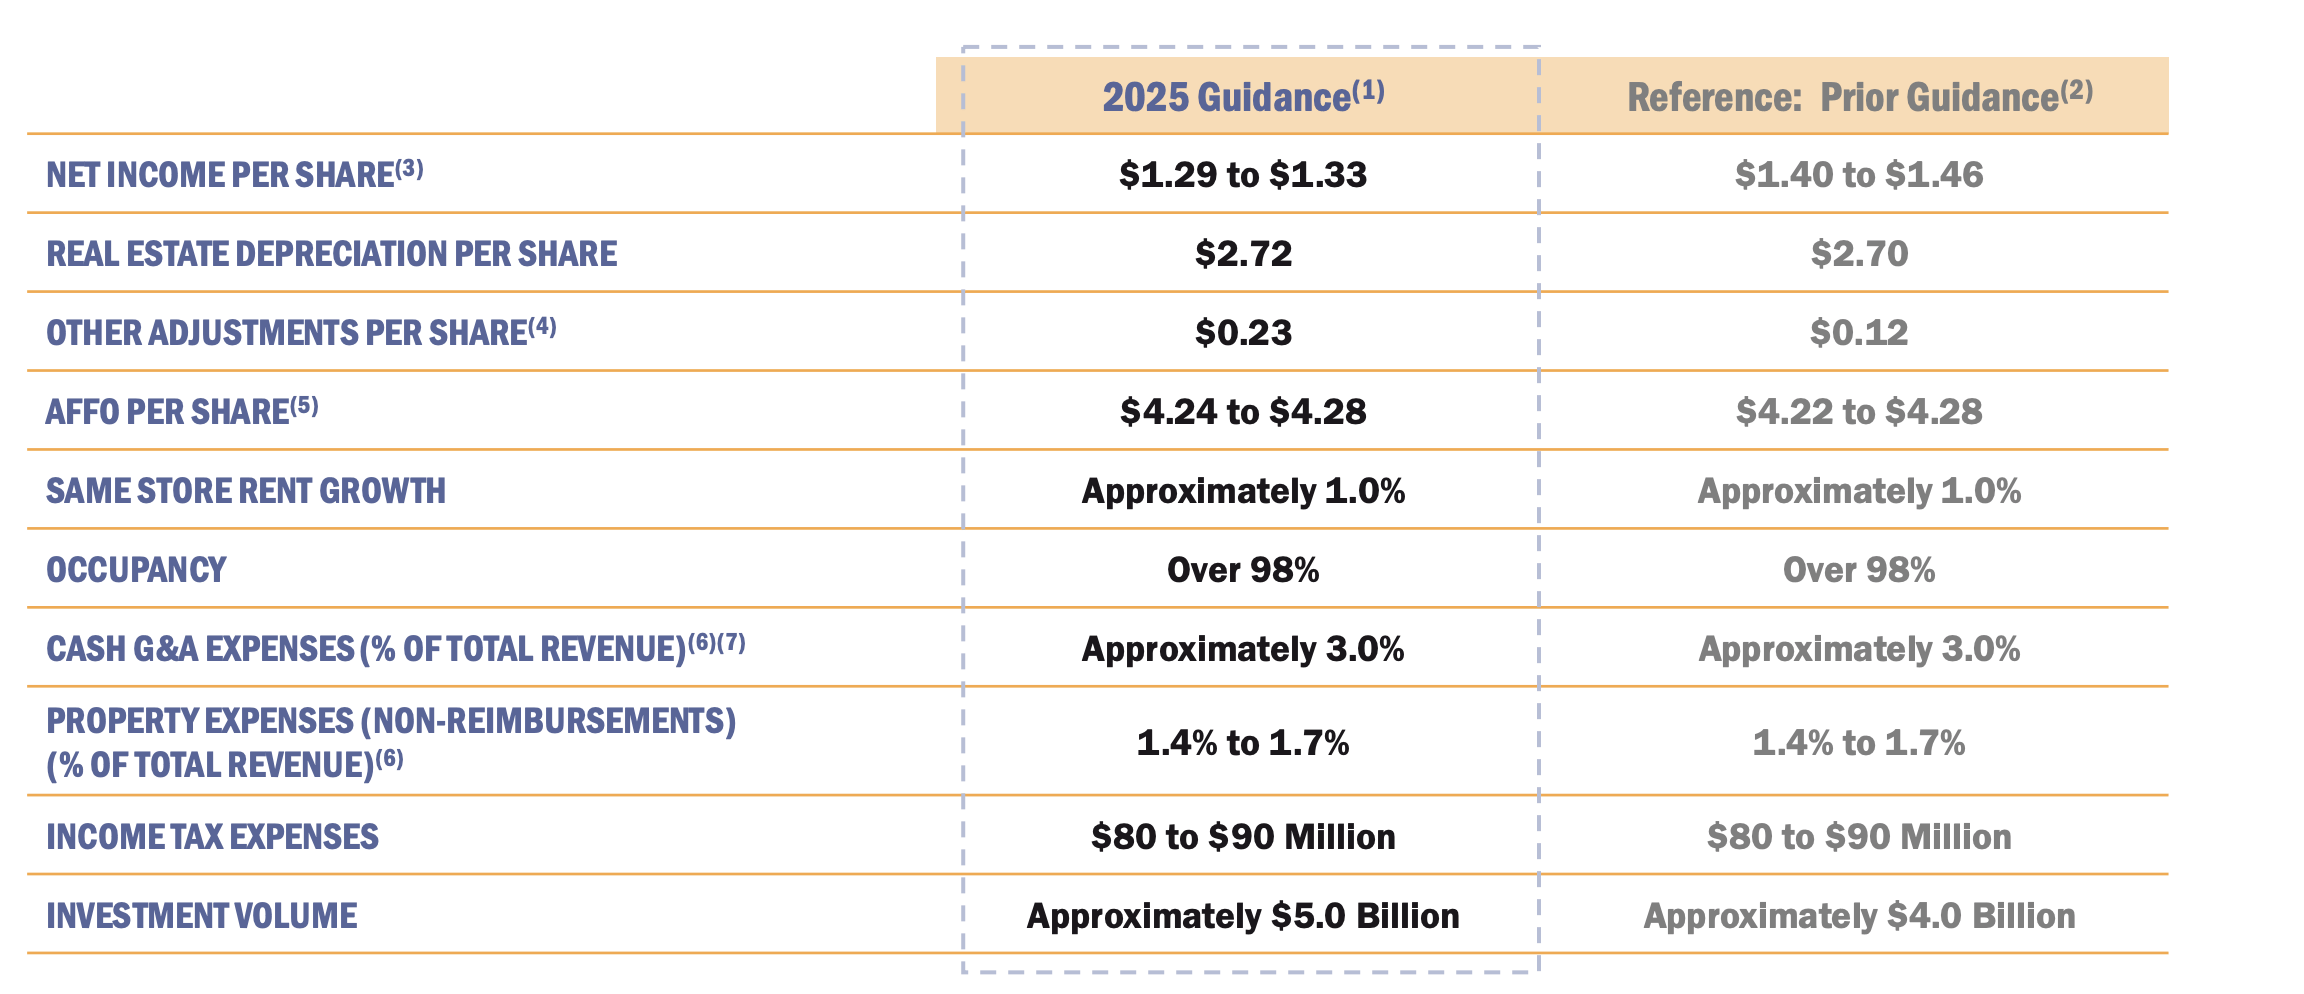
Overall, the company’s 2025 guidance is strong versus a $57.8 share price. The company expects 1% same store rent growth with flat AFFO / share and slightly lower net income. Property expenses and income taxes are expected to remain more than manageable while the company is guiding for higher investment volumes.
There is one concern here where the company’s 2024 AFFO was $4.19 / share indicating only 2% YoY growth not enough to support lofty dividend increases.
Realty Income has one of the strongest balance sheets in the industry with low-interest rate debt.
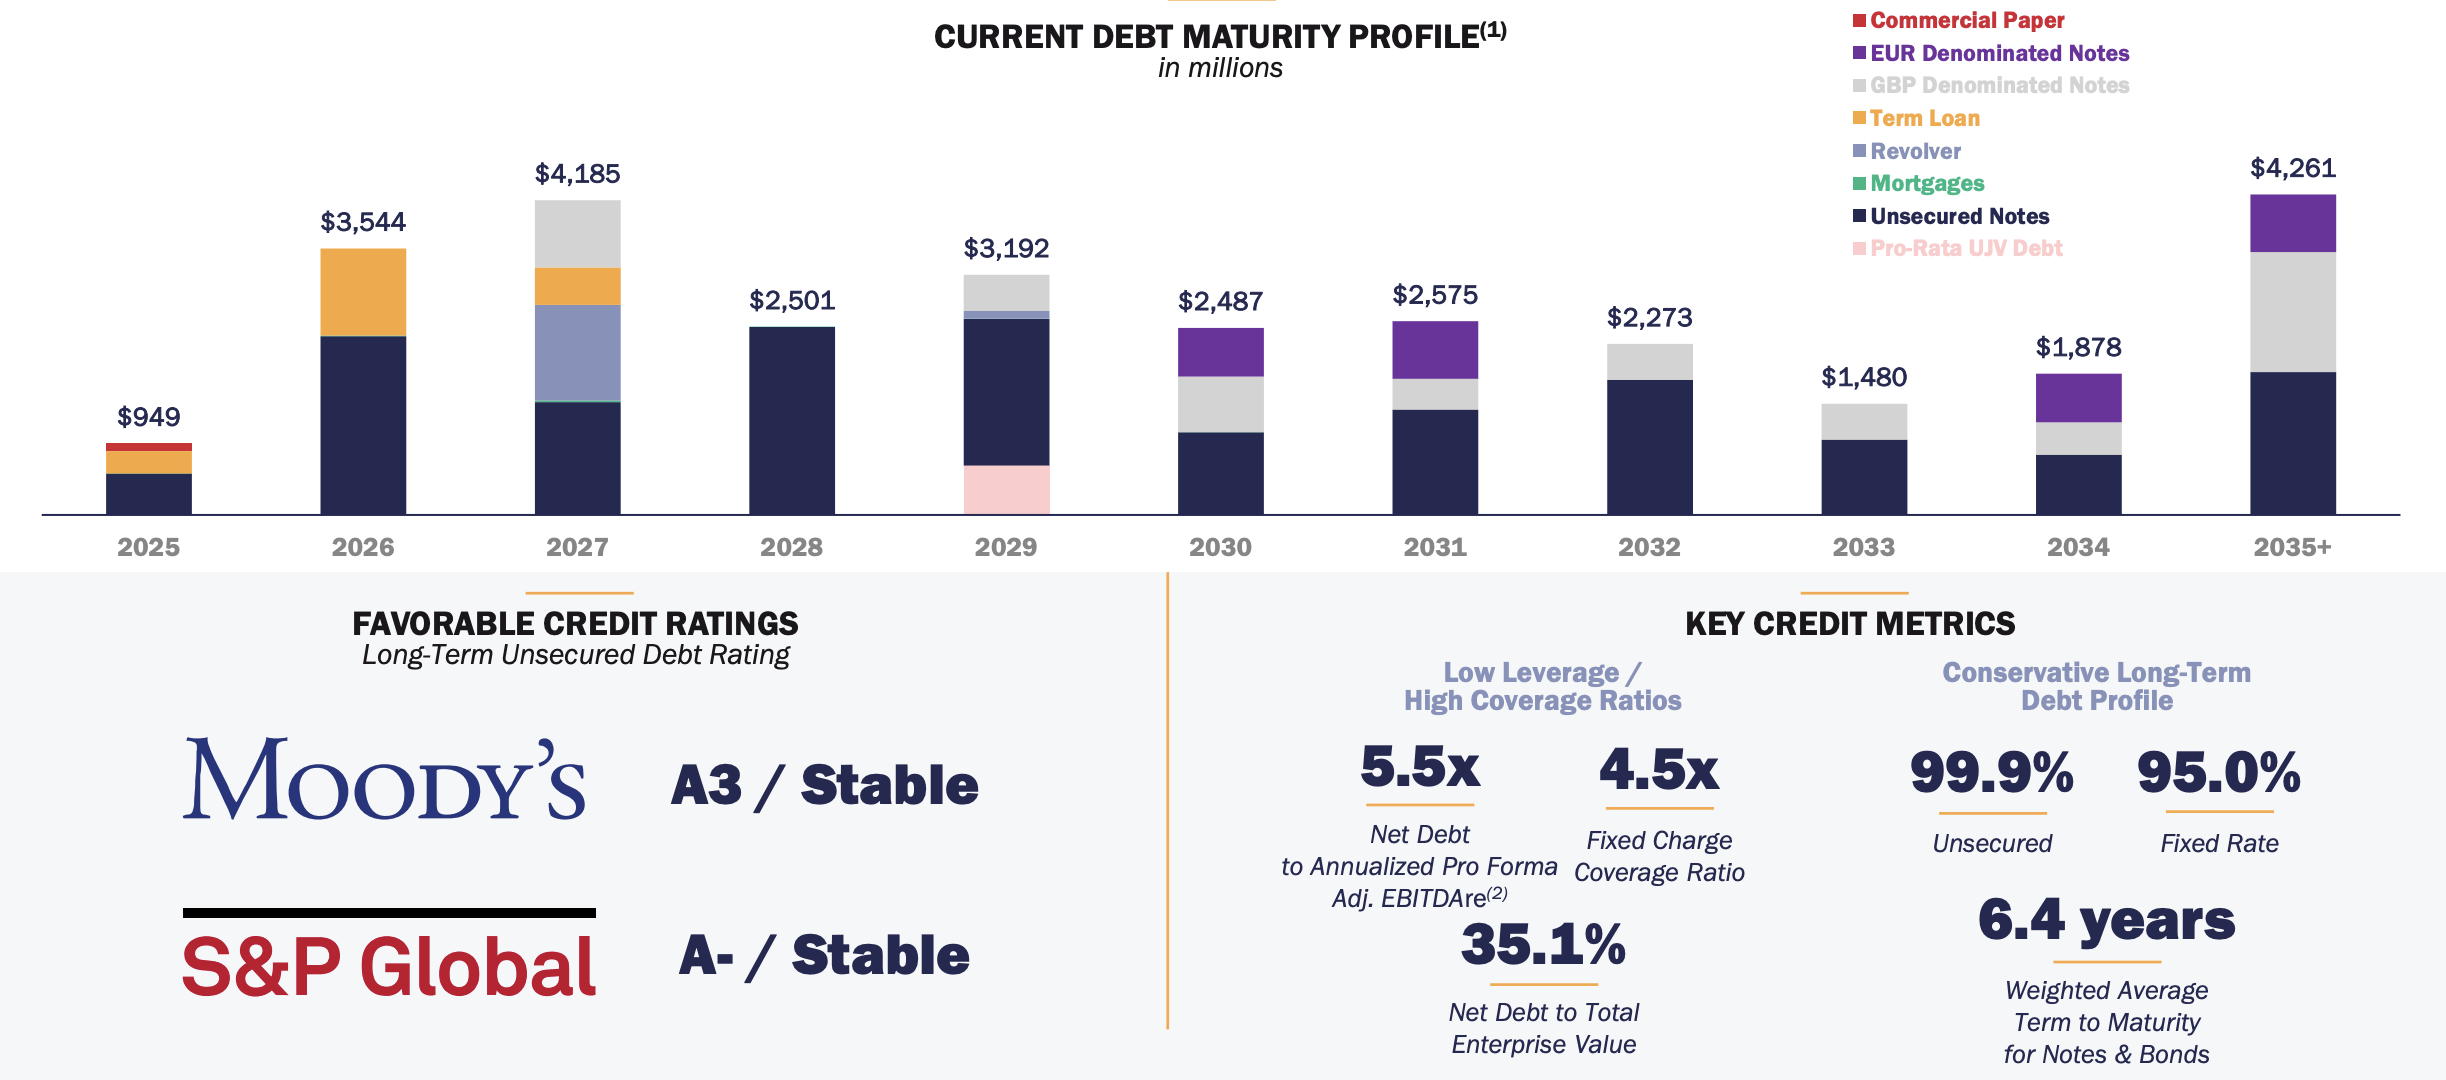
The company has 5.5x net debt to annualized pro forma adjusted EBITDA with $28 billion in net debt based on its enterprise value. The company’s debt is 99.9% unsecured and 95% fixed rate, both of which make it manageable with a 6.4 years weighted average term to maturity. With expectations for the FED to decline rates, the company can refinance debt at a lower rate.
The manageable debt load is expected to fund the company’s $5 billion sourcing for 2025 and enable AFFO to continue its growth.
The largest risk to our thesis is the company’s valuation. The company has a dividend yield of just under 5.6% and it uses dilutive equity to fund its business. The company expects to be able to achieve dividend growth in the mid single-digit range, but the best-case scenario here is ~10% return. With a downturn, it could be less, making the company a poor investment.
Realty Income is expected to see rates decline enabling the company to refinance its debt at a lower rate while continuing to earn strong returns from properties bought at a higher cap rate. The company has guided for increased acquisitions in 2025 as a result, acquisitions that it can comfortably afford to make. More so despite the size, the company has a large addressable market.
Realty Income is expecting to continue its growth and has an incredibly impressive track record of generating strong cash flow from these assets and using it to fund a multi-decade, growing dividend. Putting that all together makes Realty Income a valuable investment opportunity.


The market has reacted to both updates in a negative fashion.
The general chart interpretation is that when the price is above the cloud the sun is shining on your position but below the chart it’s raining on your parade.
In the cloud watch for the direction.
The reason the Snowball only invests in belt and braces shares.

As Paul puts it, he and his wife generally have a buy-and-hold approach, with their top 10 holdings making up more than half of the joint portfolio, largely because of a process of automatically reinvesting dividends. But he wonders whether the combined portfolio is too heavily focused on income stocks. “Should we have more in the US and growth-only stocks?” he asks.
The portfolio has taken some knocks. “We are down about 70 per cent on Watkin Jones (WJG) and Strix (KETL), which is not acceptable,” Paul explains. “We have losses of around 20 per cent on Central Asia Metals (CAML) and RIT Capital (RCP). We are happy with CAML’s losses as we like the company and its dividend.”
When it comes to investment goals, Paul notes: “A 5 to 7 per cent total return would be fine as we do not need dividends to maintain our normal lifestyle. We are saving for potential care home costs primarily. However, we used dividends to pay for major items such as a car, major holidays and recently solar panels. We also take money out at Christmas.”
Paul and Helen have two daughters in their 50s, and he notes: “We want them to inherit as much as possible, and our wills set out our wishes in percentage terms as we don’t know if we need extensive care. One house passes to our daughters on the first death, using the current tax allowances.”
The couple invested in Scottish Mortgage and Greggs (GRG) many years ago and withdrew their initial investments close to recent peaks, meaning “the value in the portfolio is all profit”. Paul is happy to stick with these names, believing they will “bounce back”.

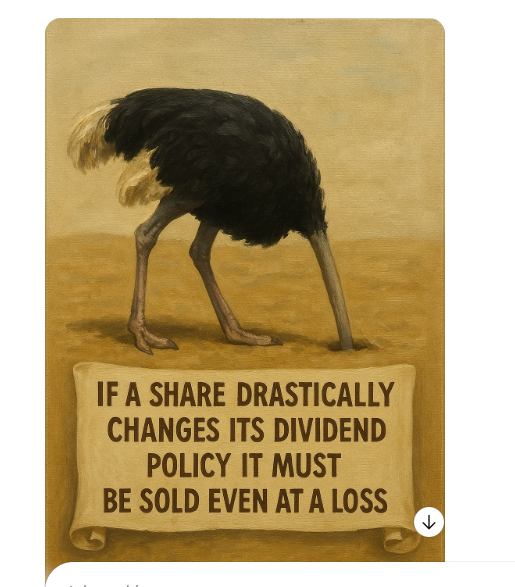
If you buy an Investment Trust and it turns out to be a clunker as long as it pays a dividend, there is a chance that you will one day print a profit.
TLT
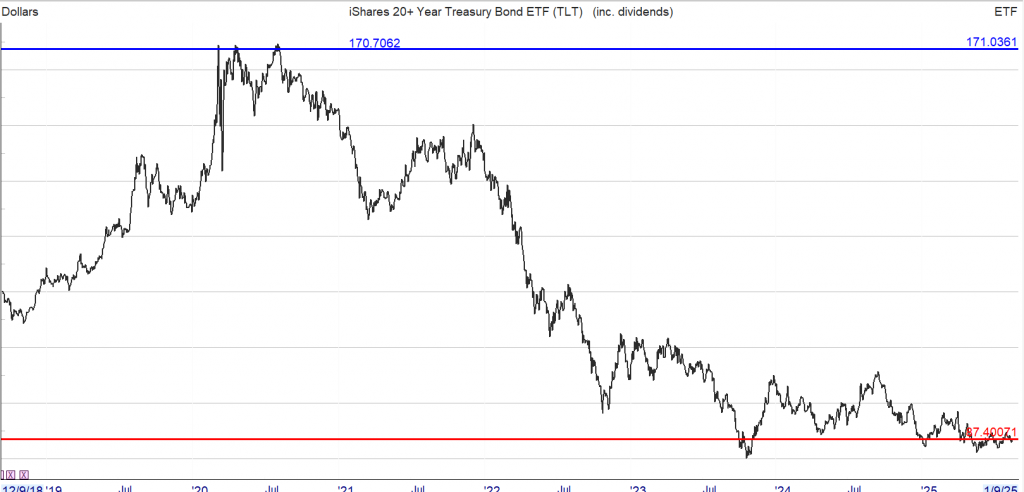
Despite all that you have read and therefore believe, bond funds can be very dangerous vehicles if you buy at the wrong time.

Brett Owens, Chief Investment Strategist
Updated: August 20, 2025
Let’s talk about a terrific 12.2% dividend that is paid monthly.
The source of this income? Safe US Treasuries and a methodical scraping of option premiums for additional yield.
We’ll talk about this monthly payer—including fund name and ticker—in a moment. First, let’s get caught up on the Treasury market.
You may have tuned out Treasuries as a potential investment when DOGE austerity efforts gave way to the Big Beautiful Bill. Uncle Sam, already a $36 trillion debtor, dug himself deeper into financial quicksand.
Who wants to lend to that guy? Certainly not bond investors, who demand higher compensation—higher percentage payouts—to offset the credit risk posed by Sam’s ugly balance sheet.
The bond market specifically demands higher yields at the long-end of the bond curve, bonds that mature 10 or more years ahead. Traditionally the majority of US marketable debt (85%+) has consisted of these longer-dated bonds, which are purchased by pension funds and sovereigns.

Yet here we are today with the 10-year Treasury yielding just 4.3%. Yes, borrowers are lending to Uncle Sam and asking for a mere 4.3% per year over the next 10 years. In a perfectly free market this yield would likely be 5% or more but policymaker “wizardry” has secured a borrowing discount for ol’ Sam.
(Remember, bonds are loans from the buyer to the issuer. When the Treasury issues bonds, it’s essentially Uncle Sam asking for loans. No one is obligated to make these loans, however! So, Ol’ Sam has no choice but to pay whatever yield the market demands. Which is why the market has been, ahem, massaged in recent years.)
Who is the man behind the curtain pulling these strings? Currently it’s Treasury Secretary Scott Bessent, who took over the controls from predecessor Janet Yellen.
Yellen subtly influenced the bond market by issuing primarily short-term debt rather than long-dated Treasuries. This reduced long-term bond supply and suppressed long-term yields (demand exceeds supply and the issuer—the US government—can offer lower yields). I called this “Quiet QE” because it was not widely reported but it likely held long yields 0.5% lower than they would have been otherwise.
By 2024, Yellen had funded a whopping 75% of the deficit at the short end of the curve—up from just 15% five years earlier. Current Secretary Bessent publicly criticized this tactic but quietly continued it (“watch what I do, not what I say”), but at an astonishing 80% versus Yellen’s 75%!
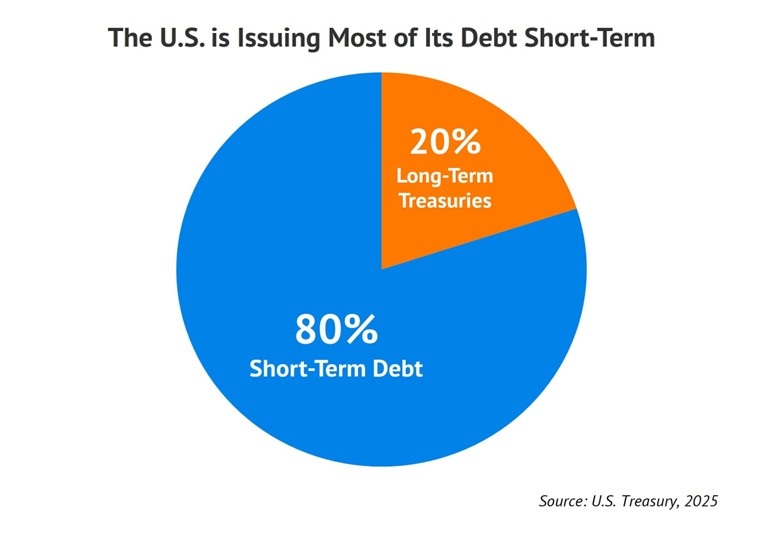
This stealthy switch to short-term debt puts a ceiling on long-term yields. Bessent clearly won’t tolerate a higher 10-year yield because it inflates interest payments on federal debt. He wants long-term rates capped, providing a sturdy floor beneath the bond market—and he’s doing it by limiting the supply of long-dated bonds. (Aside: mortgage rates follow the 10-year, and this administration will do anything to lower those!)
Bessent’s sleight of hand makes Treasury bond funds like the iShares 20+ Year Treasury Bond ETF (TLT) attractive. TLT currently yields 4.6%. Not bad.
TLT should hold its yield when the Federal Reserve eases. The Fed lowering rates will reduce yields on money market funds and short-term bonds instantly, but the “long end” of the curve won’t be directly affected.
So, vanilla investors assume that long-term yields will drop as the Fed lowers. We say, “not necessarily.”
When the Fed began cutting rates last September, it ironically sparked a serious rally in long yields! The 10-year rate soared from 3.6% to 4.8% within three months. That was a 33% move!
The Fed Cut, But Long Rates… Spiked?!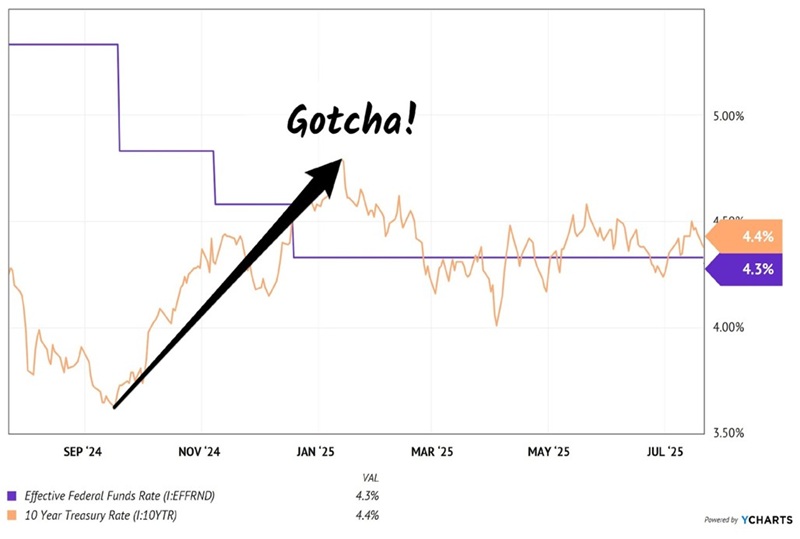
Long rates rose because inflation expectations increased. Bond buyers worried that Powell was cutting too fast, too soon. Investors bid up the yields on long bonds (which are more sensitive to inflation because of their length).
I don’t anticipate a long rate move as extreme this time around. But it is possible that long rates will slowly grind higher as the Fed lowers. Which will weigh on long-dated bond prices and funds such as TLT.
For a 4.6% yield we’re going to “pass” on TLT itself. Even a 1% or 2% price decline will crimp our returns. Given our “retire on dividends” mandate of 8% returns per year or better, we need some upside from here.
Or we can boost TLT’s yield to a terrific 12.2% and call it a day! And we can do this without having to fiddle with options such as selling puts or writing covered calls.
A newer ETF does this all for us.
iShares 20+ Year Treasury Bond BuyWrite Strategy ETF (TLTW) buys TLT and then enhances returns by selling covered calls. It generates a terrific 12.2% yield via a dividend that is paid monthly:
TLTW Pays a Big Monthly Dividend
Plunk $100,000 into TLT today and we clear $4,600 per year. Shift it into TLTW and that income vaults to $12,200.
TLTW holds 100% TLT shares and sells monthly covered call options. TLTW pockets the options income, plus a bit of potential appreciation (up to 2% per month) if TLT rallies.
The result? A dynamic monthly dividend currently annualizing to a terrific 12.2%.
Next time you see suits on TV hyperventilating about bonds, just sit back and smile. Their persistent worries only pump up TLTW’s premium income!
Whether you believe in Treasuries or want to stick with more traditional 8%+ monthly payers, the strategy is the same—let your portfolio replace your paycheck and cover your monthly bills.
Contrary to vanilla Wall Street opinion, it is possible to find elite 8% payouts that are delivered monthly

Paul Le Page, Interim Chairman of NextEnergy Solar Fund Limited, commented:
“NextEnergy Solar Fund’s high-quality asset base continued to demonstrate resilience in the period, despite a challenging macroeconomic backdrop and a fall in long-term UK power price assumptions that reduced the NAV. This quarter, the portfolio has delivered above budgeted electricity generation and benefitted from additional revenues as a result. The Board reaffirms its target dividend guidance of 8.43p per Ordinary Share for the financial year ending 31 March 2026 remains fully covered by operational cash flows.
As announced in June and in line with the Company’s long-term efforts to narrow the discount, the investment management fee was reduced, further aligning interests between the investment manager and shareholders. The Board is focused on protecting and enhancing shareholder returns, while reinforcing the strong foundation on which the Company continues to build. The Board remains committed to reviewing all options available to maximise value for shareholders.”
Ross Grier, Chief Investment Officer of NextEnergy Capital said:
“The primary driver for the reduction in NAV during the period was a material change to long-term projected UK power price assumptions provided by NextEnergy Solar Fund’s leading independent energy market consultants. This quarter benefitted from favourable generating conditions, which the NextEnergy Solar Fund portfolio was able to harness, leading to electricity generation in the UK at 7.6% 4 above-budget after DNO outages, providing an uplift to NAV per Ordinary Share of 0.5p.
NextEnergy Solar Fund continues to offer an attractive return for its shareholders and is proactively managing its portfolio to maximise revenues. The Board and the Investment Adviser continue to explore opportunities to add NAV growth to the platform, whilst also prioritising the reduction in both long-term and short-term debt.“
Dividend:
· Total dividends declared of 2.10p per Ordinary Share for the Q1 period ended 30 June 2025 (30 June 2024: 2.10p), in line with full-year dividend target.
· Full-year dividend target guidance for the year ending 31 March 2026 remains at 8.43p per Ordinary Share (31 March 2025: 8.43p).
· The full year dividend target per Ordinary Share is forecast to be covered in a range of 1.1x – 1.3x by earnings post-debt amortisation.
· Since inception the Company has declared total Ordinary Share dividends of £407m.
· As at 20 August 2025, the Company offers an attractive dividend yield of c.11%.

Think value investing, think Temple Bar.
Chairman’s Statement
Performance
The total return of the FTSE All-Share Index was +9.1% in the half-year. I am pleased to report that the Trust’s Net Asset Value (“NAV”) per share total return with debt at fair value was +14.2%, and that the share price total return was +19.9%. This reflects strong stock selection by your Portfolio Manager in market conditions that have been supportive of their value investing approach and a material reduction in the discount to NAV at which the Company’s shares trade.
Performance over one and three years has also been strong, both on a relative and absolute basis, with a NAV per share total return with debt at fair value over the periods of +21.5% and +61.7% and a share price total return of +29.1% and +66.1% compared to a total return from the FTSE All-Share Index of +11.6% and +35.5%. It is also pleasing to note that the Trust ranks first in terms of NAV total return performance in its UK Equity Income Trust peer group over these periods. Further details regarding the Trust’s performance can be found in the Portfolio Manager’s Report.
Discount
As at the half-year end the Trust’s share price stood at a 2.0% discount to the NAV per share with debt at fair value compared to a discount of 6.6% at the beginning of the period. We were again active buyers of our own shares early in the period under review, purchasing 2,160,900 shares into Treasury in the period at a cost of £2.2m. These buybacks address the short-term imbalance between supply and demand for the Trust’s shares, reduce the discount and hence share price volatility, and enhance the NAV per share for continuing shareholders.
Since the period end, due in part to the Trust’s strong performance and also its enhanced dividend yield, no shares have been repurchased and the Trust’s share price has moved to a 0.4% premium to its NAV per share with debt at fair value as at 18 August 2025. The Board will consider the issuance of new shares, at a premium to the prevailing cum income NAV per share with debt at fair value, if there is sufficient demand as part of its premium management strategy.
Dividend
The Trust’s strong revenue performance was again in evidence, with an increase in revenue earnings per share of c.12.3% compared to the first half of the previous financial year. This has enabled your Board to declare an increased second interim dividend of 3.75 pence per share (2024: second interim dividend of 2.75 pence per share). The second interim dividend will be payable on 26 September 2025 to shareholders on the register of members on 22 August 2025. The associated ex-dividend date is 21 August 2025. This follows the payment of a first interim dividend of 3.75 pence per share on 27 June 2025.
As explained in the Company’s most recent Annual Report and supported by shareholders at this year’s Annual General Meeting, the Company’s dividend has recently been altered to see the Company’s progressive revenue-covered dividend enhanced by the payment of an additional 0.75 pence per quarter funded from capital. This has raised the prospective dividend yield on the Company’s shares to c. 4.4%, higher than the average dividend yield of the FTSE All Share which at the time of writing is 3.4%.
© 2026 Passive Income Live
Theme by Anders Noren — Up ↑