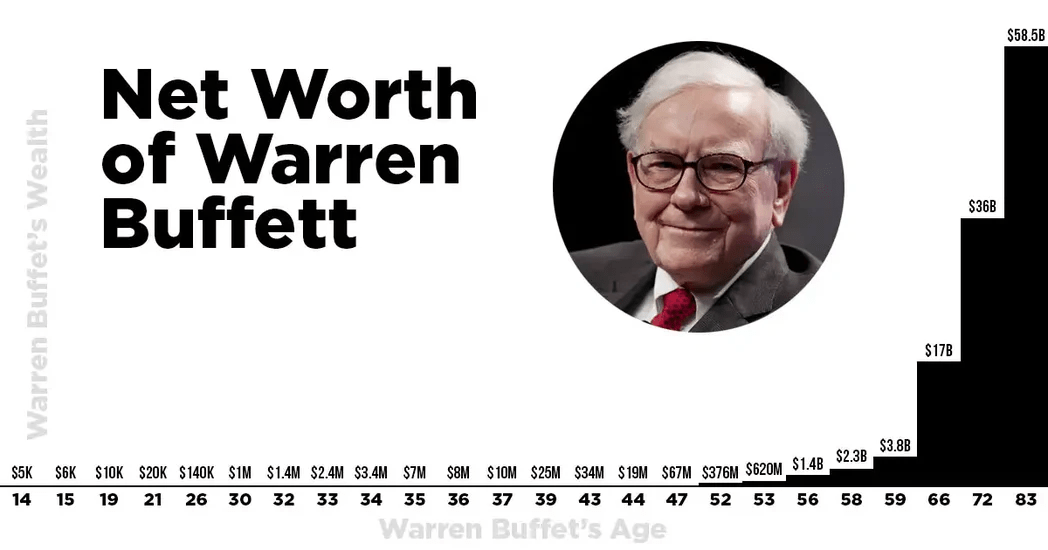
Again, Buffett is a special case, but I think you get my point. Even a 2% dividend yield turns into a yield on cost of nearly 7% when compounded at 10% per year for two decades. If the stock price keeps up with these growth rates, it’s also a blessing for one’s total net worth.
- What’s your risk profile? I have met people who have lost sleep over a 25% equity fund. I also know people who have the overwhelming majority of their multi-million net worth in crypto, tech stocks, and real estate, who don’t even break a sweat when things go down 20-40%. On top of prudent financial planning (what do I need in the future?), it’s a mindset thing.
See, the higher the risk, the higher the return. An “aggressive growth” portfolio of 85% equities returns close to 10% per year, historically speaking. However, during really bad recessions, it can temporarily lose more than half of its value (Great Financial Crisis).
A portfolio of 20% equities returns less than 6.0% per year. However, the odds of a steep decline are super low, as we can see below. Then there’s anything in between.
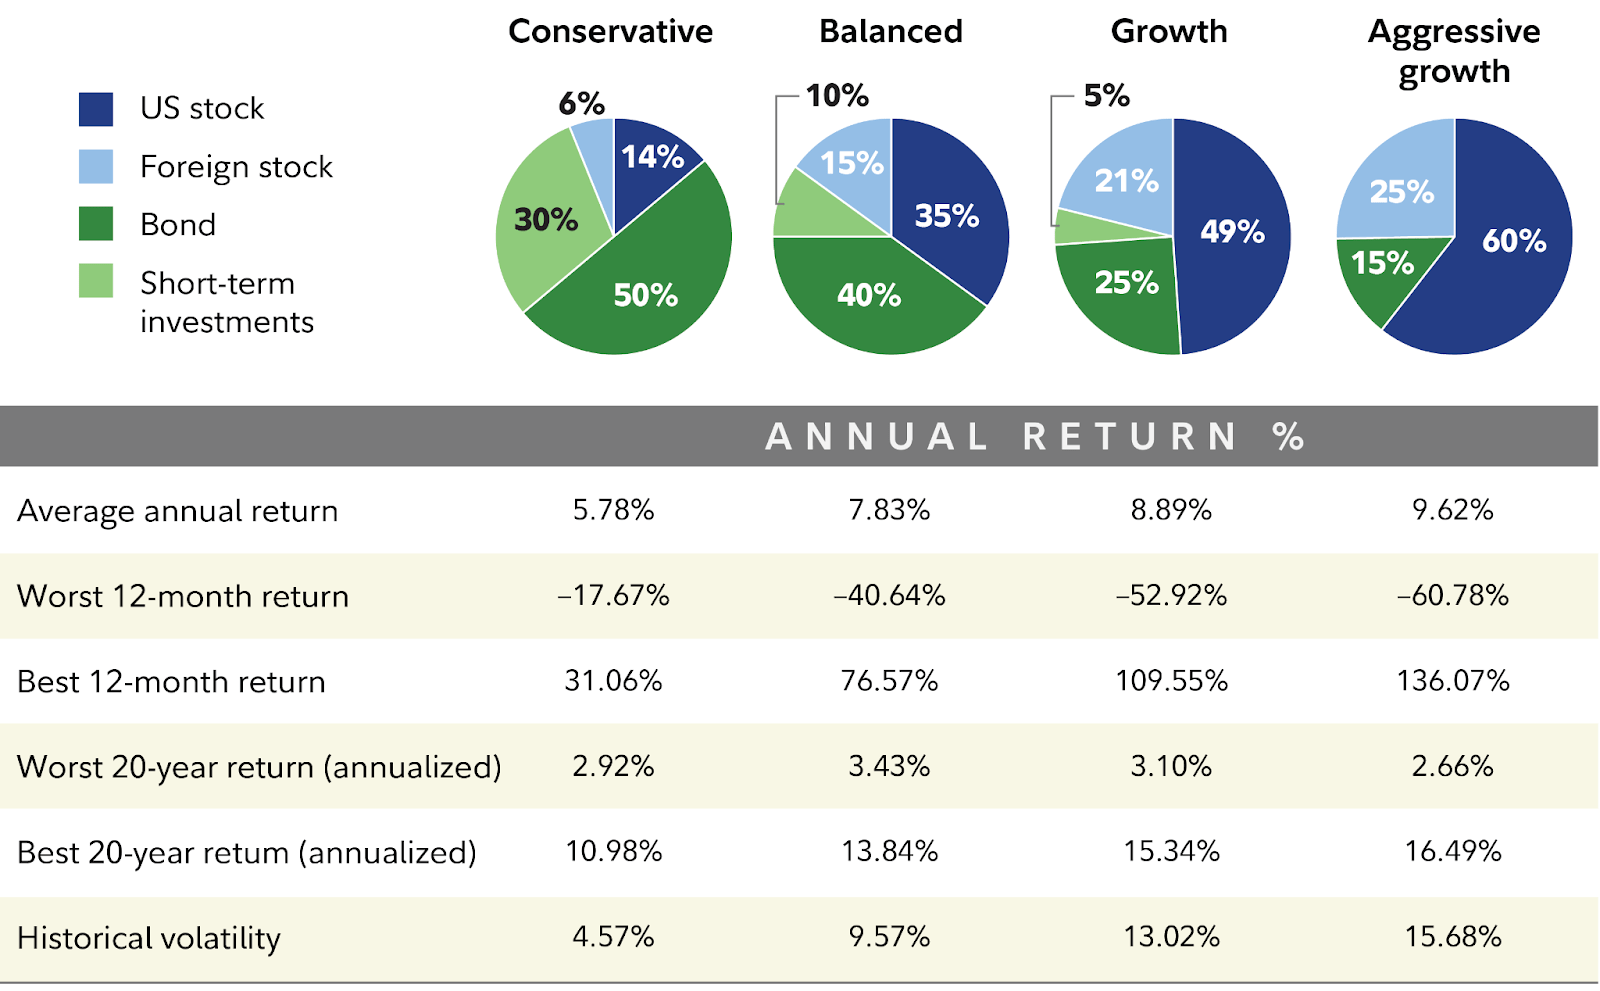
Interestingly enough, though, on a long-term basis, the odds of losing money with an aggressive stock portfolio are zero. Since the inception of the stock market in the U.S., nobody has ever experienced negative returns on a 20-year basis.
Could it change? Yes. Is it likely? No.
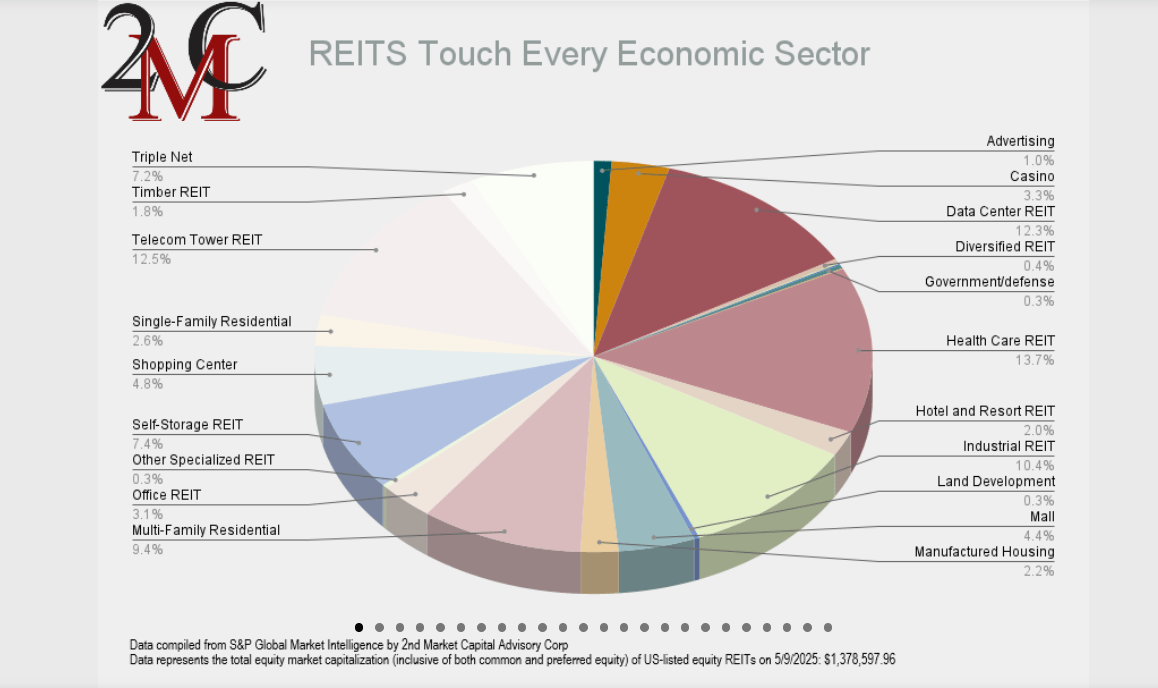
This is one of the reasons why I’m an “equity guy.” Instead of bonds, I would rather buy bond-like stocks like utilities, consumer staples, and REITs, which brings me to the next part of this article.
The 4 Stocks I Would Trust As A Core
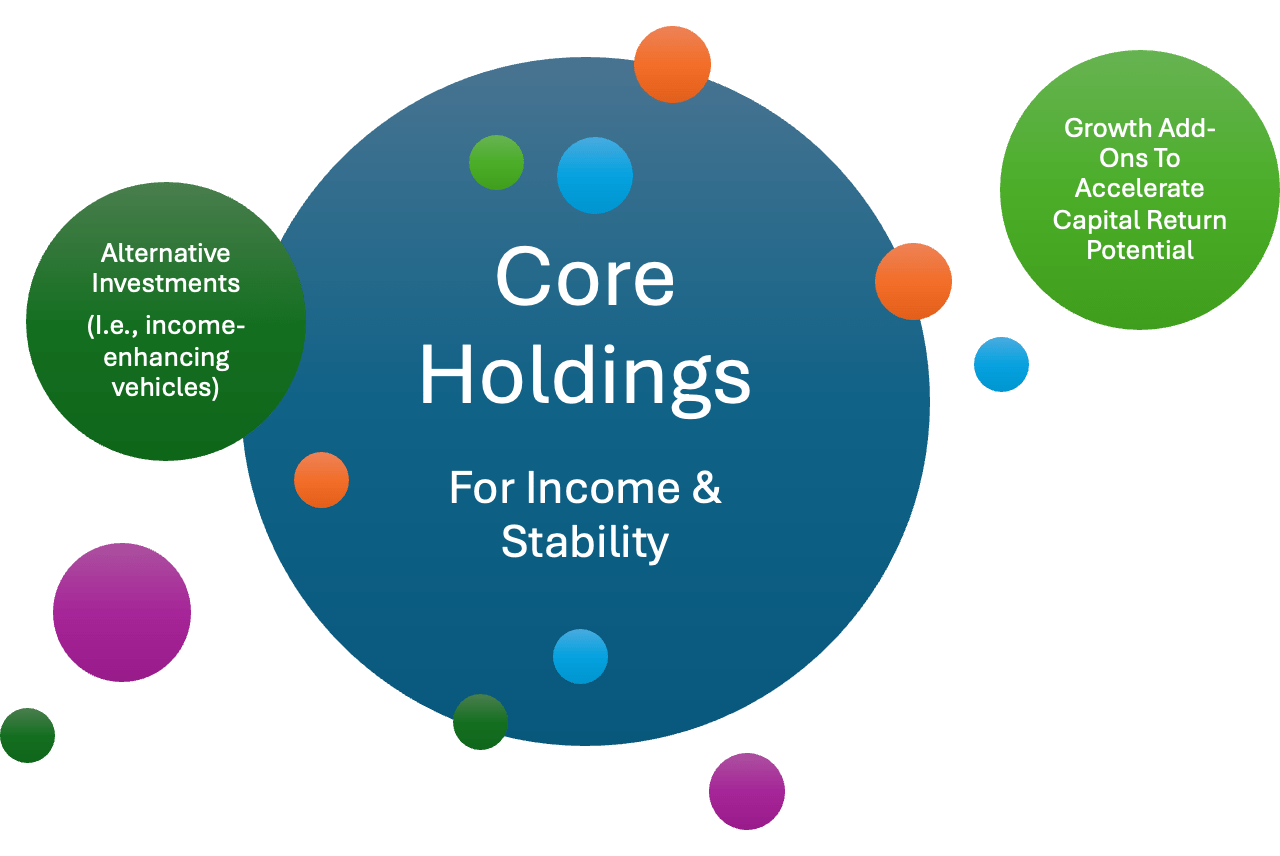
Last month, I wrote an article titled “The Only Retirement Investing Strategy I Would Trust With My Future.” It was about building core holdings that bring income and stability. Once that has been taken care of, investors can use smaller holdings to increase their return or income profile. Right now, these could be investments in AI, the energy transition, economic re-shoring, or other ideas.
For most people, the core should consist of ETFs, as these provide the best diversification benefits. By buying 2-3 ETFs, investors can buy high-yield dividend income, bonds, and even higher-growth dividend stocks like the Vanguard Dividend Appreciation ETF (VIG).
As I do not invest, I would buy ETF-like companies with diversification benefits, wide-moat business models (or other benefits), and the ability to provide consistently rising income.
In my case, I would aim for an average yield of 5.0% to 5.5%, which is a rate that has various benefits:
- If I were to achieve this return, I could retire without having to buy high-risk income stocks.
- By aiming for a mid-single-digit dividend yield, we can also incorporate lower-yielding dividend growth stocks.
- Essentially, falling for a “sucker yield” is much harder in this area. If I were forced to buy double-digit income to fund my retirement, the story would be different.
Right now, my core would definitely include ONEOK (OKE), a company I have brought up in a number of articles this year. ONEOK is a C-Corp midstream company that does not issue a K-1 form. It owns a massive network of pipelines and related support operations in areas like the Permian Basin, where it generates substantial income in fast-growing markets like natural gas liquids, natural gas gathering/processing, and refined products (see below).
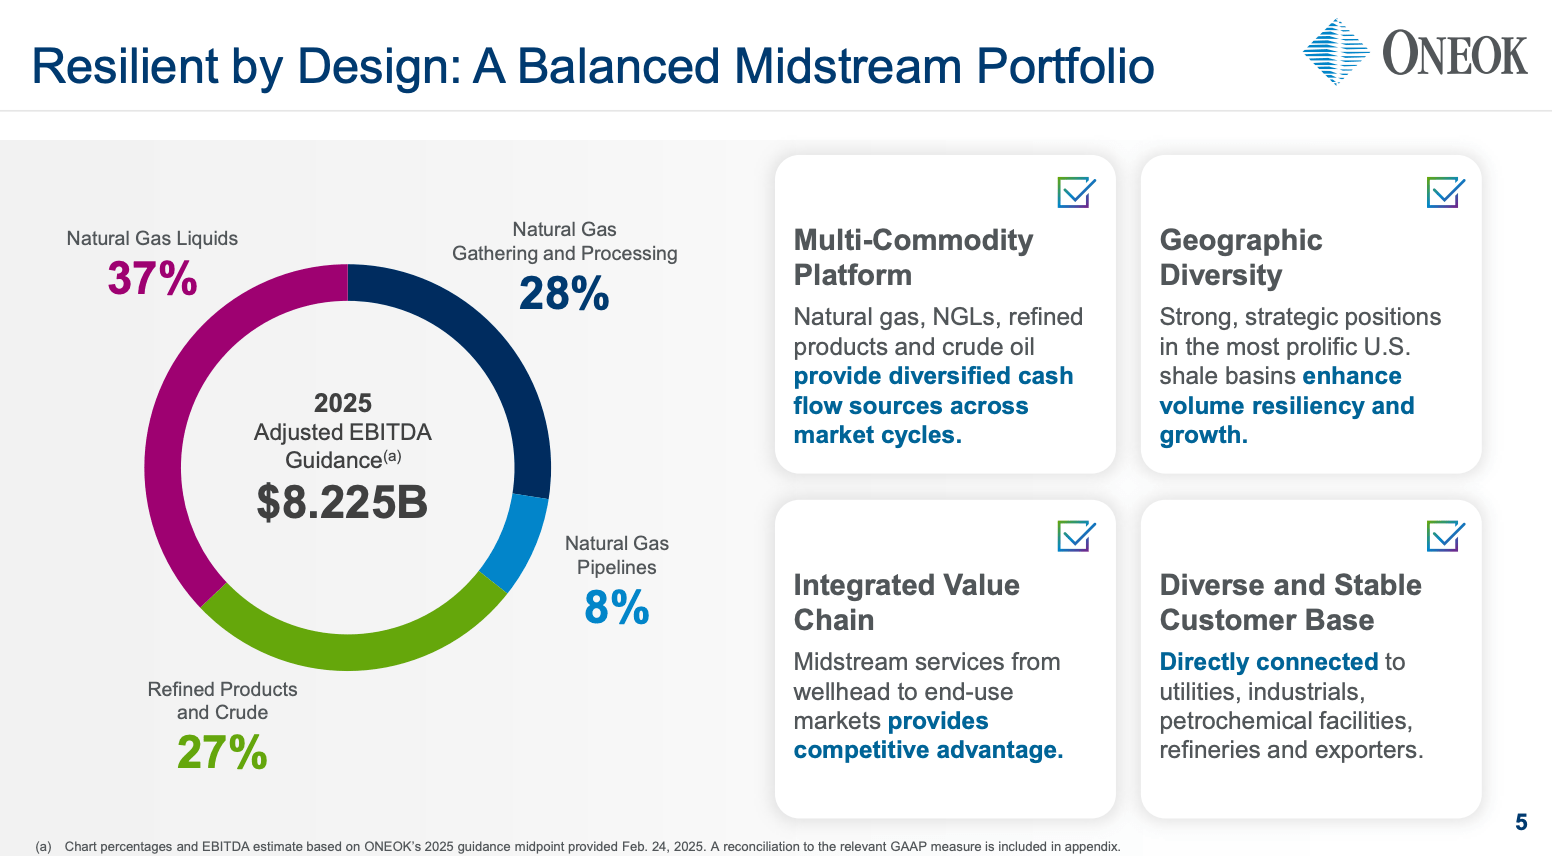
Like most companies, its revenues are mostly coming from fixed-fee contracts. That’s one of the biggest benefits, as these companies are not directly dependent on the price of oil, gas, and related commodities. As a result, ONEOK has grown its EBITDA for more than 10 consecutive years with a >16% CAGR since 2013. This includes the 2014/2015 oil crash, the 2020 pandemic, as well as the current oil and gas price weakness.
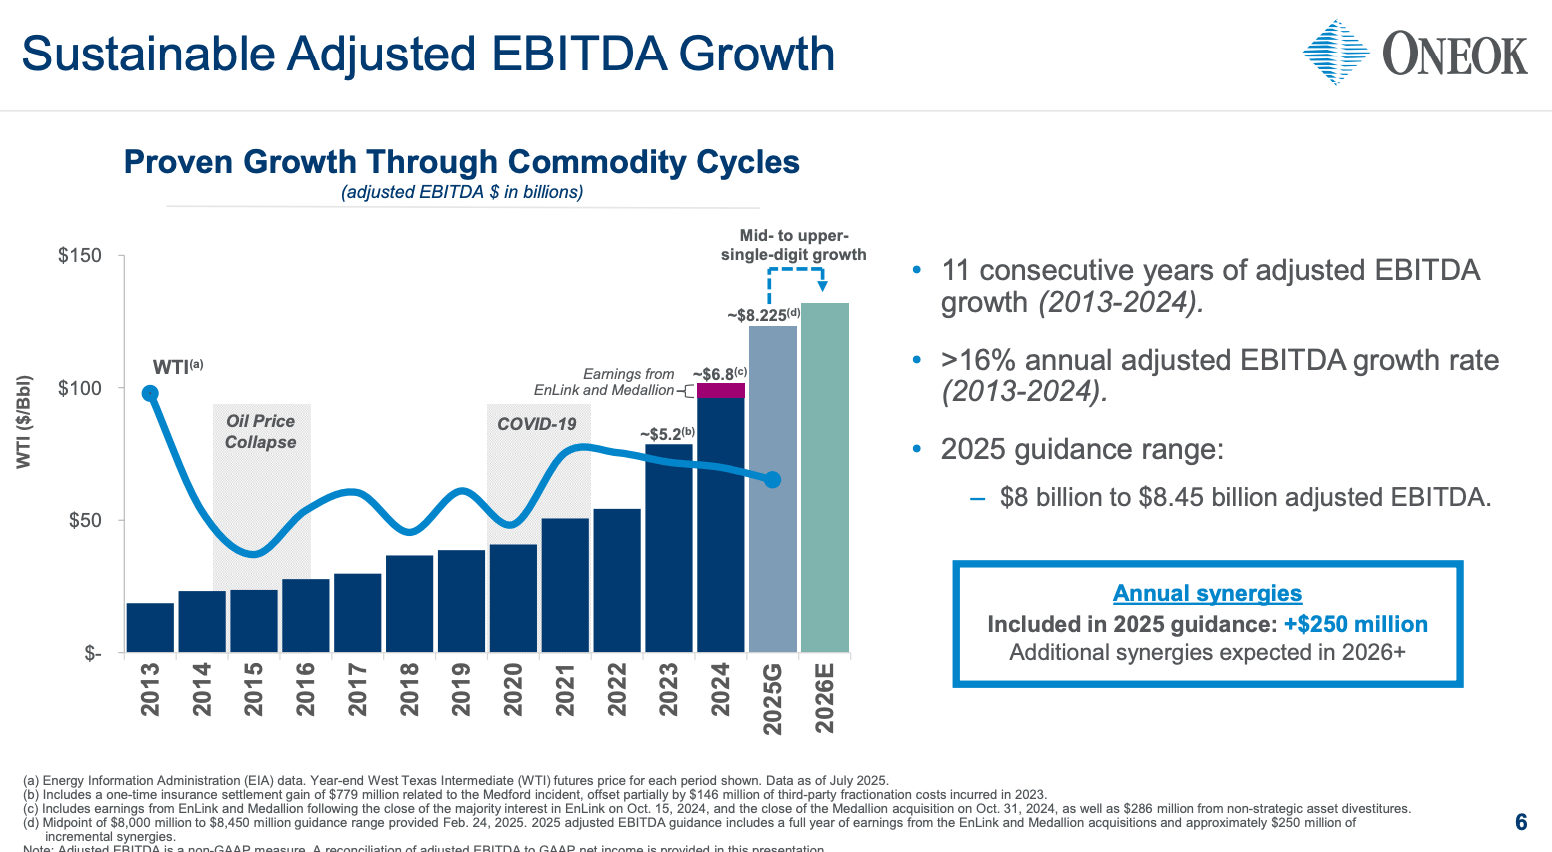
Through at least 2026, the company aims for mid-to-high single-digit annual EPS growth.
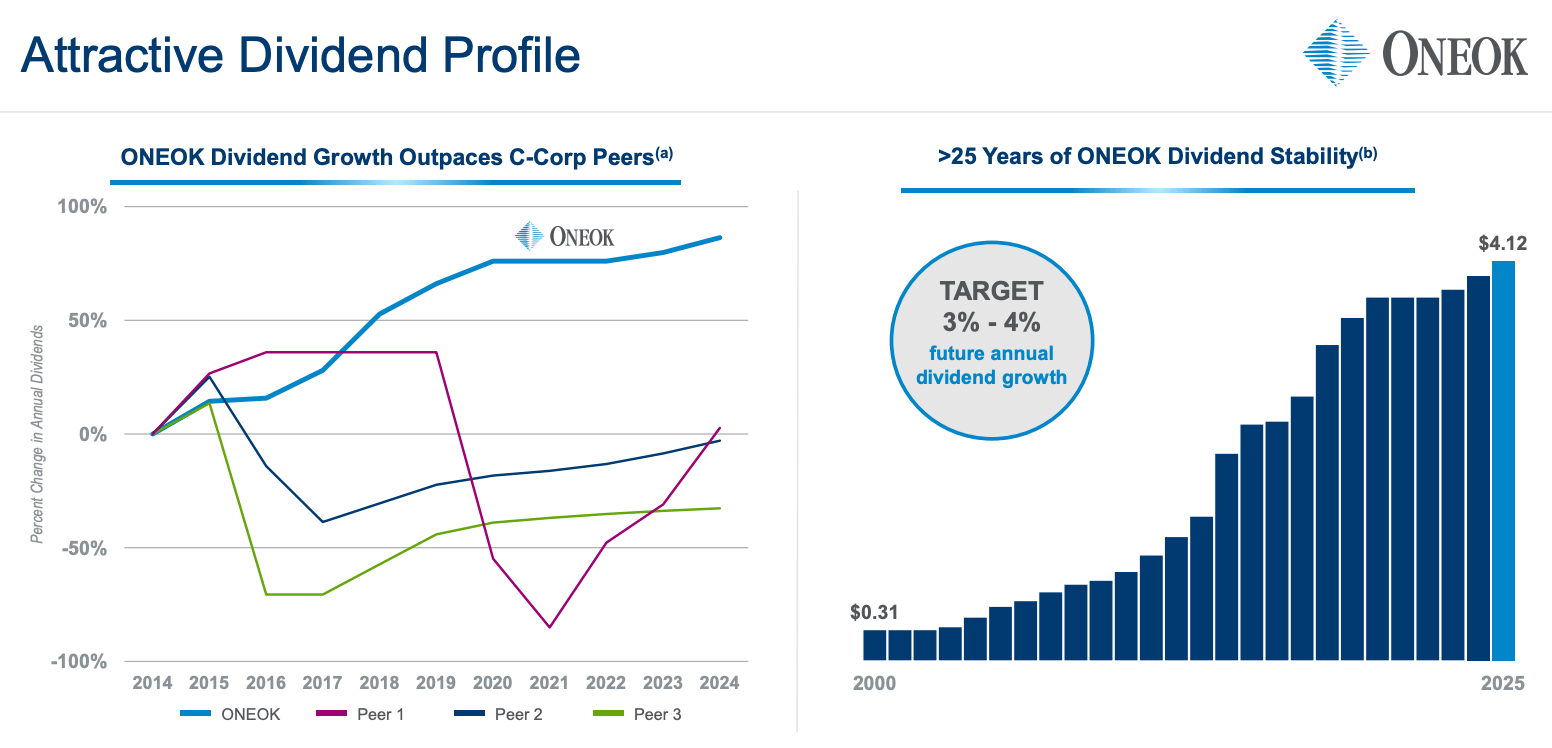
Currently, OKE yields 5.8%.
Its dividend has not been cut for at least 25 years and is expected to grow by 3-4% per year.
Interestingly enough, the yield is only so high because of recent stock price weakness. The company trades 40% below its 52-week high, as a result of weak oil prices. While this does not directly impact its revenues, the market has started to fear that prolonged subdued prices could hurt output. So far, this has happened every time during downturns and provided great opportunities.
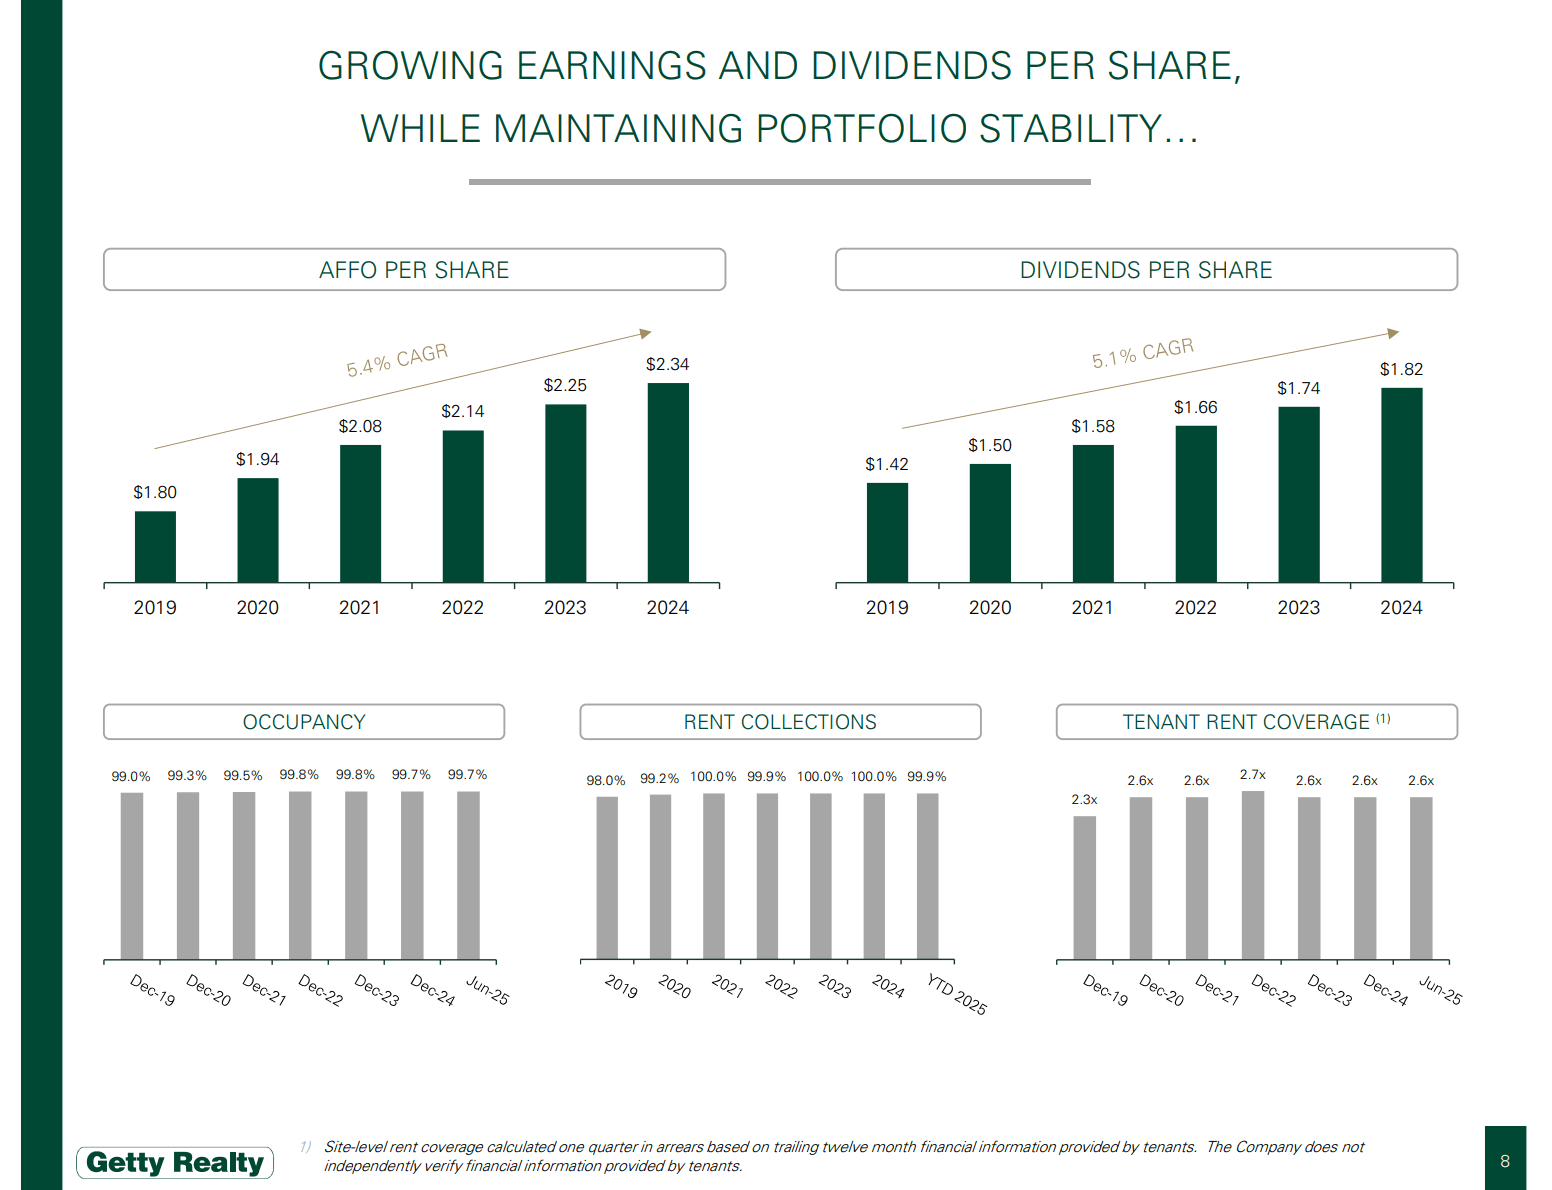
Then there’s Getty Realty (GTY), a company I have never brought up. It has a yield of 6.9%, a payout ratio of slightly less than 80%, and is one of the biggest owners of convenience and automotive retail assets. This includes auto service centers, drive-through restaurants, and car washes in high-demand areas.
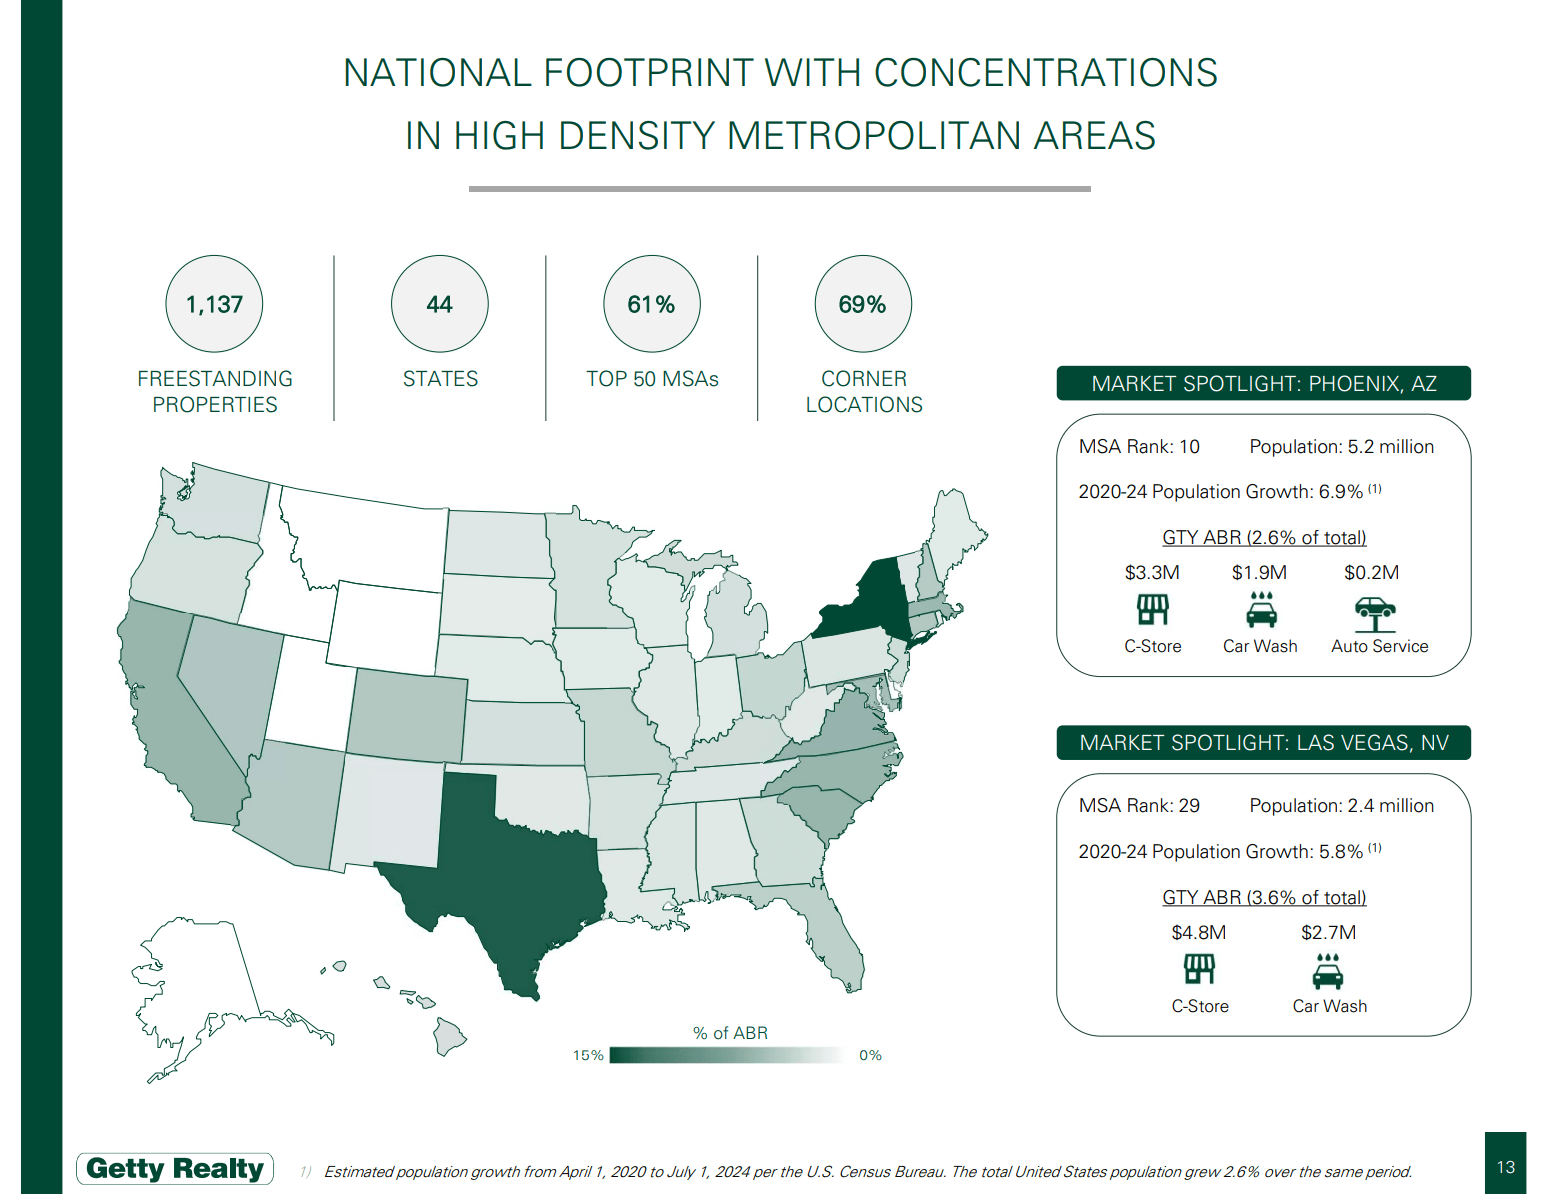
Although some of these areas have elevated competition (think of car washes), the company has an excellent track record of occupancy (99.7% as of 2Q25), rent collection, and tenant rent coverage. This allowed it to grow its dividend by 5.1% per year since 2019.
It also has an investment-grade credit rating, a net leverage ratio of 5.2x, and an average weighted lease duration of a full decade.
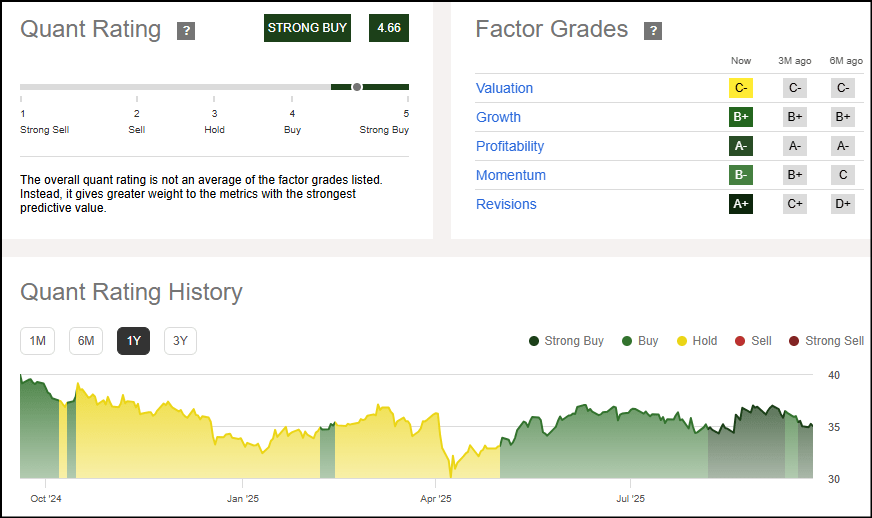
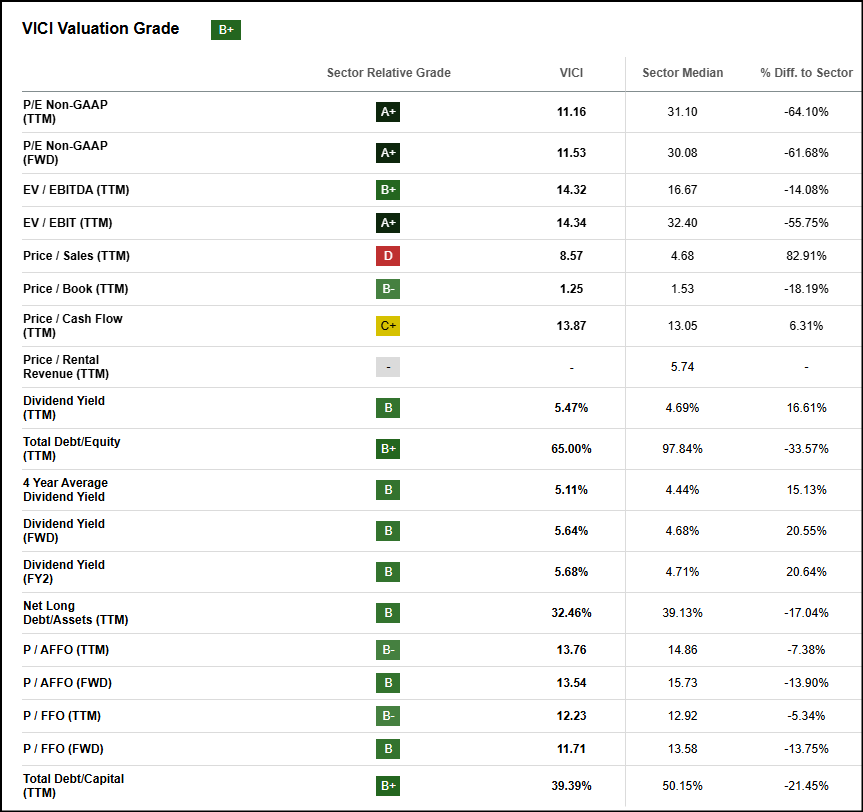
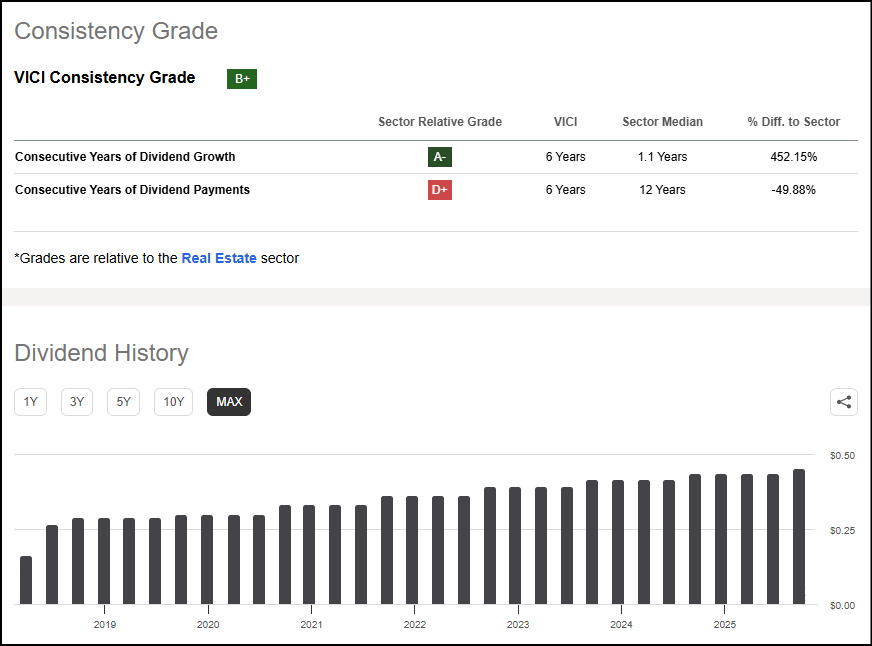
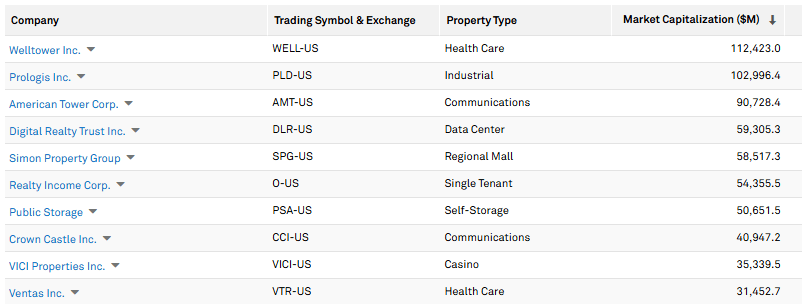
Another REIT I would add is VICI Properties (VICI), the owner of major Las Vegas Strip properties like MGM Grand, Caesars Palace, Park MGM, Mandalay Bay, New York-New York, and others. It has a triple net lease business model and 100% rent collection.
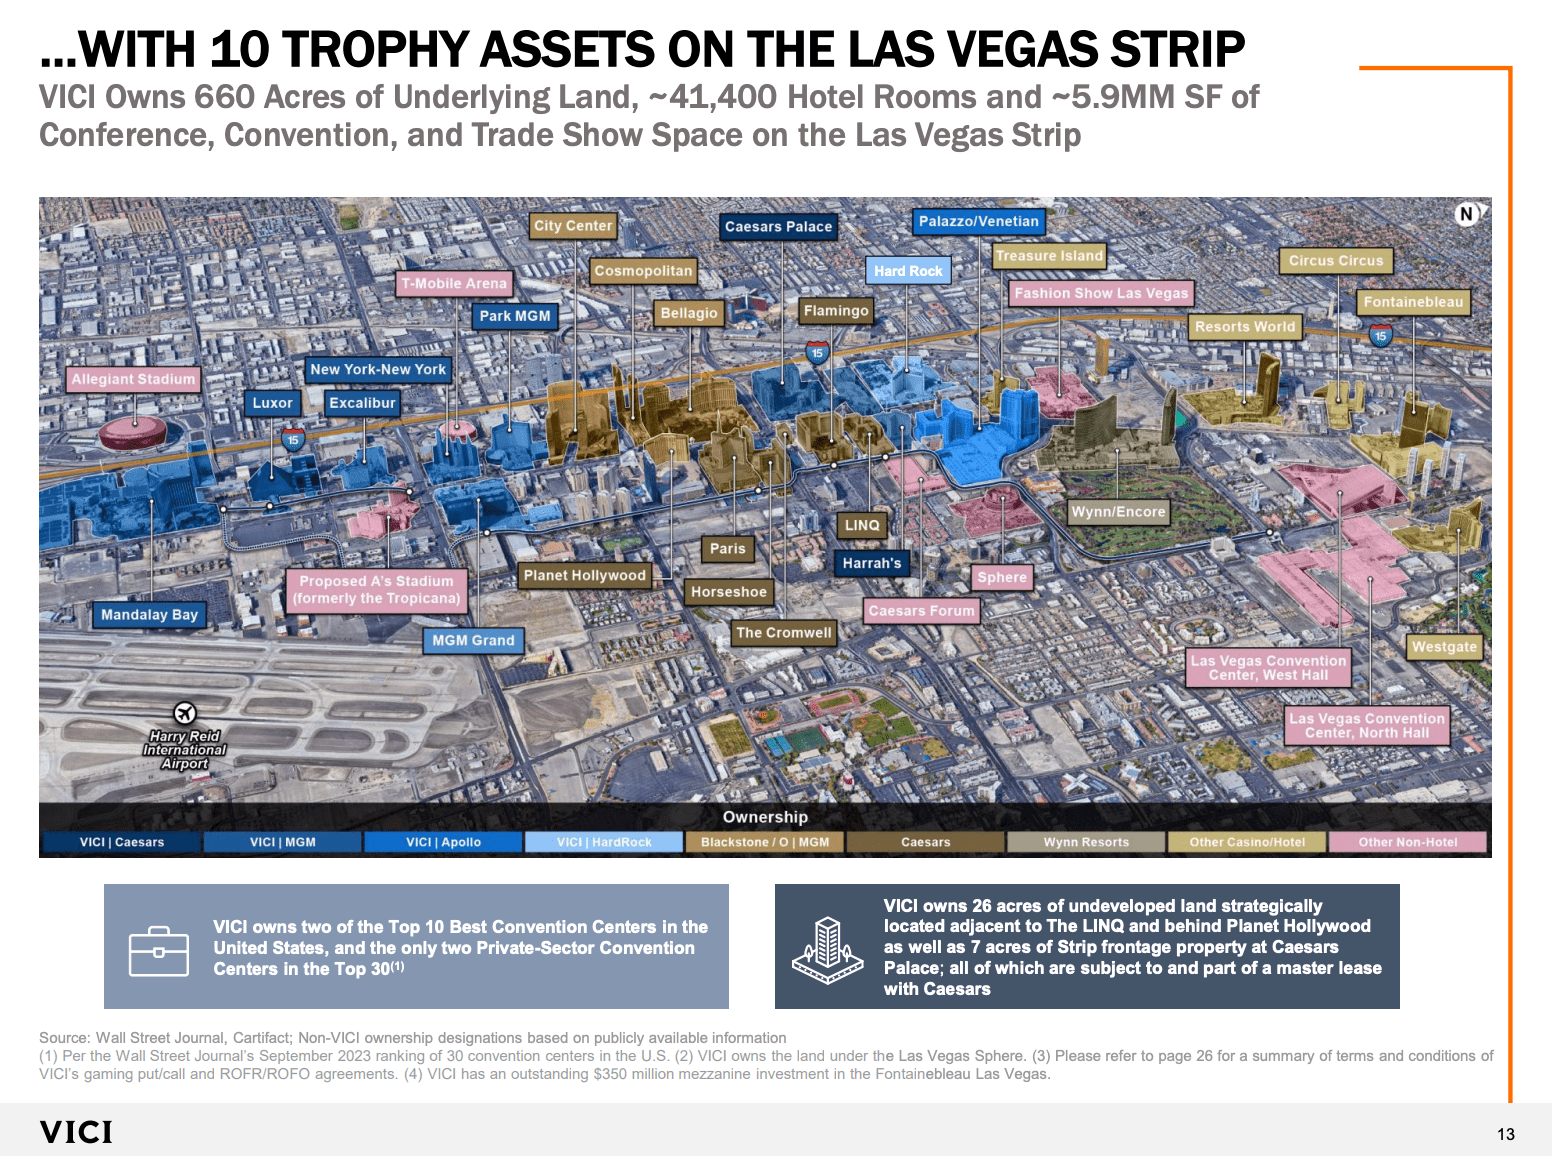
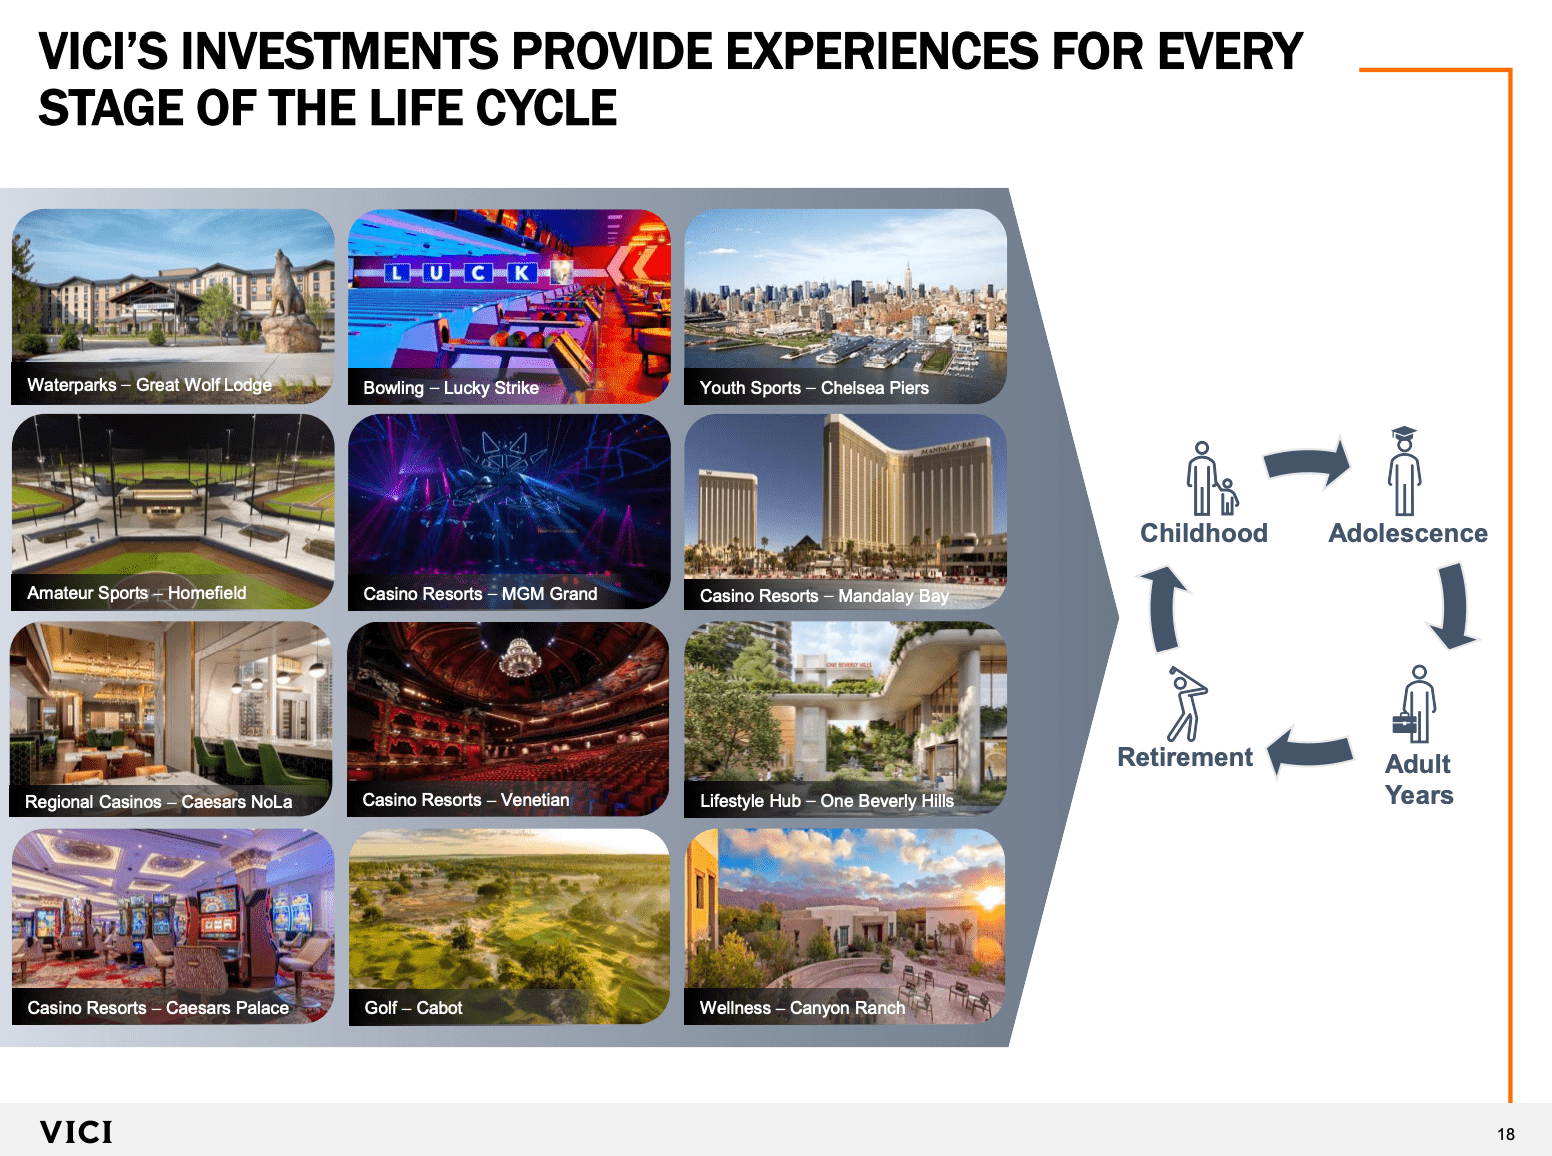
Moreover, roughly half of its revenue is generated outside of Las Vegas, as the company is consistently diversifying into other entertainment areas with strong tenants, pricing power, and secular growth. See, while AI is disrupting the world, hard assets and entertainment are two areas I expect to thrive, as people want to enjoy life and spend on experiences.
With that said, while Las Vegas is under fire from plunging visitor numbers that have triggered layoffs, I believe there is no risk to VICI, as the city suffers from a mix of weak consumer sentiment and the fact that most resorts have used premium pricing to boost margins.
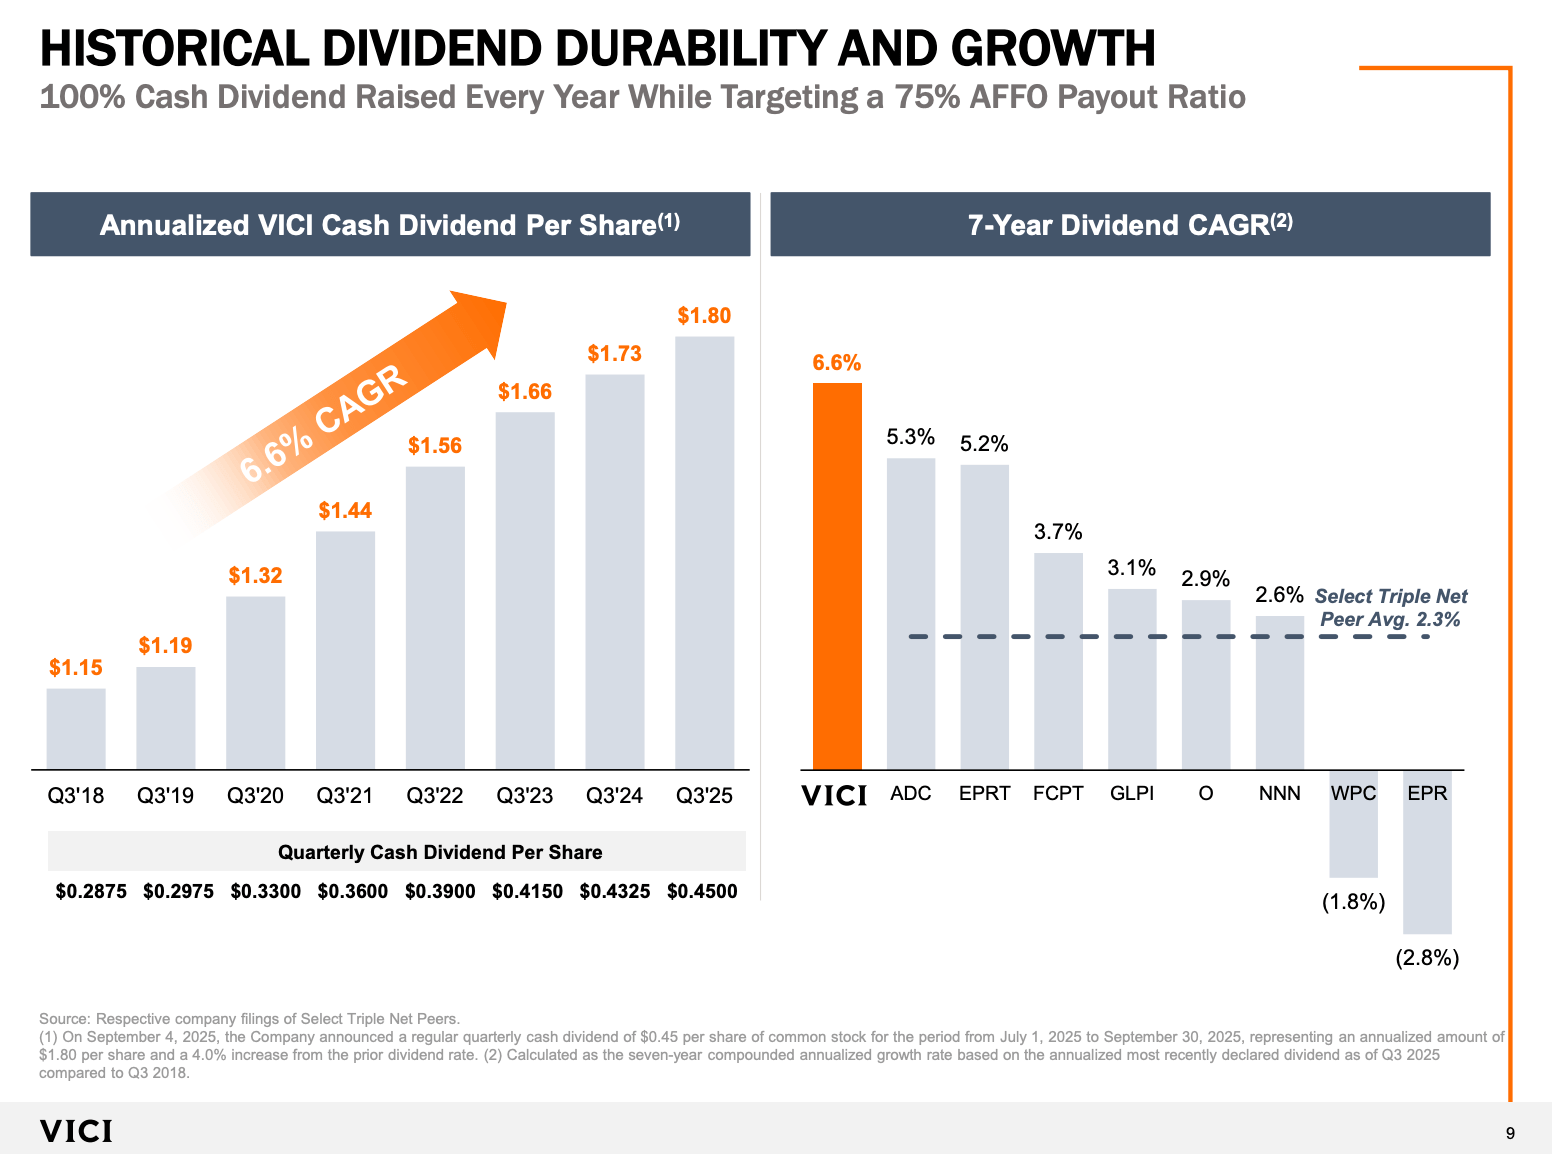
The biggest risk is for the resort operators to bring back customers. All will rely on their assets. This shields VICI and its investors. It also makes for a better yield, as VICI now yields 5.7% with mid-single-digit annual dividend growth.
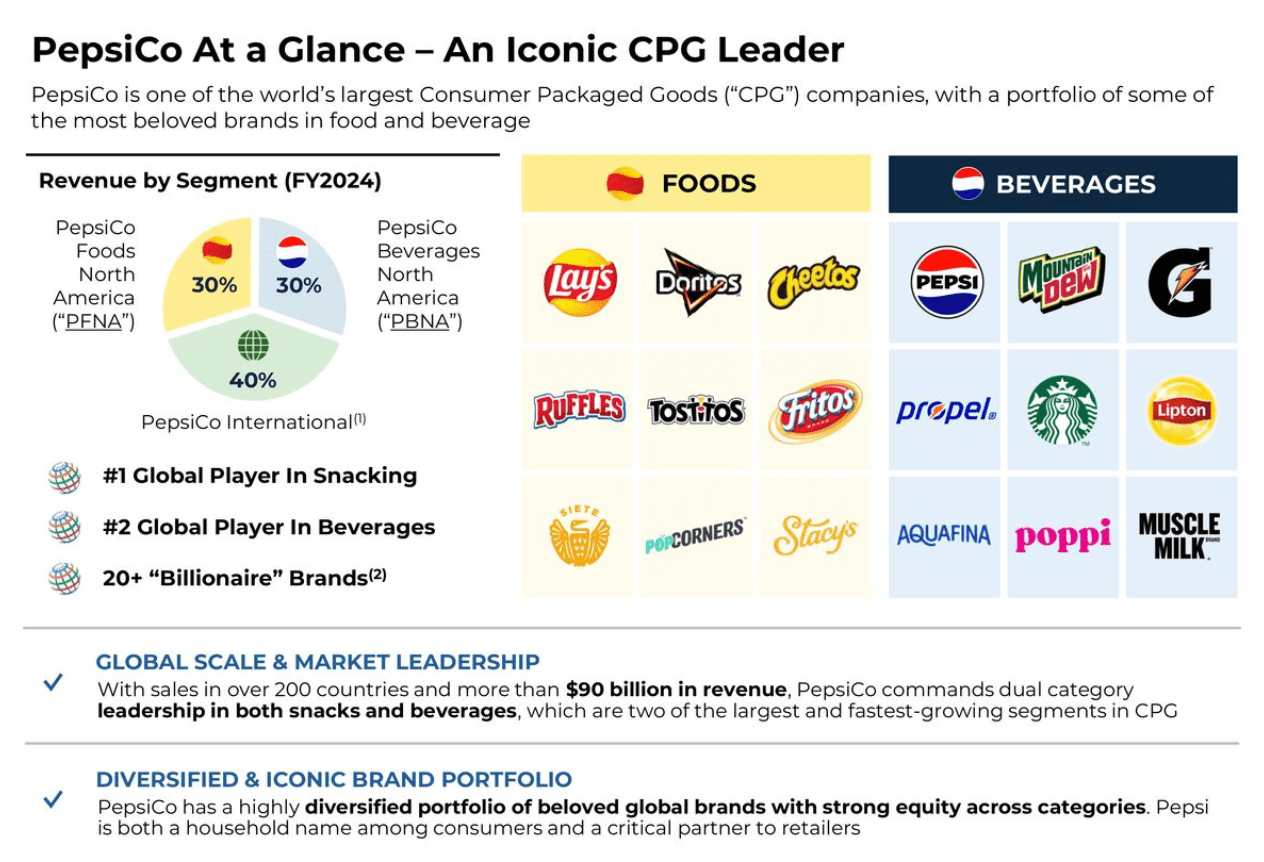
Last but not least, I would add PepsiCo (PEP), a company I owned from 2020 until I sold it to free up cash for my Albania investment a few months ago (see this article). Currently yielding 4.0%, the company has been targeted by Elliott Management to improve its business.
The company, which owns some of the world’s most favorite snacks and drinks (think of Lay’s and Pepsi), is the biggest snack player in the world, with at least 20 billion-dollar brands that compete with companies like Coca-Cola (KO).
Because of somewhat underwhelming growth and pressure on margins in recent years, the poor stock price performance has created the biggest discount in at least two decades, as we can see below. Trading at just 18x earnings, it trades at least four points below its long-term average.
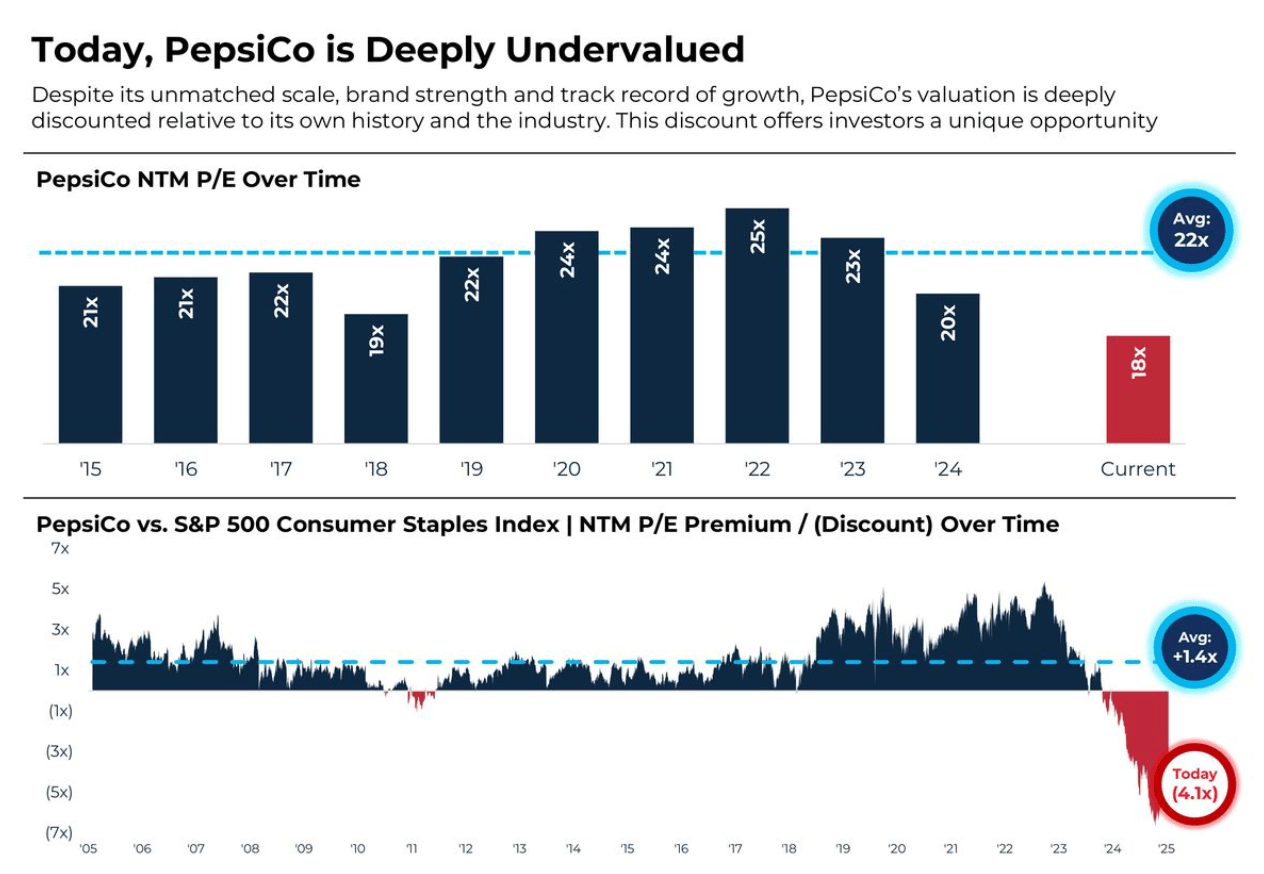
Now, Elliott sees a path to long-term double-digit earnings per share growth, which could benefit investors through higher earnings growth and a higher valuation. In the near-term, it sees upside of at least 50%, something I entirely agree on.
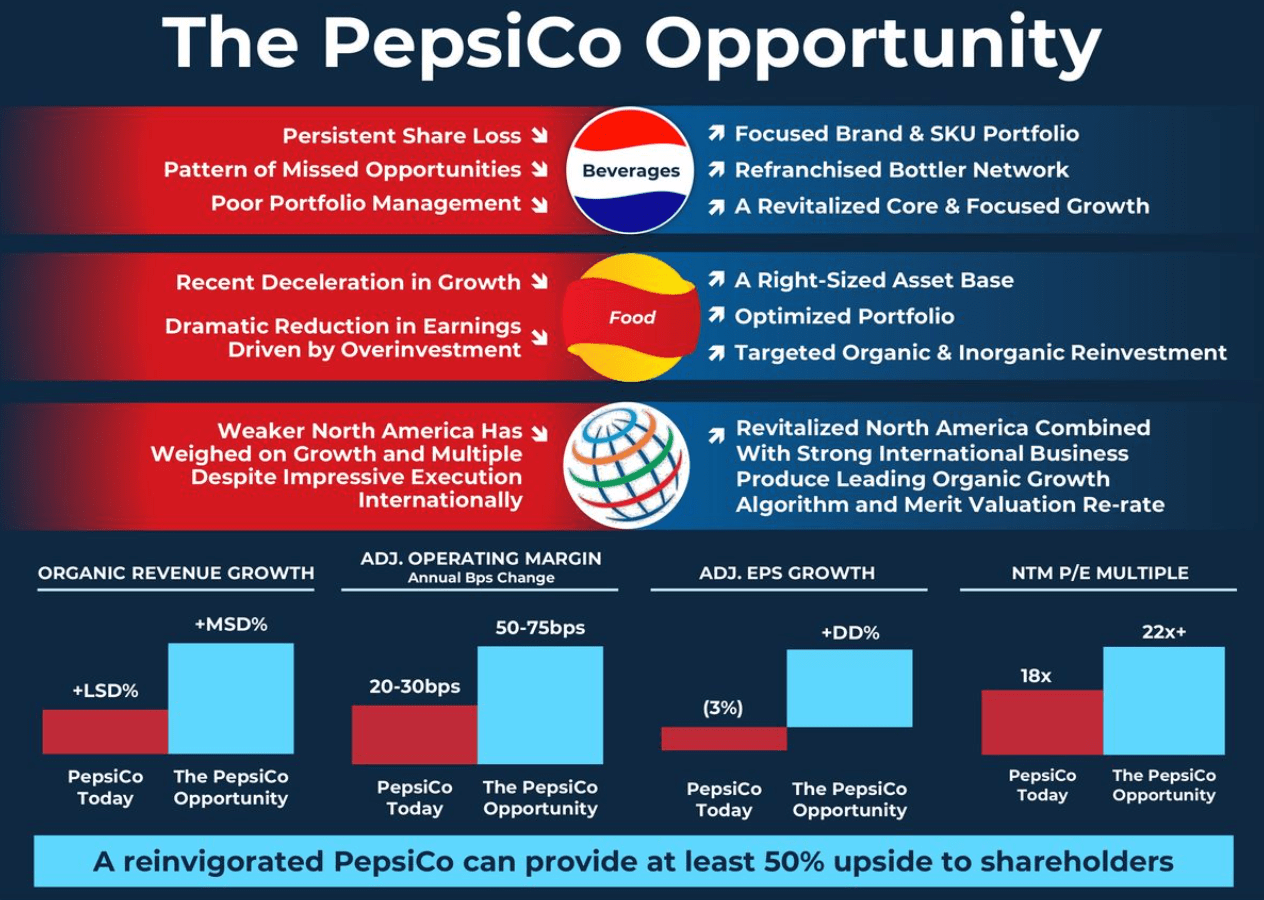
Even better, because of its diversified business model, PepsiCo has always been one of my favorite consumer staples and a prime stock for a retirement account.
That’s also why I believe we could see consistent dividend growth in the 6-8% range.
To me, PepsiCo is now a Strong Buy.
Putting everything together, these four picks have an average yield of 5.6%, a fantastic number in light of growth potential and safety.
I look forward to your view on this, and I can tell you I will continue to build on this portfolio, as I have a lot more ideas I didn’t mention in this article.
For now, this is my takeaway:
Takeaway
I’m never retiring. At least, if it’s up to me.
However, that doesn’t mean focusing on retirement investing isn’t super important, especially as we are dealing with a wide range of risks like “higher for longer” inflation, the Silver Tsunami creating Social Security headwinds, and massive AI disruption.
That’s why I’m better safe than sorry when it comes to preparing for retirement.
In this article, I discussed four stocks I would make the core of my retirement portfolio, as they deliver an average yield of slightly more than 5.5%, healthy payout ratios, solid balance sheets, and business models that should provide me with inflation-beating dividend growth.
In the weeks and months ahead, I’ll provide more ideas and look for ways to incorporate more growth in a retirement portfolio, a subject I believe is often neglected