Goldman Warns: Enjoy The Market Calm While It Lasts—October Chaos Is Coming
Piero Cingari
Wed, September 24, 2025
The best-performing September in 15 years just sent U.S. stock indexes to new highs — but that party could soon end, with Goldman Sachs expecting a surge in market volatility as October kicks off a gauntlet of earnings and macro risk.
With just days left in the month, the S&P 500, tracked by the Vanguard S&P 500 ETF (NYSE:VOO), is up 3.6%, on pace for its best September since 2010. That year, the index jumped 8.76%, while in 1997 it rose 6.22% — two of the only times the market defied September’s historically weak trend to this degree.
Tech stocks are doing even better. The Nasdaq 100, via the Invesco QQQ Trust (NASDAQ:QQQ), is up 5.5%, and the Technology Select Sector SPDR Fund (NYSE:XLK) has surged 7.5%, its second-strongest September since the ETF launched in 1999.
That’s not normal. Over the last 25 years, tech stocks have averaged a 2.2% loss in September.
But this year, names like Oracle Corp. (NYSE:ORCL), Tesla Inc. (NASDAQ:TSLA), Micron Technology Inc. (NASDAQ:MU) and Apple Inc. (NASDAQ:AAPL) have led a momentum surge fueled by AI demand and expectations of Federal Reserve rate cuts.
The result? A rare, almost euphoric September rally that feels more like July or December.
October Might Snap Investors Back To Reality
In a note published Tuesday, Goldman Sachs equity analyst John Marshall said the good times may not last. “Using history as a guide, we expect global equity volatility to increase in October.”
And the data supports that. Over the past several decades, realized volatility in October has been more than 25% higher than in other months, according to Goldman. The firm pointed to a long-standing pattern of surging trading activity, driven by corporate earnings pressure, year-end performance benchmarking and major macro catalysts.
“Event volatility could increase further as October earnings season is typically the most volatile of the year,” Goldman said, adding that FOMC meetings, Fed commentary, and the Consumer Price Index (CPI) report will all be in sharp focus.
October Is a Pressure Cooker for Wall Street
Goldman also noted that single stock trading volumes — both in shares and options — have historically peaked in October. From 1996 to 2024, the average daily notional volume of individual stocks and their options reached its highest point in October, reinforcing the idea that investors feel forced to act.
“We see this as further validating our hypothesis that performance pressure potentially drives investors to increase trading activity,” Goldman said.
The firm expects the volatility spike to be broad-based, but sees opportunities in single-stock options as a way to position around earnings-driven moves.
After a rare, euphoric September where stocks broadly defied seasonal gravity, October may come with a price. While earnings optimism and Fed tailwinds have powered this rally, volatility season is approaching — and traders might want to buckle up.
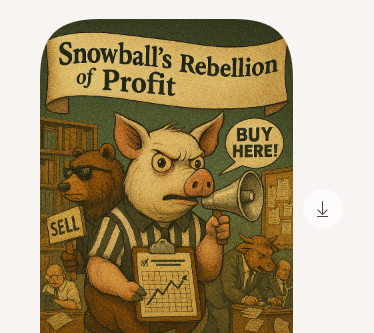
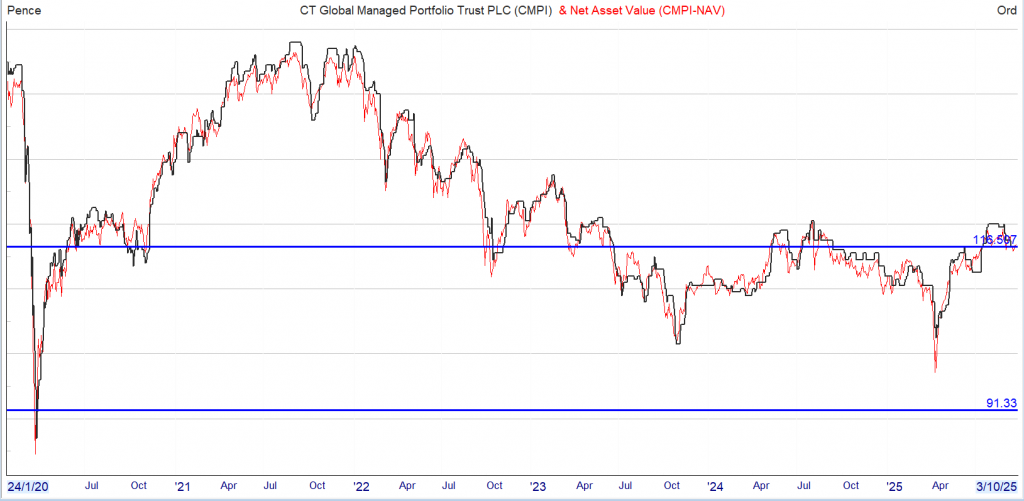
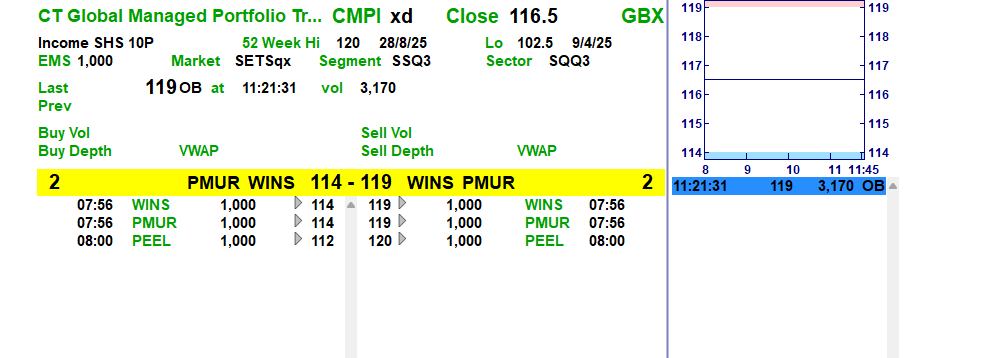
A wide spread, you could deal within the spread and buy at 116.4p but as with bacon and eggs, you would be committed.
The “Chicken and the Pig” fable illustrates the difference between involvement and commitment in a project. The chicken contributes by laying eggs, which is a routine task, while the pig makes a total commitment by sacrificing its life to provide bacon. This story emphasizes that while both the chicken and the pig are needed for success, they represent different levels of engagement: the chicken is involved but not committed, whereas the pig is fully invested in the outcome.
What ?
First Interim Dividend for the Financial Year to 31 May 2026
CT Global Managed Portfolio Trust PLC (the “Company”) announces a first interim dividend in respect of the financial year to 31 May 2026 of 1.90 pence per Income share.
This dividend is payable on 10 October 2025 to shareholders on the register on 12 September 2025, with an ex-dividend date of 11 September 2025.
This dividend represents an increase of 2.7% from the first interim dividend of 1.85 pence per Income share paid in respect of the financial year ended 31 May 2025.
The normal pattern for the Company is to pay four quarterly interim dividends per financial year.
As previously announced, in the absence of unforeseen circumstances, it is the Board’s intention to pay four quarterly interim dividends, each of at least 1.90 pence per Income share, so that the aggregate dividends for the financial year to 31 May 2026 will be at least 7.60 pence per Income share (2025: 7.60 pence per Income share).
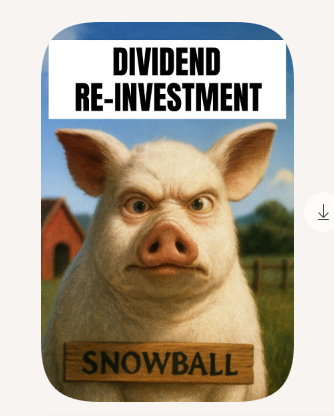
A yield of 6.5%, with all earned dividends re-invested into another higher yielding Trust, with the outside chance of a capital gain as many of the shares are unloved by Mr. Market.
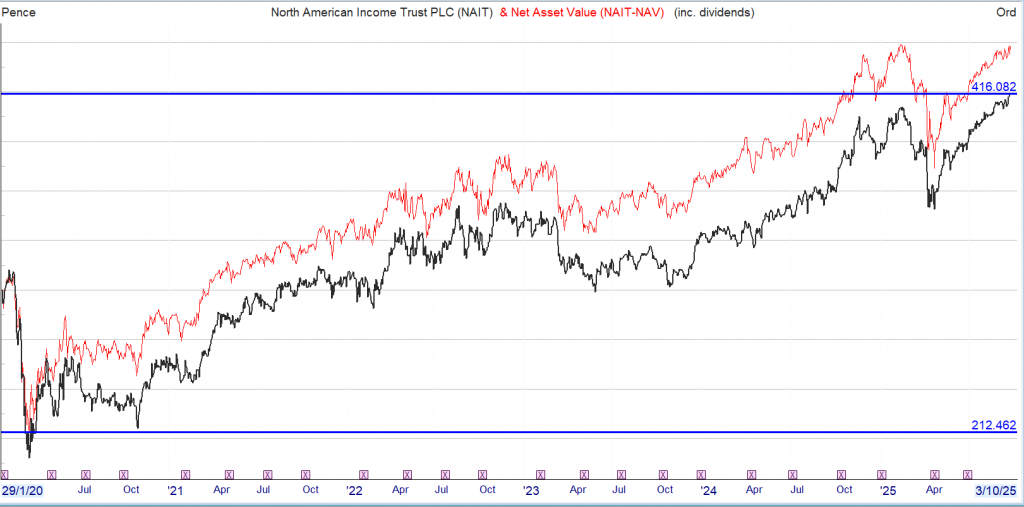
North American Income Trust PLC on Wednesday reported an increased interim dividend, as it expressed confidence in its portfolio’s resilience amid challenges from tariffs and fiscal policy.
The Edinburgh-based investor in US equities reported a net asset value per share of 367.9 pence at July 31, down 3.0% from 379.2p at January 31.
NAV per share total return, including dividends reinvested, was negative 1.2% for the half year. Reference indices the Russell 1000 Value Index and the S&P High Yield Dividend Aristocrats Index lost 4.3% and 3.0%, respectively.
“The first half of our financial year has been challenging, with an initial steep fall in the US markets from February to mid-April caused by the US government’s introduction of tariffs on imports. In late April, as pauses to the implementation of tariffs were announced, markets staged a rapid recovery,” noted Chair Charles Park.
In terms of equities, power management company Eaton Corp provided the largest contribution to performance, as it reported strong sales and margin performance, said North American Income.
Semiconductor supplier Broadcom Inc also positively impacted performance, with it continuing to see “strong demand for its Application-Specific Integrated Circuits.”
The trust said pharmaceutical company Bristol-Myers Squibb Co underperformed, as it faced pressure from legacy drugs and a setback in a phase three schizophrenia trial. Information technology and management consulting company Accenture PLC also detracted from fund performance, as the stock derated amid AI-related threats to the consulting industry.
North American Income declared a second interim dividend of 2.8p per share bringing the total half-year dividend to 5.6p, up 3.7% from 5.4p a year prior.
Its shares were 0.2% lower at 351.43 pence on Wednesday morning in London.
“We believe that the high-quality nature of the company’s portfolio holdings should provide resilience against current external challenges, whether related to tariff implementations or new fiscal policies. From a valuation standpoint, we are comfortable with the average forward price to earnings multiple of approximately 16x for the companies in the portfolio. However, we have reduced positions in certain overextended market areas.
“Revenue-wise, dividend growth remains consistent with previous periods, thanks to the predictable cash flow and strong balance sheets of the companies in the portfolio. We continue to focus on resilient companies that do not rely on macroeconomic tailwinds for growth and possess the resources to invest in their future,” commented co-fund managers Fran Radano and Jeremiah Buckley.
Warren Buffett’s path to wealth is defined by a deceptively simple mantra: “Rule No. 1: Never lose money. Rule No. 2: Never forget Rule No. 1.” This principle isn’t about eliminating all risk, but about preserving capital and avoiding the kind of large, permanent losses that can devastate long-term returns.
The mathematics are punishing: lose 50% on an investment, and you’ll need a 100% gain just to break even. Buffett’s focus on capital preservation — through buying quality businesses, insisting on a margin of safety, and steering clear of speculation — has allowed him to generate above-average returns for decades.
How can I ‘get rich’?
But what does ‘getting rich’ mean? For some, it’s financial independence or the freedom to retire early; for others, it’s simply security and peace of mind. Whatever your definition, Buffett’s approach offers a blueprint.
Consider an investor who puts away £500 per month for 35 years, compounding at 10% annually. The result is astonishing. By year 35, their portfolio could grow to nearly £1.9m, with the majority of that growth coming from compounding returns rather than contributions.
Source: thecalculatorsite.com
The key is not just chasing high returns, but avoiding big mistakes and letting time and discipline work their magic. Buffett’s strategy is a lesson in patience, research, and risk management. By focusing on quality, understanding what you own, and refusing to let losses spiral, investors can steadily build wealth and, potentially, retire far earlier than they ever imagined.
The above graph shows the path to £1.9m in 35 years. This would be enough to comfortably deliver around £90,000 annually (tax-free in an ISA) without touching the principal.
However, it’s worth noting that £90,000 in 35 years is worth approximately £37,923 in today’s money. That’s assuming an average annual inflation rate of 2.5%. This calculation uses the present value formula, which discounts the future sum by the cumulative effect of inflation over 35 years.
The Bond God’s $4,000 Gold Call (and a “Dividend Twofer” to Profit)
Brett Owens, Chief Investment Strategist Updated: September 23, 2025
When DoubleLine CIO Jeffrey Gundlach speaks, we yield hounds listen.
Right now, the “Bond God” has gold on the brain. We’re dialed in, because his latest utterances are pointing the way to a sweet 7.4%-paying “gold-dividend twofer” for us.
I’m talking about a play for price upside in the near term, followed by big monthly dividends (yes, 7.4%, and maybe more) when the “discount trigger” we’ll talk about in a sec kicks in.
The Bond God Calls ’Em Like He Sees ’Em
The Bond God is a dyed-in-the-wool contrarian who holds a special place in our hearts because, well, he’s often right. The 2008/2009 crisis? He called it. Trump’s 2016 win? He called that, too, as well as the 2022 panic.
So we were eager to hear what Gundlach had to say following the Fed’s decision to cut rates by a quarter-point last week. And, as usual, he didn’t disappoint.
“I think almost certainly gold will close above $4,000 by the end of this year,” he said. (That’s not new—he’s been saying it since March.) Gold trades around $3,675 an ounce as I write this, down a bit from pre-rate-cut levels.
And then there was this, er, nugget, about the Fed’s rate cut, with more likely to follow: “I think there’s a risk of over-easing.”
Bessent Takes on the 10-Year—And Gold Is Loving It
The Bond God no doubt sees what we see: Recent (and likely future) moves by the administration and the Fed are likely to keep inflation worries—and with them gold’s winning streak—alive.
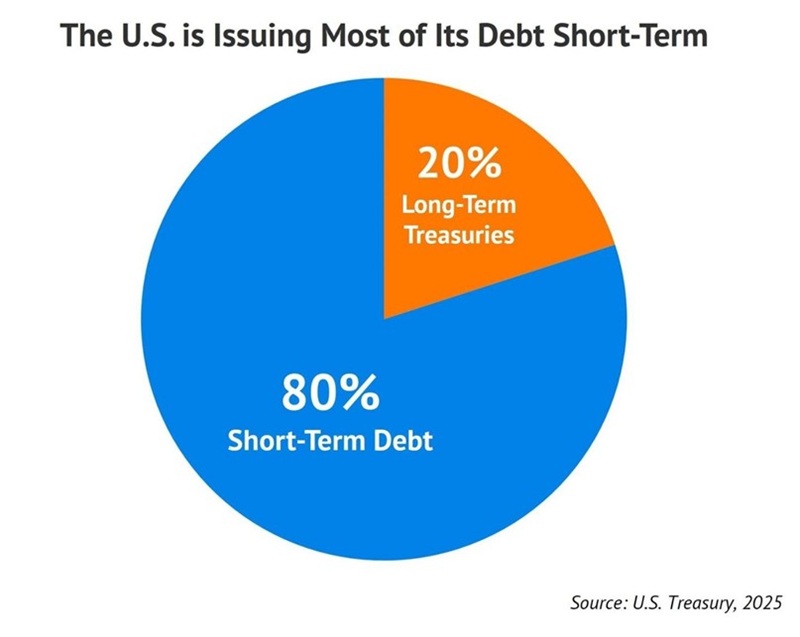
Let’s start with the administration, specifically Scott Bessent’s Treasury Department, which is doing something unusual: issuing 80% of the government’s debt on the short end of the yield curve.
By doing so, he’s decreasing supply of long-term Treasuries, boosting demand. That puts downward pressure on the 10-year Treasury yield, benchmark for consumer and business loans.
Uncle Sam wins, too, because the short end of the curve, set by the Fed, is usually lower than the long end. It also explains the pressure the administration is heaping on Powell: Lower short rates will save the government billions! Powell, for his part, is obliging, with two more quarter-point rate cuts expected by year-end.
Where does that leave us? With short-term rates falling and long-term rates capped—and potentially moving lower.
You don’t have to look far to see how falling Treasury rates ignite gold. It’s exactly what’s happened so far this year, with the gold-price benchmark SPDR Gold Shares (GLD), in purple, soaring as the yield on the 10-year (in orange) drops:
The Gold/10-Year Teeter Totter
This is likely what’s behind Gundlach’s thinking: As the Fed and Treasury bring rates lower—and keep inflation worries alive—gold will keep arcing higher.
Let’s, er, dig (sorry, couldn’t resist!) into those two gold plays I mentioned earlier, especially after the yellow metal pulled back a bit after last Wednesday’s rate cut.
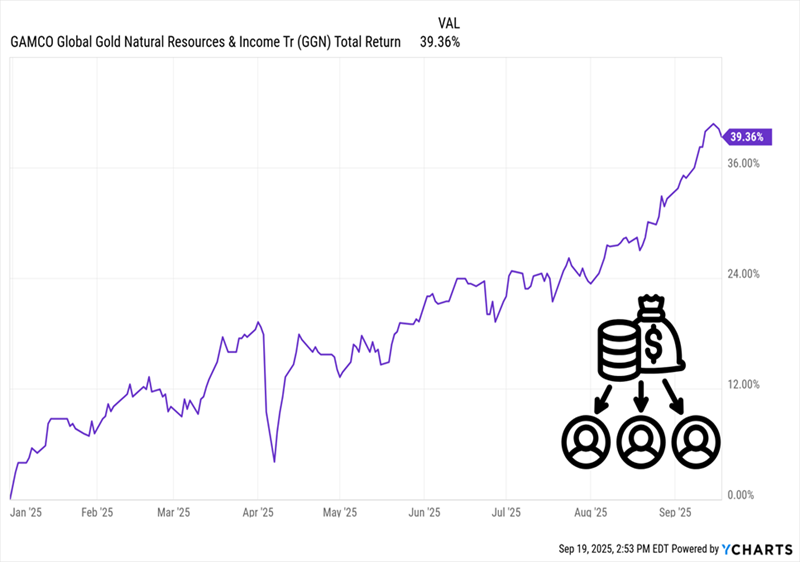
“Gold-Dividend Twofer” Step 1: Put This 7.4% Dividend on Your Watch List The 7.4%-paying GAMCO Global Gold, Natural Resources & Income Trust (GGN) is a smart way to tap gold for big (and monthly paid) dividends.
GGN holds mining stocks, including gold miners Alamos Gold (AGI), Kinross Gold (KGC) and UK-headquartered Endeavour Mining plc (EDVMF). It then sells covered-call options on its portfolio to generate that 7.4% income stream.
Using covered calls, GGN agrees to sell its stocks to a buyer at a future date and at a fixed price. In return, the buyer pays the fund a fee—or “premium,” which GGN keeps no matter how these trades play out.
It’s a great way to generate income, and it works particularly well with volatile stocks, like gold miners.
GGN cut its dividend mid-2020 and hasn’t raised it since. But recent portfolio gains could change that, as the fund’s total return NAV (or the return on its portfolio) has popped this year. That could prompt management to hand over a slice of these gains as a higher payout:
GGN’s Portfolio Soars. Payout Hike Next?
We know GGN well at my Dividend Swing Trader service. We hopped aboard this high-yielding gold fund back in May and, just over five months later, are sitting on a nice 23% total return as I write this.
We also like the fact that GGN goes beyond gold, as it also holds names like Freeport McMoRan (FCX), which focuses on copper, among its top-10 holdings. Energy stocks, like Chevron (CVX) and No. 1 holding Exxon Mobil (XOM), make an appearance, too. These additional resource stocks provide an added hedge against inflation.
The fund now trades at a 1% premium to NAV, so we’re waiting for the next dip buy on this one. Same goes for another high-yielding gold fund we’ve traded for short-term gains in the past. It’s already soared even higher than GGN—a 56% gain, to be exact—in about the same timeframe.
You’ll want to make sure you own GGN and this other 56% gainer before gold’s next bounce. The timing isn’t quite right yet, but we’re getting close. I’ll tell you exactly when to make your move in Dividend Swing Trader.
Which brings me to …
“Gold-Dividend Twofer” Step 2: Look to NEM for Growth
Now let’s move from a CEF to Newmont Corp. (NEM), the world’s biggest gold miner. It’s benefiting from a sweet combo of cheap energy and high gold that I see continuing. As I write this, the WTI crude price is around $64. That’s up a bit since oil hit the skids in the April “tariff tantrum,” but it’s still historically low.
Energy is a major cost for any miner. And with the administration’s energy policy being, quite literally, “Drill, baby, drill,” lower oil looks set to stick around.
At the same time, the selling price of NEM’s main output, gold, is around that $3,700 level mentioned earlier, potentially heading to $4,000 if our man Gundlach’s latest call is right (and there’s every reason to believe it is, given his track record).
I think you’ll agree that this is a very good setup for a gold miner. No wonder Newmont’s revenue soared 21% year over year in Q2, and EPS came within a penny of doubling, to $1.43 from $0.72.
Yet shares trade at 14-times forward earnings, below the five-year average of 18. Management’s busy buying that deal, announcing $3 billion in buybacks at the end of July.
NEM yields 1.3% and pays a base plus variable dividend, so payouts rise when gold does well. But the dividend is just 21% of NEM’s last 12 months of free cash flow, so it’s safe.
The Takeaway: Start With NEM, Add GGN When Its Discount Returns
The bottom line? NEM is worth a look now, especially with its moderate P/E and buybacks. Then, when the time is right for GGN, we’ll pounce and add that fund (and its rich dividend stream), too.
2 top UK dividend stocks offering effortless passive income
Ben McPoland highlights a pair of stocks from the FTSE 250 index that have tremendous track records of dividend growth.
Posted by Ben McPoland
Image source: Getty Images
When investing, your capital is at risk. The value of your investments can go down as well as up and you may get back less than you put in.Read More
The content of this article is provided for information purposes only and is not intended to be, nor does it constitute, any form of personal advice. Investments in a currency other than sterling are exposed to currency exchange risk. Currency exchange rates are constantly changing, which may affect the value of the investment in sterling terms. You could lose money in sterling even if the stock price rises in the currency of origin. Stocks listed on overseas exchanges may be subject to additional dealing and exchange rate charges, and may have other tax implications, and may not provide the same, or any, regulatory protection as in the UK.
You’re reading a free article with opinions that may differ from The Motley Fool’s Premium Investing Services.
One great thing about investing for passive income is that it can become very low maintenance. Once the initial research is done and the dividend stocks are tucked away in a portfolio, the only real upkeep is reading the company reports a couple of times a year.
Here, I’ll spotlight two dividend-paying investment trusts that I think are worth checking out for income.
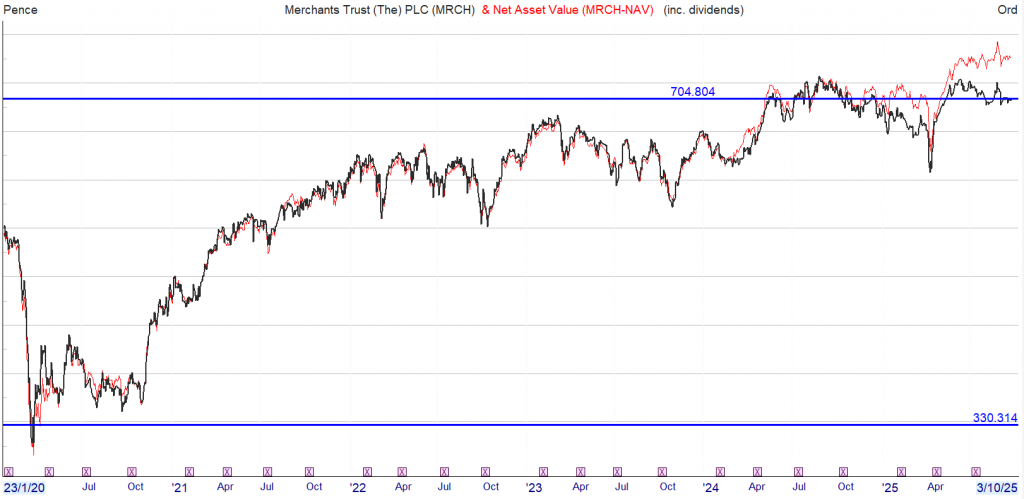
136 years old
Established in 1889, Merchants Trust (LSE:MRCH) is one of the UK’s oldest investment trusts. It’s listed in the FTSE 250 and aims to provide above-average income growth, as well as long-term capital appreciation.
Merchants holds 53 dividend stocks, including FTSE 100 staples such as GSK, Lloyds, Shell and BP. However, it isn’t afraid to bank profits and take positions in lesser-known companies.
For example, it recently trimmed strong performers including British American Tobacco, Barclays and Burberry. With the proceeds, Merchants started a new position in MONY Group, the company behind websites such as MoneySuperMarket and MoneySavingExpert.
Portfolio manager Simon Gergel says MONY “is attractive, given potential future growth and efficiency opportunities. This is backed by a strong balance sheet, healthy cash generation and a 6% dividend yield.”
The fact that Merchants’ portfolio is full of UK stocks adds some risk, because the economy is currently in a fragile state. Some of the holdings might struggle in this tough environment, resulting in weaker earnings and dividend growth.
The flip side to this, of course, is that tons of UK shares are cheap. And this inevitably creates opportunities, as Gergel points out: “We are finding numerous cheap UK companies to invest in, especially among the medium-sized businesses. These have been largely shunned by investors and many are offering compelling value, even allowing for subdued domestic growth in the short term“.
In this spirit, Merchants recently added three building-related companies: building products supplier Marshalls, housebuilder Barratt Redrow and building materials distributor Grafton.
The stock sports a decent 5.4% dividend yield. And it’s currently trading at an 8.2% discount to net asset value (NAV), suggesting there’s solid value here.
Of course, no dividend is guaranteed. But I find it encouraging that Merchants has increased its annual pay out for 43 consecutive years.
Infrastructure
3i Infrastructure (LSE:3IN) is also in the FTSE 250, but has stakes in unlisted infrastructure companies across the UK and Europe. These range from offshore wind vessels and fibre communications networks to biogas plants.
One immediate risk here is that these are illiquid, private infrastructure assets. In other words, they can’t be easily offloaded if something goes wrong, and the portfolio’s quite concentrated (just 11 companies).
However, infrastructure assets tend to generate stable cash flows, and last year the dividend increased 6.3% to 12.65p per share. For this year (FY26, which ends in March), the payout’s expected to rise another 6.3% to 13.45p. Then goes up to 14.2p next year.
This put the forward dividend yield at a respectable 4%.
3i Infrastructure has a strong track record of successful investment exits. Since going public in 2007, it has generated a 14% annualised NAV total return.
The trust’s excellently managed by the FTSE 100’s 3i Group, which has a 29% stake. And it’s currently trading at an 8.6% discount to NAV, suggesting value is also on offer.
NAV total return was broadly flat over the six-month period (-0.2%). The positive contribution from macroeconomic updates, including revised UK inflation forecasts, a reduction in Finnish corporate tax, and FX tailwinds, combined with dividends and share buybacks, were offset by an increase in discount rates and weaker power price forecasts. Revenues remain well protected, with 85% fixed over the next two years, helping to mitigate much of the power price volatility. Development-stage asset valuations also saw a modest net decline, primarily due to headwinds in the floating offshore wind sector affecting Simply Blue. Further details on the NAV per share movements can be found in the interim report.
We continued to deliver against our progressive dividend policy, paying 3.08p per Ordinary Share over the first half, in line with the full-year 2025 target of 6.17p per share. This target, increased by 2.5% from FY 2024 in line with UK CPI, marks the fourth consecutive year of inflation-linked increases and is expected to be fully covered by operating cash flows. Total dividend payments amounted to £16.8 million during H1 2025.
ORIT continues to offer shareholders an attractive income profile. Based on the FY 2025 dividend target of 6.17p, and the share price of 73.4p as at 30 June 2025, the implied dividend yield is 8.4%. This supported a total shareholder return of 12.9% over the first half of this financial year, reflecting both income and share price appreciation. While the share price has since retraced to 66.0p as at 15 September, the implied yield has correspondingly increased to 9.3%, reinforcing the strength of ORIT’s income proposition in volatile markets.
Launch of ‘ORIT 2030’ – A strategic roadmap for growth
Existing capital allocation commitments remain in place for 2025
Core focus on NAV growth through investment into construction and developer assets
A clear plan to create further impact through adding new renewable capacity
Proposing a continuation vote every three years
Octopus Renewables Infrastructure Trust plc, the diversified renewables infrastructure company, today announces the launch of ORIT 2030, a defined five-year strategy designed to deliver substantial net-asset-value (“NAV”) growth, scale the company to £1 billion and generate attractive medium-to-long-term shareholder returns. The Board is also recommending that the Company’s continuation vote moves to every three years, from the current five-year cycle.
The three core goals of the 2025 Capital Allocation Update in March remain unchanged for this financial year.
2025 Capital Allocation Objectives and Update
1. An extended share buyback programme totalling £30 million
· £21.6 million shares repurchased to 15 September 2025
· Balance to be retained to make further purchases as required
2. A commitment to reduce debt to under 40% of Gross Asset Value (“GAV”)
· 47% at 15 September 2025; asset sales anticipated to bring this figure down
· On track to reduce debt to below 40% of GAV by year end
3. A pledge to sell at least £80 million of assets to pay down debt and make a small number of selective investments where they are deemed to be accretive
· Several sales processes advanced; on track to realise the £80m target by year end
· Selective investments made into developers Nordic Generation, BLC Energy, and conditional acquisition of Irishtown
Thereafter the Board and Octopus Energy Generation (the “Investment Manager”) will execute ORIT 2030, which is focused on the four strategic priorities set out below:
1. Grow: Invest for NAV growth
· Deploy capital into higher returning investments
o Increase target portfolio allocation to ~20% in construction assets
o Maintain 5% allocation to developer assets
· Accelerate NAV growth through a repeatable process of recycling, investment, improving operational performance and enhancing the value of assets
2. Scale:Build a larger, more investable company
· Target £1 billion net asset value by 2030, to create a more liquid and investable company
· Achieved through disciplined capital deployment and organic NAV growth, alongside potential value-accretive corporate M&A
· Share buybacks as a tool subject to market conditions and capital allocation priorities
3. Return: Deliver attractive risk-adjusted total returns
· Target medium-to-long-term total returns of 9-11% through a combination of capital growth and income
· Maintain existing progressive dividend policy, while preserving full cover
· Prudent balance sheet management, with leverage anchored at <40% GAV with the flexibility to move temporarily above this for value-accretive opportunities and strategic recycling
· Retain diversification across core technologies and geographies
4. Impact:Scale with purpose and resilience
· Aim to build approximately 100 MW of new renewable capacity per annum
· Sustain ORIT’s mandate, enabling new clean energy generation and supporting the energy transition
Continuation Vote
In addition to the above, the Board is recommending that the continuation vote moves to a cycle of every three years, from the current five. A resolution to this effect will be put to shareholders at the 2026 AGM and, if approved, the next continuation vote will take place at the Company’s 2028 AGM. The change is intended to give shareholders more frequent opportunities to assess the future of the Company, while reinforcing ORIT’s commitment to accountability and alignment with investor interests.
Phil Austin, Chair of Octopus Renewables Infrastructure Trust plc, commented: “ORIT 2030 marks the next phase in the Company’s development. This clear five-year strategy aims to scale ORIT significantly, drive NAV growth through investment into construction and development assets and – underpinned by resilient cash flows – maintain progressive fully-covered dividends.
“More than 90% of shareholders backed the Company at its continuation vote in June, indicating strong support for ORIT’s future, yet it has also been made clear from our active dialogue with investors that they want the Company to become larger, more investable and to stay true to its purpose. ORIT 2030 addresses this directly with a plan that balances yield, growth and impact, ensuring the Company delivers for shareholders, while supporting the energy transition.
“With disciplined capital management and the expertise of our Investment Manager, we believe we are well placed to execute ORIT 2030 and to pursue our ambition of building a £1 billion renewables vehicle by 2030.”