
You need not take big risks with your hard earned.
But you may need a bit of luck, nonetheless

Investment Trust Dividends
You need not take big risks with your hard earned.
But you may need a bit of luck, nonetheless

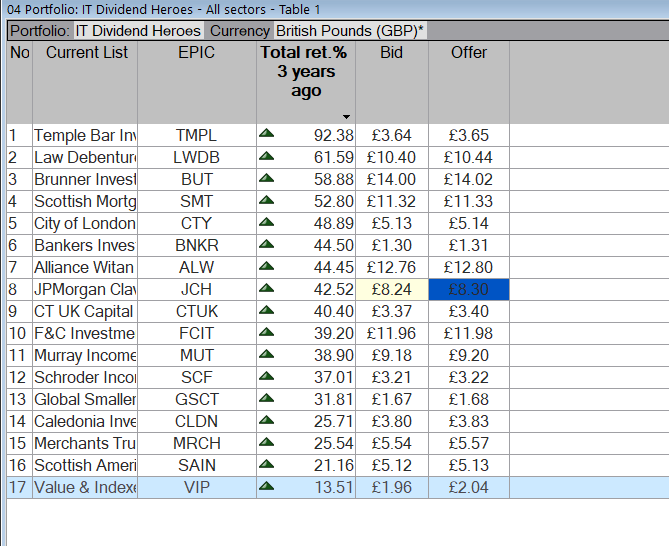
10k of the Snowballs cash will be re-invested in PHP, the yield after the takeover of Assura is not 100% certain but it’s one of the safest yields in the market with the chance of a modest increase in value.
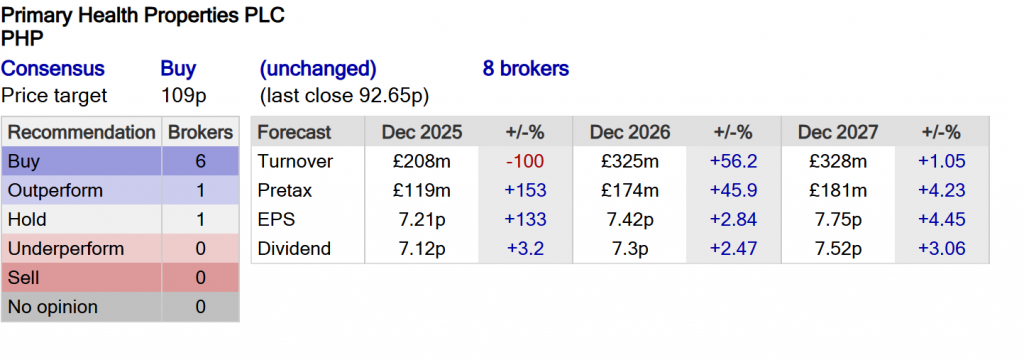
Stifel raises Primary Health Properties to ‘buy’ (hold) – price target 105 (92) pence.
Barclays reinitiates Primary Health Properties with ‘overweight’.
Currently trading xd

Notice of Interim Dividend
The Company announces that the fourth quarterly interim dividend in 2025 of 1.775 pence per ordinary share of 12.5 pence each will be paid as an ordinary dividend on 21 November 2025 to shareholders on the register on 10 October 2025.
Current yield 7.5%


Contatrian Investor
Turn Your Portfolio Into a Monthly Income Machine |
Fortunately for you and me, the financial markets aren’t 100% efficient. And some corners are even less mature and less combed through than others.
These corners provide us contrarians with stable income opportunities that are both safe and lucrative.
There are anomalies in high yield. In an efficient market, you wouldn’t expect funds that pay big dividends today to also put up solid price gains, too.
We’re taught that it’s an either/or relationship between yield and upside – we can either collect dividends today or enjoy upside tomorrow, but not both.
But that’s simply not true in real life. Otherwise, why would these monthly payers put up serious annualized returns in the last 10 years while boasting outsized dividend yields?
For example, take a look at these 5 incredible funds that pay monthly and soar:

This is the key to a true “9% Monthly Payer Portfolio” – banking enough yields to live on while steadily growing your capital. It’s literally the difference between dying broke and never running out of money!

Michael Foster, Investment Strategist
Updated: October 20, 2025
Business development companies (BDCs) have gained popularity in recent years, but they still don’t get as much attention as they should. Which is too bad, because they pay life-changing (no exaggeration here) dividends.
The two we’ll look at below yield more than 12.9%. In other words, drop $10,000 in and you’re getting $1,290+ back in dividends every year.
That makes BDCs useful tools for retirees. They’re also a “best friend” to what I’ll call “middle market” companies—those that are too big to borrow from a local bank but too small to interest big, institutional players like, say, a Goldman Sachs (GS).
So it’s no surprise that BDCs have started to make it on to the mainstream crowd’s radar. But—these days especially—we do need to be careful with them.
I’ll get into why—and why I prefer another high-yielding asset class to BDCs right now—in a second. But for starters, let me just say that it’s vital to avoid BDCs with two main flaws: 1) Those that are too specialized in one sector and/or 2) Those that are saddled with sky-high management fees.
Let’s start with that first point—a BDC too focused on one sector. We’ll do that by looking at the 16.6%-yielding (!) TriplePoint Venture Growth BDC Corp. (TPVG), which mainly lends to companies in the tech sector. Trouble is, on a total-return basis—so including reinvested dividends—the fund is down 15% this year, as of this writing.
This in a year where tech in general is up over 21%, as measured by the Vanguard Information Technology ETF (VGT) index fund. You’d have been better off buying the ETF—or better still, the high-yielding tech-focused closed-end fund (CEF) we’ll get to shortly!
Mainstream Tech ETF Crushes Tech-Focused BDC (Despite Its 16.6% Dividend)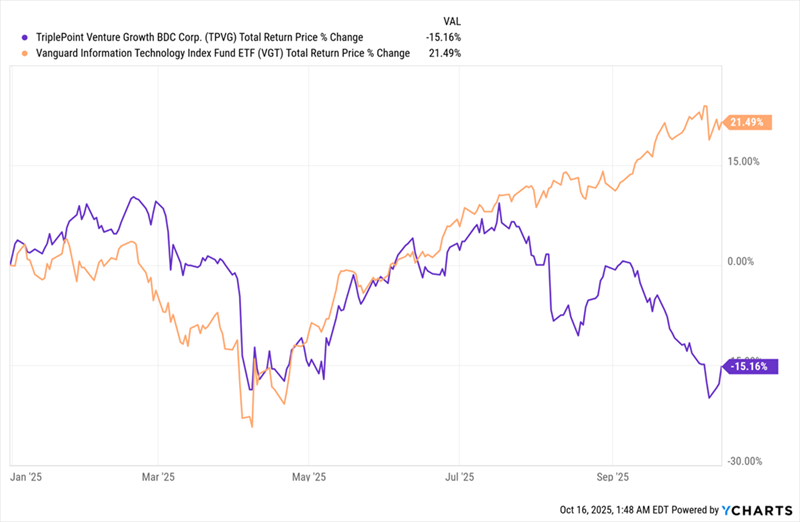
Now let’s talk about that second “BDC trap,” which is very easy to miss: high management fees.
As I said a second ago, BDCs’ borrowers are usually too small for big banks to take on, but that hasn’t stopped big banks from getting into the game by launching their own BDCs. Even Goldman has its own BDC—the unimaginatively named (and 12.9%-yielding) Goldman Sachs BDC (GSBD).
This one launched a decade ago and has trailed the S&P 500 by a huge margin.
S&P 500: 1, GSBD: 0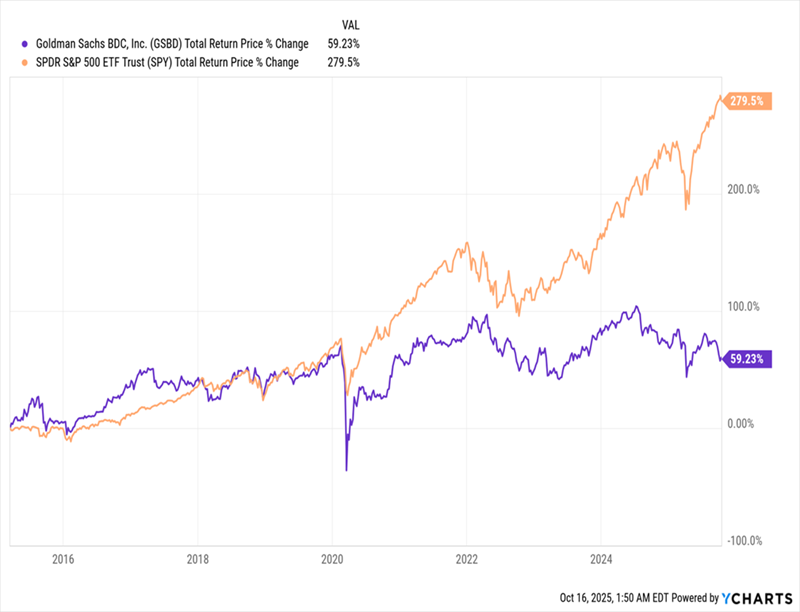
Beyond that, the BDC charged about 3.9% in fees ($35.2 million in base fees and $23.9 in incentive fees on about $1.5 billion in assets) in 2024, and a similarly high fee bill is accruing for investors in 2025. With so much in fees going to management, it’s tough for the portfolio to generate enough to cover the dividend, too.
Yet many investors overlook that, distracted as they are by GSBD’s outsized yield.
Income investors who want to boost the yield in their portfolio buy BDCs in the hopes that these companies can keep maintaining those big payouts by doing bigger deals that cover their ongoing expenses.
That does work sometimes, but not all the time. In the cases of both GSBD and TPVG, we saw dividends remain reliable—until quite recently.
TPVG, for its part, cut its regular dividend last year, and as a result, shareholders are getting less than they were expecting. Thus, the BDC’s 16.6% yield looks good today, but it will get smaller tomorrow—and the shares could drop again when that happens.
Thus GSBD seems safer, since its payouts have actually gone up since its IPO. But this is an illusion. If you look at the company’s income statement, you see the problem.
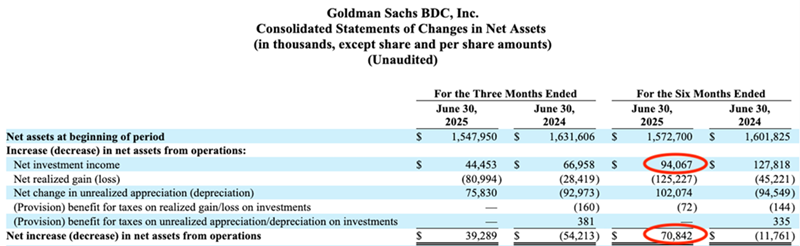
Source: US Securities and Exchange Commission
In the first six months of 2025, GSBD earned $94.1 million in investment income, which comes out to about a 12.4% annualized return on the fund’s net assets. At a 12.9% yield, GSBD is coming up just shy of covering the dividend.
Except the net increase in GSBD was much less than that because of a $125-million loss in its portfolio, meaning the net annualized return for the good loans in its portfolio after accounting for losses on the bad loans was 9.4%, still good and enough to cover much of the dividend—but not all.
In fact, if this keeps up, about 40 cents per share of dividends will need to be slashed—lowering GSBD’s yield from its 13% level to more like 9%.
Forget GSBD and TPVG: This CEF Is a Much Safer Play
I’m not saying all BDCs are risky—just that we need to pay close attention to not only how they are run but who they lend to. BDCs can run afoul of situations like First Brands, an auto parts supplier that recently declared bankruptcy. In all, 14 BDCs were invested in the firm (but not GSBD and TPVG).
This is not a risk that affects CEFs that invest in blue chip stocks. Consider, for example, a tech-focused CEF called the Columbia Seligman Premium Technology Growth Fund (STK), which has done three impressive things over the last decade. First, the fund (in blue below) has beaten both the S&P 500 (in orange) and GSBD (in purple) as of this writing.
STK Outruns Stocks and Its BDC “Cousin”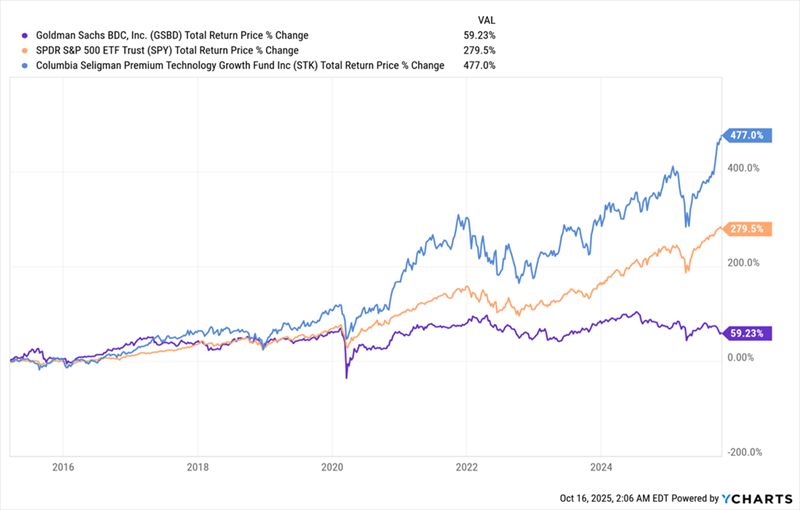
Second, its 5% dividend not only has never been cut—it’s also been bolstered by several special dividends (the spikes and dips in the chart below) over time.
STK’s Special Dividend Parade Keeps Rolling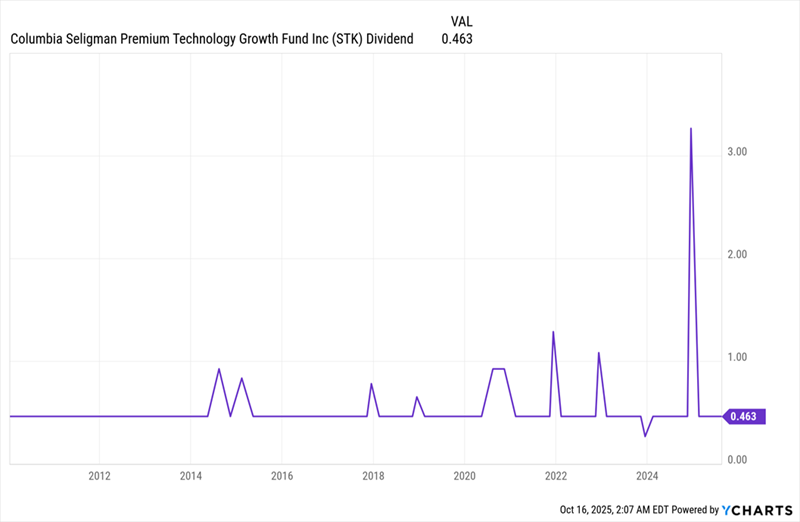
Finally, it’s done this by holding liquid, conservative mega-cap names like Apple (AAPL), Amazon.com (AMZN) and Cisco Systems (CSCO).
And even after its recent run, STK is cheap, trading at a 5.3% discount to net asset value (NAV, or the value of its underlying portfolio) as I write this. That’s far below its five-year average of a 3.1% premium, setting up a nice (and rare) opportunity to buy its portfolio of top-notch tech stocks for 95 cents on the dollar.
With fewer risks, bigger returns and a generous yield, STK is a compelling alternative to a BDC focusing on the same sector, like TPVG. And STK’s dividend is actually small compared to that of the average CEF, which yields 8.4%. That means you can boost your yield with other, higher paying CEFs without increasing your risk.

From The Telegraph Editor
Good afternoon.
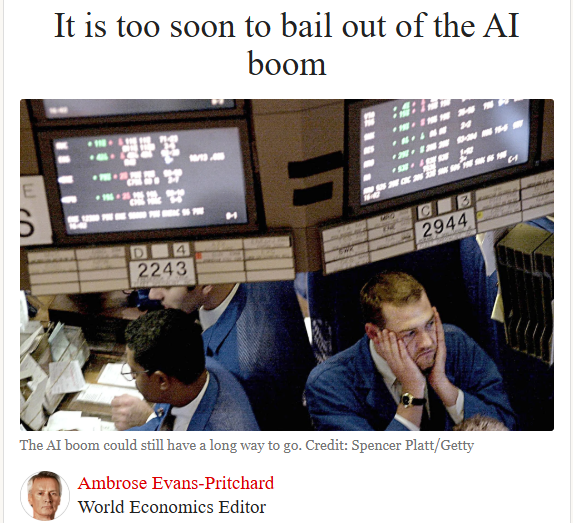
This week, Ambrose Evans-Pritchard outlines how today’s tech boom is different from that of 25 years ago; while Jeremy Warner argues that Britain’s rampant compensation culture is stifling economic growth.
Ambrose Evans-Pritchard
World Economics Editor
Wall Street equity bubbles do not end just because prices are stretched to extremes. They typically keep running until the US Federal Reserve turns off the credit spigot and forces capitulation.

It may be true that America’s AI boom is showing signs of mass delusion. Nvidia, Meta, Google, Microsoft, Palantir, Tesla or Strategy – take your pick, add au goût – are close to defying the laws of commercial and geopolitical gravity. We may already be deep into greater fool territory.
But that does not preclude a further parabolic rally over the next 12 to 18 months before resurgent inflation compels the Fed – even a captive Fed, once Donald Trump has completed his hostile takeover – to break the fever. A view is taking hold in hedge-fund land that the US is more likely to see an overheating blow-off in early 2026 than a stock market crash.
Every big bubble of the last century was popped by the Fed, either deliberately or by accident.
The New York Fed set out to kill the electrification and radio boom of the Roaring Twenties as early as January 1928, fearing that margin buying at 10 times leverage was feeding dangerous speculation.
The Fed “succeeded” but not until the Dow index had risen a further 65pc by October 1929.
It killed the telecom and dotcom bubble in 2000 by raising rates 175 basis points in the final year of the cycle. By then, US fiscal policy was also extremely tight. The budget surplus was 2.3pc of GDP.
It killed the subprime credit bubble by raising rates 425 points in two years, plateauing at 5.25pc in August 2006. By then, traders at the coal face could already see trouble in a slew of exotic “sliced-and-diced” mortgage securities. The party went on. Bear Stearns (RIP) and Lehman Brothers (RIP) kept rising to giddier heights. Wall Street did not peak until October 2007.
Lesson one is that a bull market with attitude can go on longer than most short-sellers can stay solvent. Lesson two is that it takes iron-fisted policy tightening to stop the stampede.
None of these market crashes has much in common with the monetary cycle of the Fed today or with the fiscal recklessness of Maga Washington. The Powell Fed is cutting rates even though inflation is above target. The budget deficit is 6.2pc of GDP.
“Financial conditions remain very accommodative,” said Pierre-Olivier Gourinchas, the International Monetary Fund’s chief economist. This is an understatement. The average risk spread on BBB corporate debt is near an all-time low of 100 basis points.
Dario Perkins, from TS Lombard, said Trump’s tariffs have temporarily tightened fiscal policy by 1pc of GDP this year: tax cuts in the “one big beautiful bill act” will offset this with loosening of 1pc in 2026.
“You’ve got this big fiscal swing from contraction to stimulus going into next year. The Fed is cutting rates again and that revives housing and construction quite quickly. It’s a big boost to small companies because of the way they finance their debt,” he said.
“All year, central banks around the world have been cutting rates and that is beginning to feed through to credit. You’ve got fiscal stimulus in Germany and potentially from China. All of this is reflationary,” he said.
Mike Wilson, the equity chief at Morgan Stanley, said the US has already been through a series of “rolling recessions” – one after another, hitting consumer goods, housing, manufacturing, transport and finally the Doge purge of the government itself.
“It has effectively rolled through the entire economy,” he said, arguing that the US is now in the classic early phase of a new business cycle.
The Bank of England’s Financial Policy Committee has flagged parallels between AI mania and the internet mania of the late 1990s, fearing an equity rout if AI fails to deliver.
It said the market share of the S&P 500’s top five companies has hit 30pc, “higher than at any point in the past 50 years”. The cyclically adjusted price-to-earnings (Cape) ratio is close to its lowest level in 25 years, “comparable to the peak of the dotcom bubble”.
It said lack of electricity could choke the AI boom, as indeed it might since Trump is waging a culture war on wind and solar – the fastest way to increase power in the US. It warned of supply chain bottlenecks and “conceptual breakthroughs” that suddenly change the AI business model – an allusion to the DeepSeek shock.
All of this is true but it is not yet imminent and the parallel with 2000 goes only so far. Dotcom stars mostly had shallow roots, thin revenues and were often little more than a website. The giants controlling most of the AI industry have deep pockets, real earnings, low debt and entrenched market share. They can take a big hit.
Stephen Jen and Joana Freire from SLJ Capital think the AI boom still has a long way to go.
“We are only at base camp compared to the price action in 1999-2000,” they said.
The P/E ratio of tech stocks was 72 in 2000, compared to nearer 30 today. They said AI is a national security imperative in an existential tech race with China. Nobody had a thought for China during the dotcom bubble.
What could spoil the picture? We could certainly see an economic “growth scare” before the next upward leg of the market.
The US is at the nadir of the policy cycle right now. The US government shutdown is dragging on and 100,000 federal employees are being laid off this quarter. The growth in private jobs has stalled.
JP Morgan’s proprietary credit card data show that retail sales hit a wall in September.
“There is a good chance real incomes will contract in the coming several months,” said the bank.

However, I strongly doubt that the Fed will let this metastasise into a self-feeding recessionary process or that it can even operate any longer as a scientific central bank. Trump is taking over the Fed Board and will progressively compel it to suppress rates far enough to drive a hot economy until the midterm elections next year.
He has appointed his guru Stephen Miran to the Fed with an easy money voodoo agenda – technically, Miran claims that the “neutral” rate of interest is two percentage points lower than Fed experts think. Trump is waging a war of harassment against legacy appointees, either to drive them out or to intimidate them into towing the line on premature rate cuts.
Trump will own as much of the Fed as he needs by mid-2026. I struggle to see how there can be a lasting stock market crash over the next year in this debauched politico-monetary setting.
In the end, re-accelerating inflation could – and will again – push up Treasury yields and short-circuit the asset boom. Should that happen, I have no doubt that the Trump treasury would strong-arm the Fed into capping yields by means of financial repression – as happened in the late 1940s.
If Trump is willing to commit $20bn (£15bn) from the US treasury’s emergency fund – or is it now $40bn? – to buy Argentine pesos and rescue the drowning Javier Milei, he will do anything.
Ultimately, Trump will run out of options and face his own intractable inflation crisis. But that is a story for the middle of his presidency.
It is too soon to bail out of AI mania. At the risk of sticking my neck out too far, I think any further sell-off on Wall Street should be treated as a fresh chance to buy. Keep your nerve.

I’ve sold SEIT on valuation grounds for a profit of £1,463.00 after the share has risen 35% from its low. It still trades on a discount of 35% to NAV so could have further to travel.
I’ve used part of the funds to buy another 4926 shares in ORIT for 3k.
I’ll re-invest the balance maybe tomorrow.


John Scott, the outgoing chair of Bluefield Solar Income (BSIF), has warned shareholders in the renewables fund that the “business as usual” option is unavailable as he held out the prospect of the double-digit yielder merging with its fund manager Bluefield Partners and cutting its payout.
Delivering his last annual report, Scott said the £493m investment company had responded well to the challenges of the last three years when interest rates had soared and capital markets had effectively closed to the sector with its shares sliding to a 30% discount to net asset value (NAV), preventing conventional fund raising.
While a partnership with pension funds had enabled the company to recycle capital from its portfolio, supporting a high dividend, a £20m share buyback programme and reinvestment in the portfolio, he said shareholders needed to be aware that the absence of additional equity and cheap debt would require the sale of its pipeline assets.
“Such disposals will gradually starve the company of growth opportunities and confine BSIF to its current position, namely the steady erosion of the company’s NAV, reflecting attrition of our capital base, with returns delivered only in the form of income,” he said.
Following earlier efforts to sell the company, Scott said it was clear there was widespread investor support for renewables – despite efforts by right-wing politicians to reverse the move to clean energy – and that BSIF’s value lay in the combination of its operational solar portfolio combined with the development platform of Bluefield Partners.
“The board is therefore considering other paths for the future of BSIF, including options that could see it move towards a more integrated business model which is better placed to capture the growth opportunity that eludes shareholders in the company’s current form, but is more readily available in an integrated Bluefield model,” said Scott.
Initial discussions with Bluefield showed this could be attractive to both the company and its investment adviser.
“Integrating the Bluefield Group’s 140-person platform, covering development activities through to operations, would create a UK-focused green independent power producer, one that with the appropriate capital structure, corporate debt and dividend policies could be a largely self-funded growth model,” he added.
Scott said the transition would require a thorough re-examination of the 10.7%-yielder and its dividend policy to assess how much of its income “we would be able to distribute if we are to fund our pipeline from retained earnings and additional borrowings”.
The shares fell 3.2% to 80.6p
The results showed that despite a second half recovery in irradiation, the net asset value of the portfolio of 122 solar plants, six wind farms and 109 small scale onshore wind turbines fell to 116.56p per share at 30 June from 129.75p a year earlier. Total underlying earnings per share dipped from 10.57p to 10.4pp covering 8.9p of dividends, raised from 8.8p in the previous year. A target of 9p has been set for the current 2026 year.
James Carthew, head of investment company research, said: “At QuotedData, we have been discussing amongst the analysts what is the way forward for the renewable energy sector. It felt to us as though BSIF was the most likely of the companies in the sector to transition from an investment company to a trading company.
“That seems to be the board’s preferred path. The chairman’s statement makes it clear that one of the casualties of this might be the current high dividend, although the board has indicated that the dividend will rise slightly to 9p for the current financial year.
“We want to see the sector used as an engine to drive the process of decarbonising the UK economy. The government could have done more to encourage this but issues such as the cost disclosure problem have actively frustrated it. BSIF’s proposals will need careful scrutiny, to ensure that BSIF shareholders are not disadvantaged relative to the managers. We await the next step with considerable interest.”

I’ve bought for the Snowball 1586 shares in ORIT Octopus Renewables for 1k.

Or why the Snowball only invests in Investment Trusts and ETF’s
Is it possible to start buying shares with one twentieth of one’s earnings? This writer explains how a would-be investor could aim to go about it.
Posted by Christopher Ruane
Published 4 October

When investing, your capital is at risk. The value of your investments can go down as well as up and you may get back less than you put in.
The content of this article is provided for information purposes only and is not intended to be, nor does it constitute, any form of personal advice. Investments in a currency other than sterling are exposed to currency exchange risk. Currency exchange rates are constantly changing, which may affect the value of the investment in sterling terms. You could lose money in sterling even if the stock price rises in the currency of origin. Stocks listed on overseas exchanges may be subject to additional dealing and exchange rate charges, and may have other tax implications, and may not provide the same, or any, regulatory protection as in the UK.
You’re reading a free article with opinions that may differ from The Motley Fool’s Premium Investing Services.
Sometimes people who want to start buying shares can feel as if they might never get the chance. So many other spending priorities can pop up in life.
That is why I think it can make sense to target a specific, manageable part of one’s income for investing.
Setting a regular contribution level
How much that is will depend on an investor’s own circumstances.
Different people have different salaries – and different outgoings. For some, buying shares may be a high priority. For others, it may be something they only do on a very small scale.
In this example, I imagine someone puts 5% of their salary away each month to start buying shares and then build a portfolio over the long term.
How much that is depends on how big the salary is (and whether the person sticks to their good intentions!). It may also be that, over time, they decide to invest a higher or lower proportion of their earnings.
But I think setting a regular goal can help to build wealth over the long term, as it can lay the foundations for building a share portfolio.
That money needs to be put into some sort of investment account. A helpful early step could therefore be comparing options for a share-dealing account, Stocks and Shares ISA, or dealing app.
While getting to grips with the nuances of the stock market is a long-term project, more pressingly I think a new investor needs at least to get to grips with key concepts like valuation and risk management before putting their hard-earned cash at risk.
Each investor has their own approach to deciding what to buy.
Like billionaire investor Warren Buffett, I aim to buy shares in great businesses when they are selling for an attractive price.
An example of a share I have been buying lately is B&M European Value (LSE: BME).
A quick look at its share chart shows that not all investors over the past several years have shared my enthusiasm.
A chunky dividend looks attractive (and will hopefully generate passive income for me while I own the shares), but dividends are never guaranteed.
Indeed, one error some people make when they start buying shares (and sometimes beyond) is getting excited by the prospect of a dividend without asking themselves how sustainable the payout may be, based on their assessment of the company’s business prospects.
B&M has its challenges. Lately its sales of fast-moving consumer goods have been disappointing. That highlights the risk of a wider slowdown in other product categories too.
But I see a lot to like here. The company is well-known and, in a weak economy, its discount proposition may look attractive to even more shoppers. It has a large estate of shops, has been growing sales overall, and benefits from a sizeable pool of regular shoppers.
Following another profit warning today, the B&M share price fell sharply. But it’s helped push the retailer’s yield well into double figures.
Posted by James Beard
Published 20 October, 12:13 pm BST

When investing, your capital is at risk. The value of your investments can go down as well as up and you may get back less than you put in.
The content of this article is provided for information purposes only and is not intended to be, nor does it constitute, any form of personal advice. Investments in a currency other than sterling are exposed to currency exchange risk. Currency exchange rates are constantly changing, which may affect the value of the investment in sterling terms. You could lose money in sterling even if the stock price rises in the currency of origin. Stocks listed on overseas exchanges may be subject to additional dealing and exchange rate charges, and may have other tax implications, and may not provide the same, or any, regulatory protection as in the UK.
It’s been a bad morning (20 October) for the B&M European Value (LSE:BME) share price. By 10am, the group’s shares were worth 17% less than they were at the start of trading. That came after the discount retailer issued another profit warning for the 52 weeks ending 28 March 2026 (FY26). It also announced the departure of its chief financial officer.
It’s the group’s second profit downgrade in less than three weeks. This time it said it had identified “approximately £7m of overseas freight costs not correctly recognised in cost of goods sold, following an operating system update earlier this year”.
The group started FY26 expecting adjusted EBITDA (earnings before interest, tax, depreciation and amortisation) to be around £620m. Following weaker-than-expected sales, it reduced this to £510m-£560m. Today, based on “revised second-quarter margin run rates”, it’s cut this estimate to £470m-£520m.
For the second half of the year, it’s forecasting UK like-for-like sales to grow at between “low-single-digit negative and low-single-digit positive levels”. As we’ve seen, the difference between these two outcomes is worth £50m of EBITDA.
The announcement continues a sad decline for the group. It was ejected from the FTSE 100 in December 2024 having joined for the first time in September 2020. Since then, its share price has fallen 51%. But it doesn’t have to be like this. Frasers Group, another retailer, fell out of the Footsie on the same day. Its shares are now worth 10% more.
One positive outcome from the falling share price is that the stock’s now yielding 16.8%. This is based on amounts paid over the past 12 months. Of course, with earnings coming under pressure, this could lead to a cut in the dividend.
And based on its past four financial years, it’s difficult to predict what its future dividend might be. As well as making interim and final payouts each year, the group’s recently paid a series of special dividends.
| Period | Interim (pence) | Special (pence) | Final (pence) | Total (pence) |
|---|---|---|---|---|
| FY22 | 5.0 | 25.0 | 11.5 | 47.5 |
| FY23 | 5.0 | 20.0 | 9.6 | 34.6 |
| FY24 | 5.1 | 20.0 | 9.6 | 34.7 |
| FY25 | 5.3 | 15.0 | 9.7 | 30.0 |
Source: Hargreaves Lansdown
On the face of it, the group has lots going for it. It’s a familiar face on the country’s high streets and retail parks. It has 1,130 stores in the UK, trading under the B&M and Heron Foods brands, and 140 units in France.
And its shops always seem busy to me. With disposable incomes remaining under pressure, it’s in a good position to capitalise with its low-cost offer.
As part of its turnaround plan, the group’s embarked on a ‘Back to B&M Basics’ strategy, which includes further price cuts, giving greater autonomy to managers to introduce ‘specials’, reducing stock lines and improving product availability. This all makes sense to me. However, it will take up to 18 months for the full impact to be felt.
But the group continues to face some possible challenges. There’s speculation that the Chancellor’s looking to shift more of the burden of commercial rates away from smaller shops to larger ones. And persistent supply chain inflation could eat away at its gross profit margin.
At the moment, there’s too much uncertainty surrounding the group’s numbers to make me want to invest. But like most retailers, Christmas is a crucial period for B&M. I shall therefore revisit the investment case once I know how it’s performed over the festive season.

If you invest, one day you will buy a clunker, how you deal with that, will determine how successful you will be.

Underlying Earnings and Dividends
The Underlying Earnings for the Year, before repayments, were £95.3 million, or 16.0pps, and underlying cash available for distribution, post debt repayments of £33.5m or 5.6pps, were £61.8 million or 10.4pps. This has enabled the declaration of a fourth interim dividend of 2.30pps, bringing the total dividend for the Year to 8.90pps (Prior Year: 8.80pps). Once again, the total dividend for the Year has been covered by earnings. The yield on our shares – based on a share price of 83 pence on 17 October 2025 – is 10.72%. The Board has set a target dividend for the year ended 30 June 2026 of not less than 9.00pps, which extends our long record of progressive increases.
The AGM
The Company’s Annual General Meeting will take place on 11 December 2025 at Floor 2, Trafalgar Court, Les Banques, St Peter Port, Guernsey. Shareholders who are unable to be present in person are encouraged to submit questions in advance of the meeting.

Strategic considerations
There is a plausible future for BSIF in continuing to operate under its existing business model without the need for new capital, while continuing to pay a sector-leading dividend – the “business as usual” option. But Shareholders need to be aware that, in the absence of access to additional equity and the cheap debt we enjoyed for many years, continuing to operate with the current capital structure will necessitate the sale of development and prospectively operational assets. Such disposals will gradually starve the Company of growth opportunities and confine BSIF to its current position, namely the steady erosion of the Company’s NAV, reflecting attrition of our capital base, with returns delivered only in the form of income.
Our market engagement process over the last few months makes it clear that there is widespread confidence in the future of solar power. What is also clear to your Board is that greater value is placed on a more integrated business that brings together BSIF’s operating portfolio with its sizeable near-term development pipeline, coupled with the proven development and operating capability that exists within the Bluefield Group.
The Board is therefore considering other paths for the future of BSIF, including options that could see it move towards a more integrated business model which is better placed to capture the growth opportunity that eludes Shareholders in the Company’s current form, but is more readily available in an integrated Bluefield model. On the basis of initial discussions with the owners of the Bluefield Group, it would appear to be a model which is attractive to both BSIF and its Investment Adviser. Integrating the Bluefield Group’s 140 person platform, covering development activities through to operations, would create a UK-focused green Independent Power Producer, one that with the appropriate capital structure, corporate debt and dividend policies could be a largely self-funded growth model. This would enable the Company to build out its valuable and return-accretive development pipeline and deliver what the Board expects to be a materially higher total return to Shareholders than has been possible under the Company’s current business model and dividend policy. This transition would require a re-examination of our capital structure and dividend policy as we examine the proportion of our net income that we would be able to distribute if we are to fund our pipeline from retained earnings and additional borrowings.

© 2026 Passive Income Live
Theme by Anders Noren — Up ↑