Investment Trust Dividends

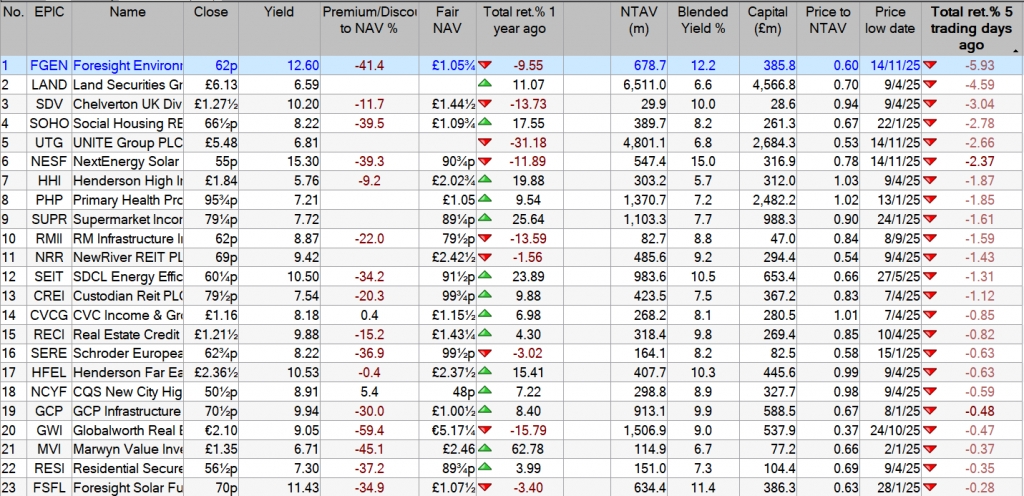
The Snowball currently has £1,892.00 xd, when added to current cash of £460.00, to be invested in GCP and FSFL

Whilst all days are good days for a dividend investment plan, some days are better than others.
Dividends can be more reliable than share prices as they’re driven by
the companies performance itself and not by the whim of investors.
As part of a total return / reinvestment strategy, this income could be
reinvested into income assets or back into the equity market
depending on the relative valuations.
The emotional benefits of dividend re-investment.
In fact, with this investment strategy you can actually welcome falling share prices.


Bluefield Solar Income Fund Limited
(‘Bluefield Solar’ or the ‘Company’)
Unaudited NAV as at 30 September 2025
Bluefield Solar (LON: BSIF), the London listed UK income fund focused primarily on acquiring and managing solar energy assets, announces its net asset value (‘NAV’) as at 30 September 2025. Unless otherwise noted herein, the information provided in this announcement is unaudited.
The NAV as at 30 September 2025 was £675.0 million, or 114.00 pence per Ordinary Share (‘pps’), compared to the audited NAV of 116.56 pps as at 30 June 2025. This equates to a movement in the quarter of -2.20% and a NAV total return for the quarter of -0.31%.
| (pps) | |||||||
| Audited NAV as at 30 June 2025 | 116.56 | ||||||
| Power prices | 0.01 | ||||||
| REGO Update | -0.10 | ||||||
| Actual Generation vs Forecast | -0.16 | ||||||
| Grid Curtailments | -0.22 | ||||||
| Dividend Paid | -2.20 | ||||||
| Other movements | 0.11 | ||||||
| Unaudited NAV as at 30 September 2025 | 114.00 | ||||||
Power prices and Renewable Energy Guarantees of Origin (‘REGOs’)
The power curves available from the Company’s three leading independent power forecasters as at 30 September 2025 show electricity prices falling slightly in the near term with a modest increase in long-term forecasts. The near-term decline is principally attributed to stronger renewable capacity growth as the market seeks to achieve Clean Power 2030.
The portfolio is largely insulated from this downward pressure on account of the power price fixing strategy. Longer-term increases are a result of increased demand expectations resulting in a slight increase to the NAV. REGO prices were updated for the latest annual REGO curve, which has dropped from an average price of circa £1/MWh to £0.80/MWh for the period 2026 to 2030.
Actual Generation vs Forecast
Generation across the combined portfolio was slightly below forecast during the quarter, primarily due to reduced availability caused principally by turbine outages on two of the Company’s wind assets.
Grid Curtailments
Several assets within the portfolio experienced both planned and unplanned grid curtailments during the period. The most significant impact occurred at West Raynham (50MW), where a scheduled curtailment for grid update works kept the site offline throughout June and July.
Other Movements
Other movements reflect the change of the calculation date of cash flows from 30 June 2025 to 30 September 2025, along with tax, degradation, debt, and working capital adjustments.
Gearing
The Company’s UK holding companies and its subsidiaries have total outstanding debt of £572.0 million, with a leverage level of circa 45.9% of Gross Asset Value (30 June 2025: 45.7%).
Potential Changes to UK ROCs and FiTs Regimes
For information, please refer to the announcement on 7 November 2025:
Strategic Review and Commencement of Formal Sale Process
For information, please refer to the announcement on 5 November 2025:

Is it “different this time”, or are we in the mother of all bubbles? The economics of AI should give investors pause for thought, says Dan McEvoy

(Image credit: Getty Images)
By Dan McEvoy
published 5 days ago in Analyses
Questions about AI’s stock market dominance are being asked louder than ever. On 27 October, Wired published an article contending that “AI may not simply be ‘a bubble’ or even an enormous bubble. It may be the ultimate bubble.” The article included comments from Brent Goldfarb, co-author of Bubbles and Crashes: The Boom and Bust of Technological Innovation. Goldfarb said that the AI boom ticks every box he looks for in a technology-driven bubble: uncertainty over the ultimate end use, a focus on “pure play” companies, novice investor participation and a reliance on narrative.
As Edward Chancellor, financial journalist and former hedge-fund strategist, has pointed out in these pages, the AI bubble is also on shakier ground than many previous technology-driven bubbles, such as the dotcom bubble, the “Roaring Twenties” and the US railroad boom, all of which were followed by major economic depressions. It is also more speculative. Railways, cars and the internet were proven technologies in their bubble periods – the same cannot be said of self-teaching computers. The AI bubble is more “a multi-trillion-dollar experiment” to see if we can arrive at artificial general intelligence (AGI) – technology that successfully matches human levels of intelligence. If that experiment fails, we won’t have canals, railways or fibre-optic cables to show for it, but rather millions of obsolescing computer chips and dormant, debt-funded data centres.

AI as a field of research dates back at least to Alan Turing, and includes established fields such as machine learning and computer vision; generative AI is a newer subdivision that has taken shape over the last 15 years. It leapt to public attention – and brought the wider field along with it – with the launch of ChatGPT in November 2022. But it’s worth emphasising that if you are happy to buy Nvidia shares at current prices, you are effectively betting on the long-term profitability of generative (and its newer subset, “agentic”) AI, not the field as a whole. And even the bulls are nervous about the prospects for that. “AI… is driving trillions in spending over the next few years and thus will keep this tech bull market alive for at least another two years,” says Dan Ives, head of global technology research at Wedbush Securities. That is significant as Ives is one of the great tech bulls. If even he is implicitly conceding that the current bull market could end and suggesting a possible timeframe, it shows that doubt is creeping in.
Stay ahead of the curve with MoneyWeek magazine and enjoy the latest financial news and expert analysis, plus 58% off after your trial.

“This time it’s different” is regarded as one of the most dangerous phrases in investing, but it’s a refrain that AI’s proponents turn to increasingly frequently. The companies driving AI today, they say, are highly profitable, unlike the proliferation of profitless internet start-ups in the dotcom era. That holds true of Nvidia as well as the “hyperscalers” (Alphabet, Amazon and Microsoft), but none of these are profitable because of revenue generated by generative AI products. They were already highly profitable (and, for the most part, less capital-intensive) before the arrival of ChatGPT. No one denies there is money to be made selling computer chips or cloud computing. But AI is a different story.
Latest Videos From MoneyWeek
Step back and look at generative AI firms in isolation, and the current set-up looks a lot like the dotcom bubble. Venture capital is flooding into speculative businesses that burn through cash with no credible plans to turn that into profit any time soon. James Mackintosh of The Wall Street Journal observes that the dotcom bubble kept inflating between 1995-2000 despite media references to the bubble increasing every year throughout this period. Bubbles can keep growing, even if everyone knows they’re bubbles.
A bubble usually bursts after encountering some form of pin. No one knows what that will be for AI, but a contender is an energy-driven inflation crisis. AI requires vast amounts of energy. Policymakers can make life as easy as possible for AI developers, but they can’t control energy prices. The more advanced AI models become and the more users they acquire, the more energy they are likely to consume. And there are signs that AI is already making energy more expensive for US consumers. Bank of America deposit data shows that average electricity and gas payments increased 3.6% year-on-year in the third quarter of this year. Whether or not energy-driven inflation reaches a point where it poses headaches for US politicians, it doesn’t take much imagination to see it quickly becoming a problem for AI developers themselves.
OpenAI’s CEO Sam Altman wants his firm to have 250 gigawatts (GW) of data-centre capacity by 2033. According to Bloomberg’s Liam Denning, that’s equivalent to about a third of peak demand on the US grid and more than four times all-time peak electricity demand for the state of California. Nvidia’s CEO Jensen Huang says 1GW of data-centre capacity costs $50 -billion – $60 billion to build (of which $35 billion or so goes on Nvidia’s chips), so building this could cost OpenAI north of $12 /trillion That simply it isn’t going to happen – certainly not in anything like the next eight years, at least – but the numbers show just how much energy AI’s biggest players are planning to consume.
Even with energy prices where they are, the economics are stretched thin for AI developers. OpenAI posted an operating loss of $7.8 billion in the first half of 2025, according to tech news site The Information. Annual recurring revenue is set to exceed $20 billion this year, but OpenAI’s own projections say it will not be cash flow positive until 2029, when it projects revenue of $125 billion. If the economics of scaling its capacity at pace ever start looking negative, then OpenAI’s semiconductor-spending binge could slow dramatically.
If you want an idea of how overblown the stock market’s reaction is to this binge, look no further than AMD (Nasdaq: AMD). On 6 October, OpenAI announced that it would buy up to 6GW of GPUs from AMD, which AMD executives estimated could net $100 billion in additional revenues once the ripple effects are factored in. Within two days of the announcement, AMD’s market capitalisation had increased by around $115 billion – more than the revenue the deal was expected to raise. That’s before getting into the fact that AMD will be paid for the GPUs not with money, but with its own stock.
Generative AI does at appear to be improving professional productivity. What data we currently have available from the US shows a trend of reasonably healthy GDP growth alongside subdued job creation, which Joseph Amato, president and chief investment officer at Neuberger, calls “an unusual combination that points to productivity doing more of the heavy lifting”. AI is expected to lift productivity in the US by 1.5% over the next ten years, and between 0.2%-1.3% across the G7. But Amato cautions that these gains are far from evenly distributed and that they pose risks of their own. “Lower-end white-collar roles – performing routine analysis or administrative tasks often filled by recent college graduates – face significant displacement risk,” he says. That has profound policy implications.
The AI revolution could eat itself. You can’t put an entire generation of the global middle class out of work without expecting substantial economic consequences; perhaps enough to negate all the potential GDP gains. There is evidence that this is already happening. Ron Hetrick, principal economist at workforce consulting firm Lightcast, observes that average real spending on retail goods compared with total employment has been stagnating ever since the housing bubble that led to the 2008 crash. Covid and the consequent stimuli disrupted this trend, but only temporarily: retail spend per employee is now falling again.
Hetrick calls AI “a jobs-destroying, money devouring technology” that threatens to accelerate this decline. As retail spending continues to fall, AI companies’ “large enterprise clients will also see their buyers stagnate”. If the world entered a recession, the core business pillars at Amazon, Google and Meta would take a major hit; advertising and e-commerce revenues are all ultimately reliant on a large crop of middle class consumers happily spending money. None of these companies has an AI division that is remotely profitable in its own right, let alone capable of supporting the wider business.
AI could deliver some genuinely world-changing social benefits, improved medical research being an obvious example. Google DeepMind’s AlphaFold is a program that can predict the structure of a protein based on the sequence of amino acids that comprise it, which has profound implications for the research of diseases and development of treatments.
But two things need to be remembered: firstly, this isn’t particularly new: DeepMind debuted AlphaFold in 2018, so its potential ought to have been priced in before ChatGPT came along. These kinds of techniques are also not generative AI – researchers at the top biotechs are not asking ChatGPT to come up with new amino acid sequences for them, because that’s not how large language models work. More pertinently for investors, it is not a given that the medical applications will be profitable.
How can investors hedge their bets given these trends? Judicious selection of energy stocks is one way to play the increasing demand for power that AI companies will drive over the coming years. But this window may already have passed: Vistra (NYSE: VST), for example, has gained 60% in the past 12 months and now trades at 22 times forward earnings – which is a reasonable price for a tech stock, but looks steep based on traditional valuations for utilities. That said, if it does turn out to be energy inflation that eventually bursts the AI bubble, then the suppliers ought to catch the tailwinds in the process. An investment trust with exposure to companies powering and building data centres, such as Pantheon Infrastructure (LSE: PINT), can offer exposure to data-centre energy suppliers.
Or you could look for undervalued AI plays. Certain semiconductor stocks, such Taiwan Semiconductor Manufacturing Company (NYSE: TSM), stand to continue benefitting from AI infrastructure spending for as long as it takes the bubble to burst, without the overblown valuations of the big US names.
Given TSMC’s effective monopoly on high-end chip manufacturing, it is well-placed to capitalise on whatever technological innovation might follow in AI’s wake if and when the bubble bursts.
Chris Beauchamp, chief market analyst at IG, suggests some traditional defensive plays in order to hedge portfolios, including gold, government bonds, defensive shares in sectors such as consumer staples and healthcare, and multi-asset funds. “Finally, with policy rates still elevated, holding cash-like assets is no longer punitive,” he says. “The key is diversification: no single hedge works in every scenario, but a combination can cushion portfolios if AI euphoria fades.”


This is a non-independent marketing communication commissioned by Invesco. The report has not been prepared in accordance with legal requirements designed to promote the independence of investment research and is not subject to any prohibition on the dealing ahead of the dissemination of investment research.
Analysts view
BIPS uses the investment trust structure to maximise the potential in high-yield bonds.
Overview
Invesco Bond Income Plus (BIPS) is designed to offer an attractively high yield with a diversified, risk-conscious approach. The investment trust structure allows the manager, Rhys Davies, to invest in a diversified set of high-yield bond markets, including into some smaller and less liquid areas, and to boost the yield by taking on gearing rather than extra credit risk. Meanwhile, the ability for the board to build up revenue reserves makes it easier for it to provide a smooth income output (see Dividend).
Rhys can invest in high yield globally, but focusses on the UK and Europe, supplemented by the best ideas from Invesco’s large US-based credit teams. He runs a portfolio very diversified by issuer, and uses his and his team’s expertise in subordinated bank debt to provide a boost to the yield without taking excessive credit risk (see Portfolio). Currently, this allocation to subordinated financials is balanced by a large position in lower-yielding, investment-grade debt. Overall, Rhys is positioned cautiously, waiting for opportunities to take advantage when high valuations recede — as he did to good effect during the tariff tantrum of April 2025. Nonetheless, the portfolio yield is c. 7.5%, reflecting Rhys’ ability to generate income without leaning on credit risk. Board and manager agree a dividend target at the start of each year, with 2025’s 12.25p per share equivalent to an ongoing share price yield of 7.0%.
Strong demand for the shares means the trust has tended to trade on a premium for the past three years and the board has issued substantial amounts of shares to meet demand, which has contributed to BIPS having the lowest charges in its sector by some way. Nonetheless, the shares still trade on a small premium of 1.5% at the time of writing.
Analyst’s View
BIPS has strong credentials to be the first option considered for any high-yield bond allocation. It uses the features of the investment trust structure well to its advantage, providing an edge over open-ended funds or ETFs. Rhys doesn’t have to keep cash on hand for outflows, and so can remain fully invested. In fact, he tends to run with a geared position, boosting the yield and the capital growth potential. He also invests in more specialist and less liquid areas like subordinated financial debt and some small issue bond deals, providing off-benchmark allocations that passive options can’t. The annual dividend target provides some visibility on the yield, while revenue reserves provide some protection in the event that market yields fall. Invesco’s large credit teams in Europe and the USA allow Rhys to manage a broad and diversified portfolio with prudently managed issuer and geographical risks.
Rhys’s cautious outlook doesn’t prevent the trust from offering a high yield while also having some built-in beta to any price appreciation that would come from falling interest rates, with a duration of 3.8 as of the end of September. This interest rate sensitivity is spread across the three key geographies, and so if UK rates remain high while European and US rates continue to fall, the portfolio will still benefit. We think that, given how narrow credit spreads are right now, BIPS’s approach, which allows a high yield to be earned without leaning on credit risk, is highly attractive.


Nov. 12, 2025

JR Research

It’s less than a week since we saw glimpses of the wheels coming off for the money-losing speculative companies that I surfaced in a market outlook. To rub salt further into the wounds of these investors, CoreWeave stock (CRWV) has nearly plunged down further to its September lows. Many in the speculative basket are still trying to hang on for dear life, but I reckon this thin thread (of relying on momentum, because they have no proven fundamentals yet) might just give way if the reallocation or rotation trade gains traction.
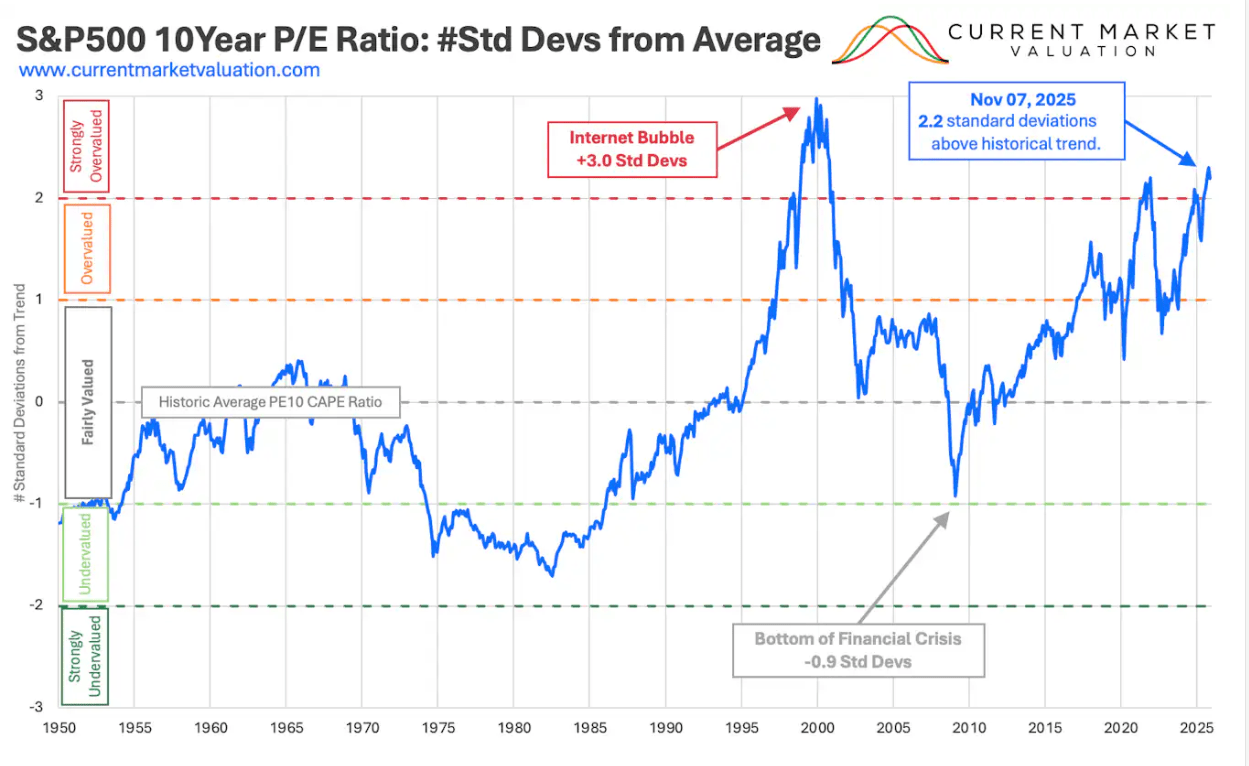
What rotation? What reallocation am I referring to? Surely, I don’t think I need to remind you that the S&P 500 10Y P/E CAPE ratio has surpassed the +2 standard deviation from its average. Incidentally, the 2021 peak has also been taken in the process, as investors piled into the risk on AI trade that has arguably driven the market recovery from Trump’s Liberation Day lows in April 2025.
Hence, with the tech sector (XLK) printing a forward P/E of >30x, don’t you think we need to be more scrupulous when assessing both sides of the AI narrative pushed by the ebullient investors and also the hawkish bears such as the likes of Michael Burry? These bulls litigate that this multiyear buildout has several more years to go as big tech and their peers rush to scale toward the multi trillion dollar AI infra mark. In contrast, these bears contend that such an aggressive cadence couldn’t be sustained without extending CapEx depreciation (disingenuously) or without matching it with more tactile proof from enterprise monetization to validate the burgeoning CapEx footprint.
Which is going to pan out? Sorry to disappoint you, but I don’t have a crystal ball to tell you who’s absolutely right and who’s horrendously wrong. Yet, I also want to allude to a classic observation from legendary investor George Soros. He said, “When I see a bubble forming, I rush in to buy, adding fuel to the fire. That is not irrational.” What’s the takeaway? “Knowing when to get out.”
I would attempt to add further to his astute observation that we must also survey the battlefield earlier to size up our options so that we know where to reallocate or rotate our capital before we get out (knowing that markets might move very quickly and abruptly; just look at CRWV’s battering). Knowing that the Magnificent Seven has become the single most important basket of stocks, driving up the S&P 500’s (SPX) (SPY) market cap in recent times, we must also bear in mind that if the narrative were to flip on its head, expect significant turbulence that may border on the extremely painful scenario plays.
Warren Buffett, in his final letter posted this week as the CEO of Berkshire Hathaway (BRK.A) (BRK.B), aptly pointed out that he believes the conglomerate “has less chance of a devastating disaster than any business [he] know[s].” Yet, he also offered an opportune reminder that “our (Berkshire) stock price will move capriciously, occasionally falling 50% or so, as has happened three times in 60 years under present management.”
Was it meant to be a shoutout to the AI warriors who are feverishly exposing their portfolio to the narratives championed by the exuberant AI bulls that don’t think the market’s momentum could shift against them without warning?
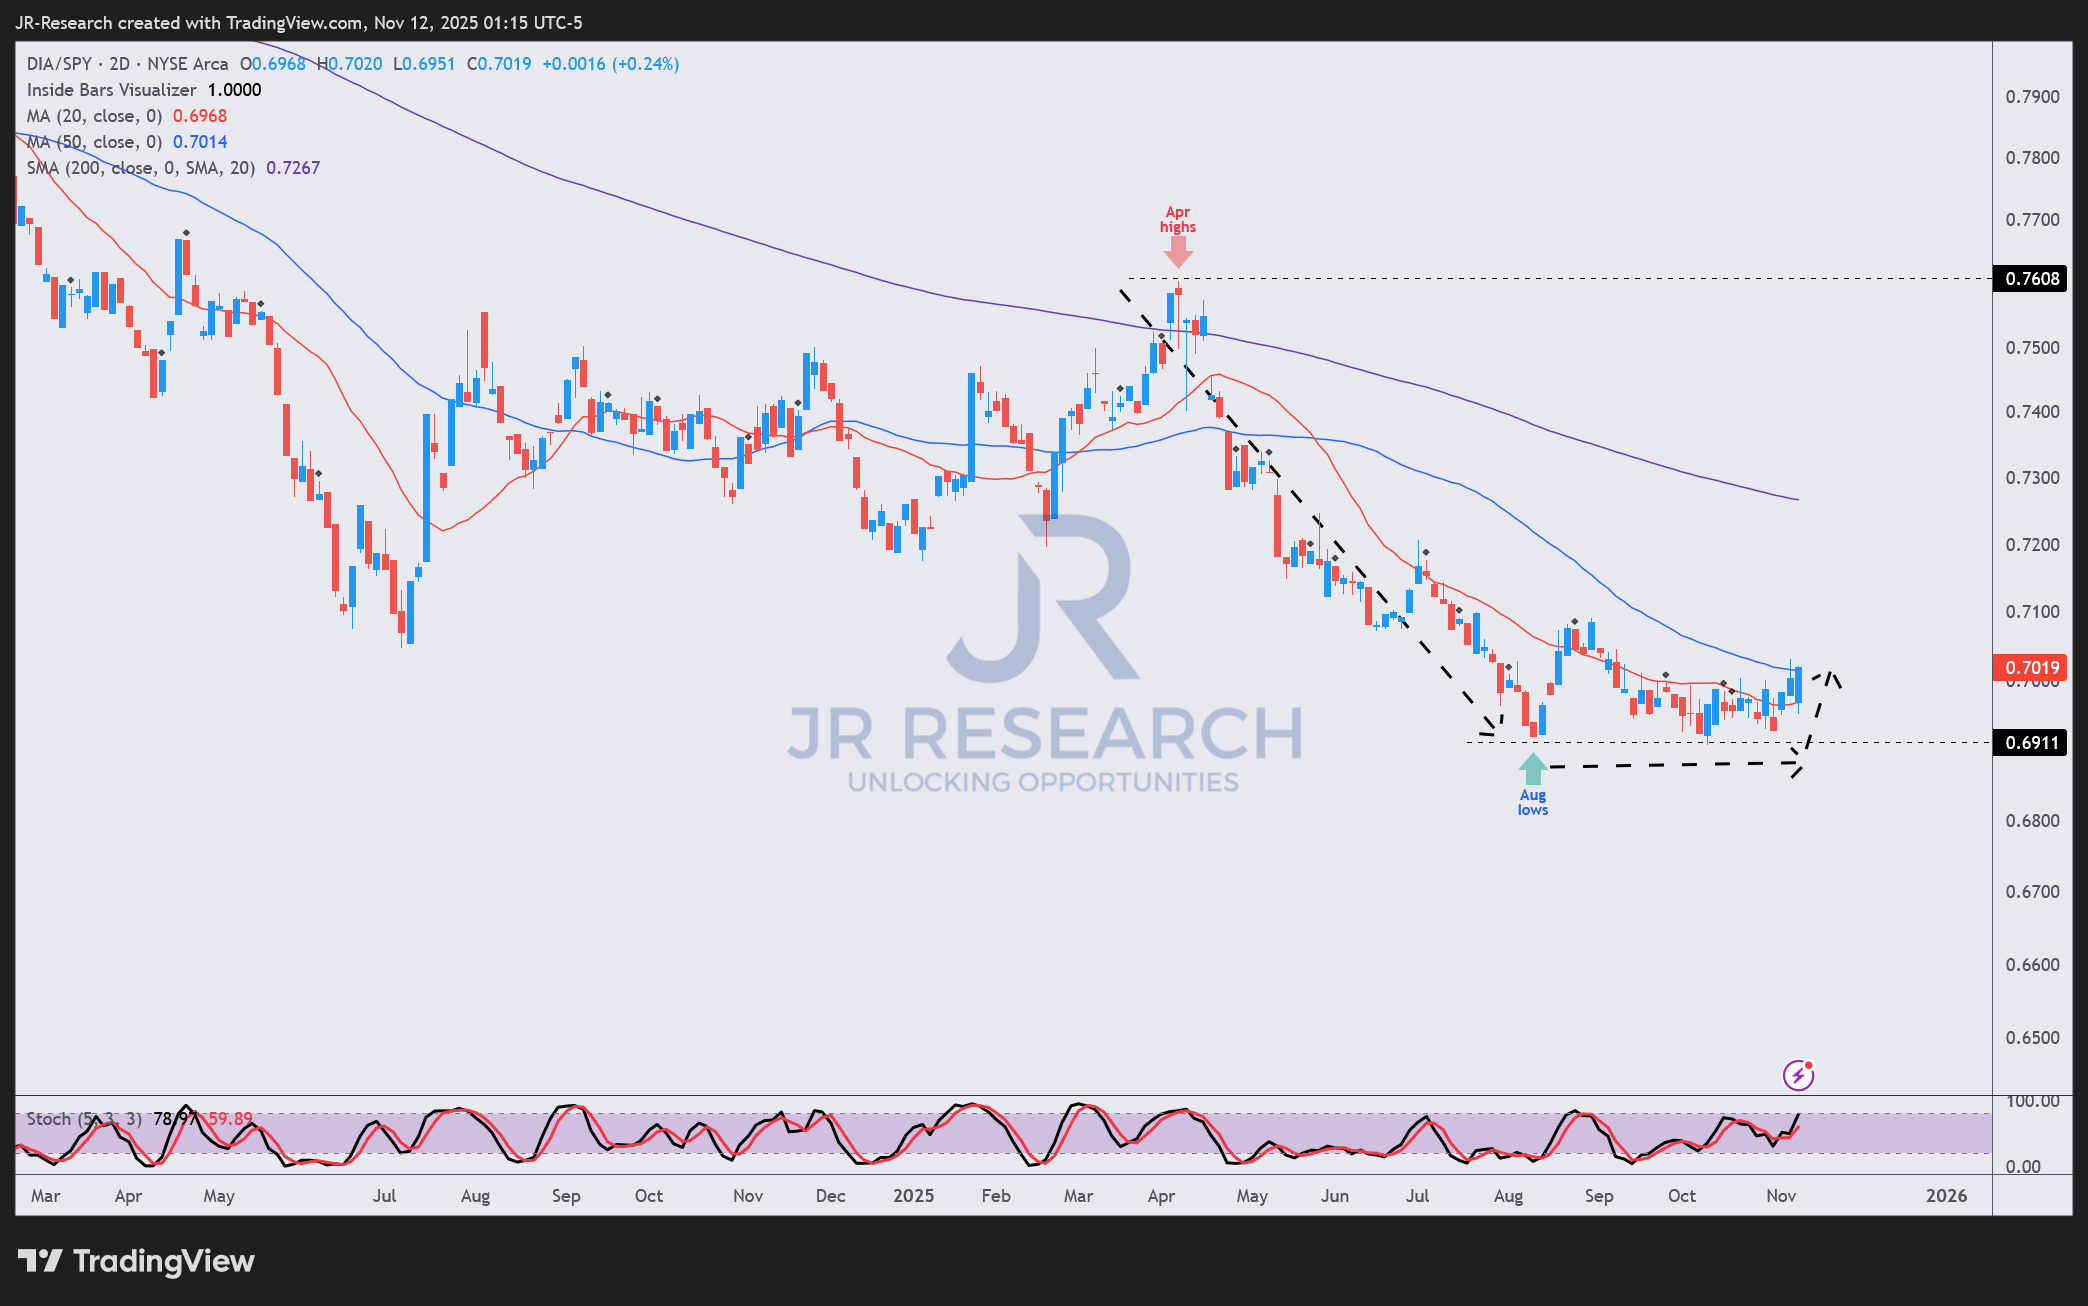
Well, that thesis has already been put to the test in recent days, as the less expensive Dow Jones Industrials (DIA) (DJI) have outperformed their S&P 500 peers this week. Brewing signs of a consolidation are starting to take hold, and note that the sideways moving price action has been gaining clout since August. Yes, August! In other words, the one way traffic (in favor of the S&P 500 as compared to the DJI) looks primed for a reversal, as the rotation arc takes shape.
Well, I don’t think a big bear market is imminent, unless the economy is expected to fall into a hard landing. That will most certainly spur a compression in the well extended multiples, and it’s hard to downplay that growth and tech stocks will bear the brunt of such selling. Sans a recessionary outlook, a corrective wave to shake out froth from the most irrationally exuberant corners of the market looks more likely than not, as this capital coming out from these air pockets seeks other opportunities aside from the Mag 7 plays.
So, where could investors take their money to? If there are signs of a reversal already manifesting in the DJI, I’m quite sure that we could also ascertain similar signals from other sectors/plays (presumably the less expensive ones?) Let’s take a look at two of these, which I thought were credible candidates to help investors contemplating some form of diversification from the risk-on setup.
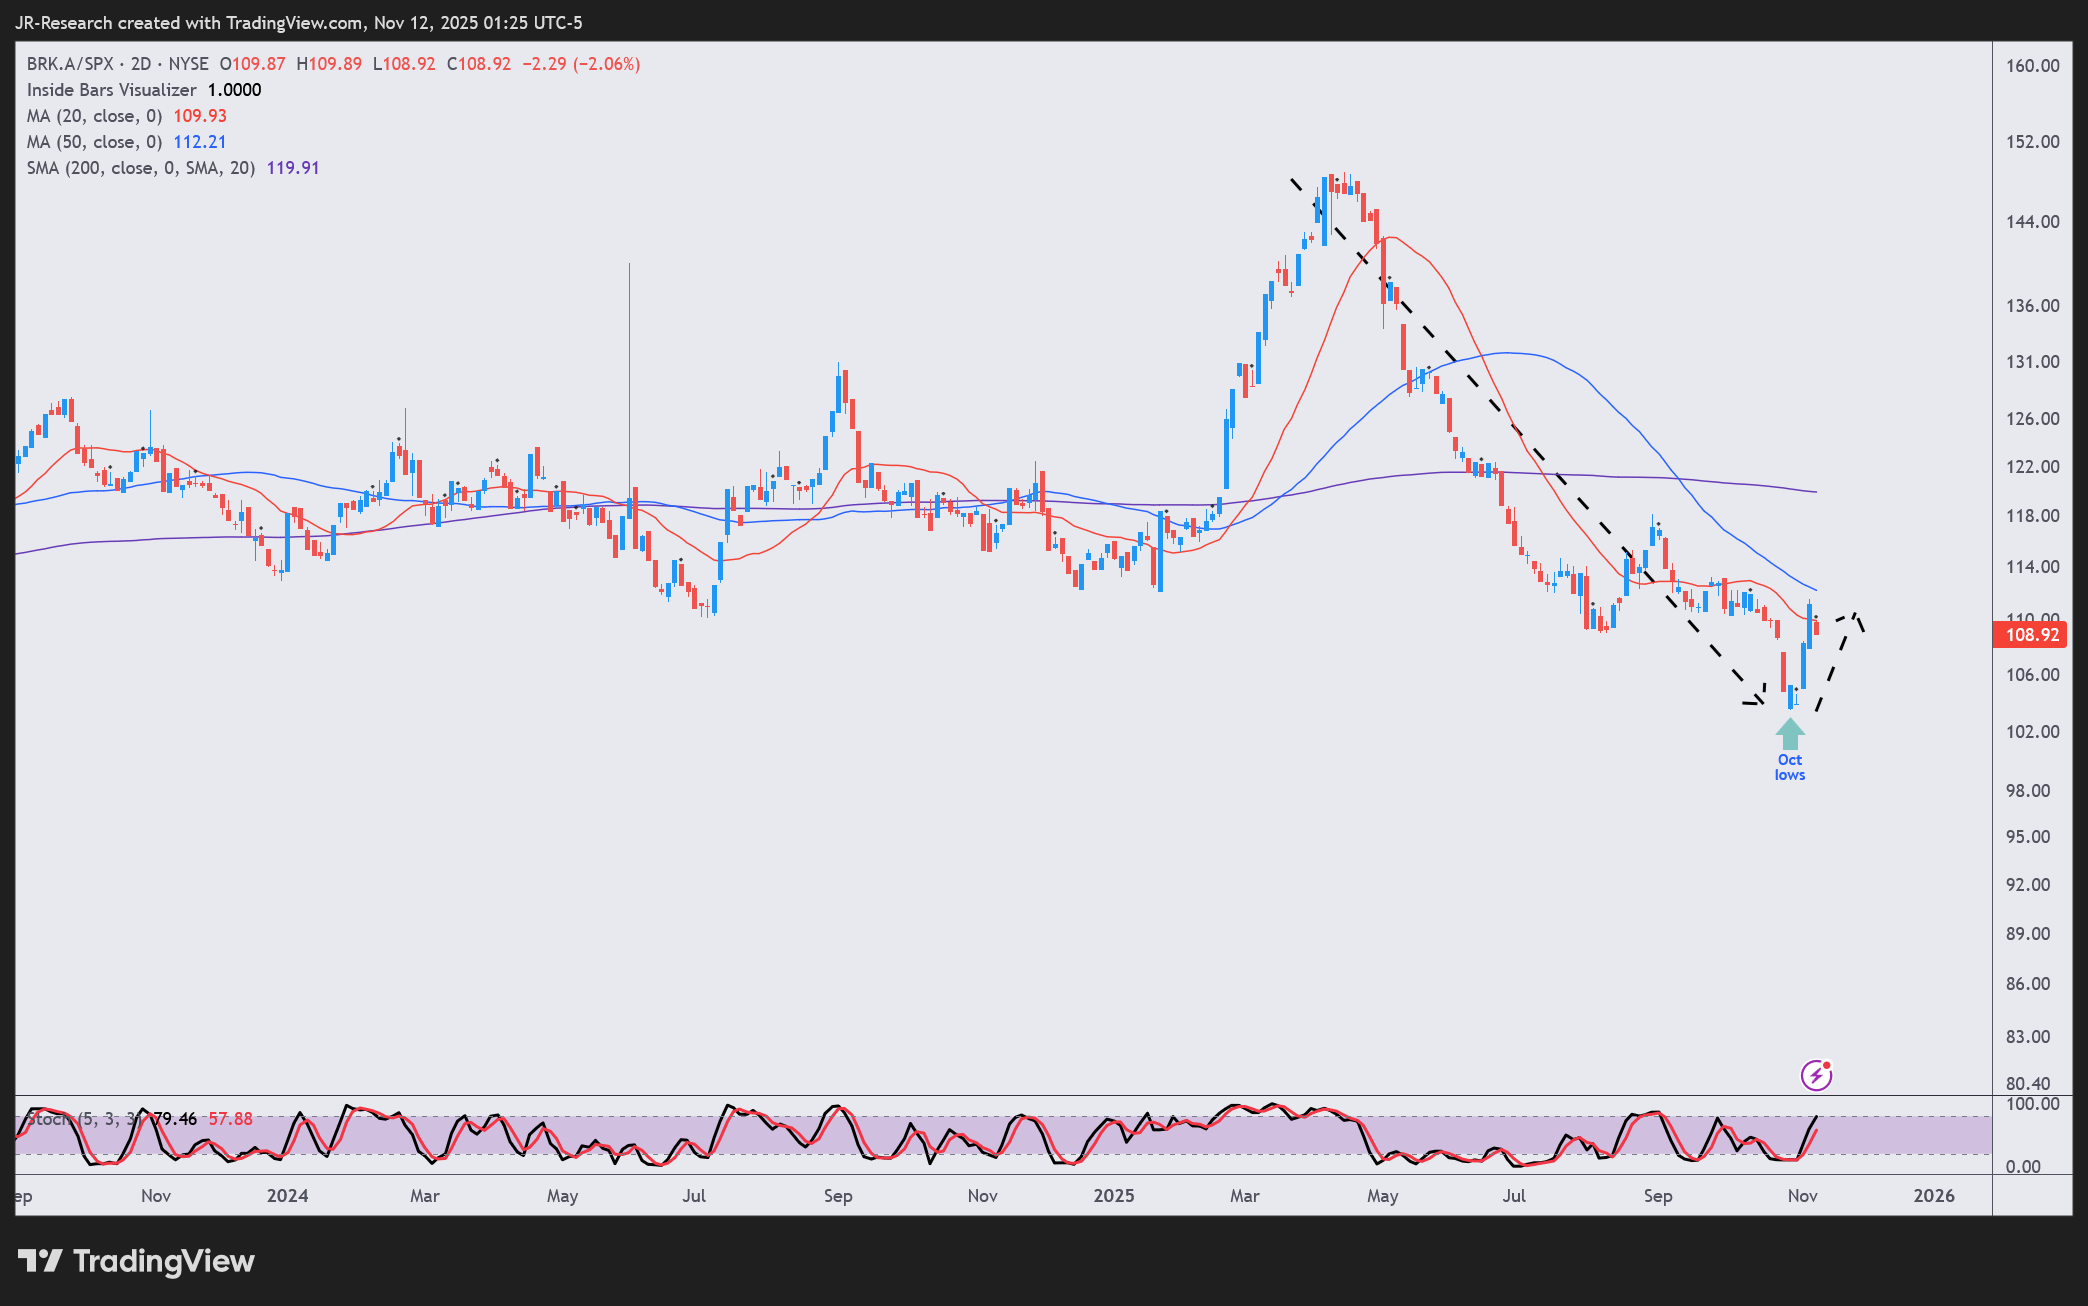
First up, Berkshire Hathaway. Look at the one way traffic that also stymied Berkshire’s performance relative to the market since April. It seems as if the market has completely digested the Buffett premium. Buffett seems to have also recognized the ambivalence and informed shareholders that he intends to “keep a significant amount of “A” shares until Berkshire shareholders develop the comfort with Greg that Charlie and I long enjoyed,” which he also added “shouldn’t take long.”
As a shareholder, I’m not perturbed with Buffett stepping down but still assured that he has gone out of his way to placate investors that the precepts, tenets, and principles that have made Berkshire what it is today wouldn’t be cast out of the window even after he steps down as CEO by the end of this year. Berkshire is built to last, and we know that Buffett’s disciplined capital allocation amidst the current market valuations should provide a boost to relative outperformance should investors start rotating away from the broad market.
We already see that happening in recent times since the end of October, as Berkshire stock outperformed the market. Is this a coincidence with that of the DJI observation I indicated earlier? I don’t think so, and I believe we are in the early innings of the market recognizing that they have ignored Berkshire stock for the past six months, and it’s time to take serious notice.
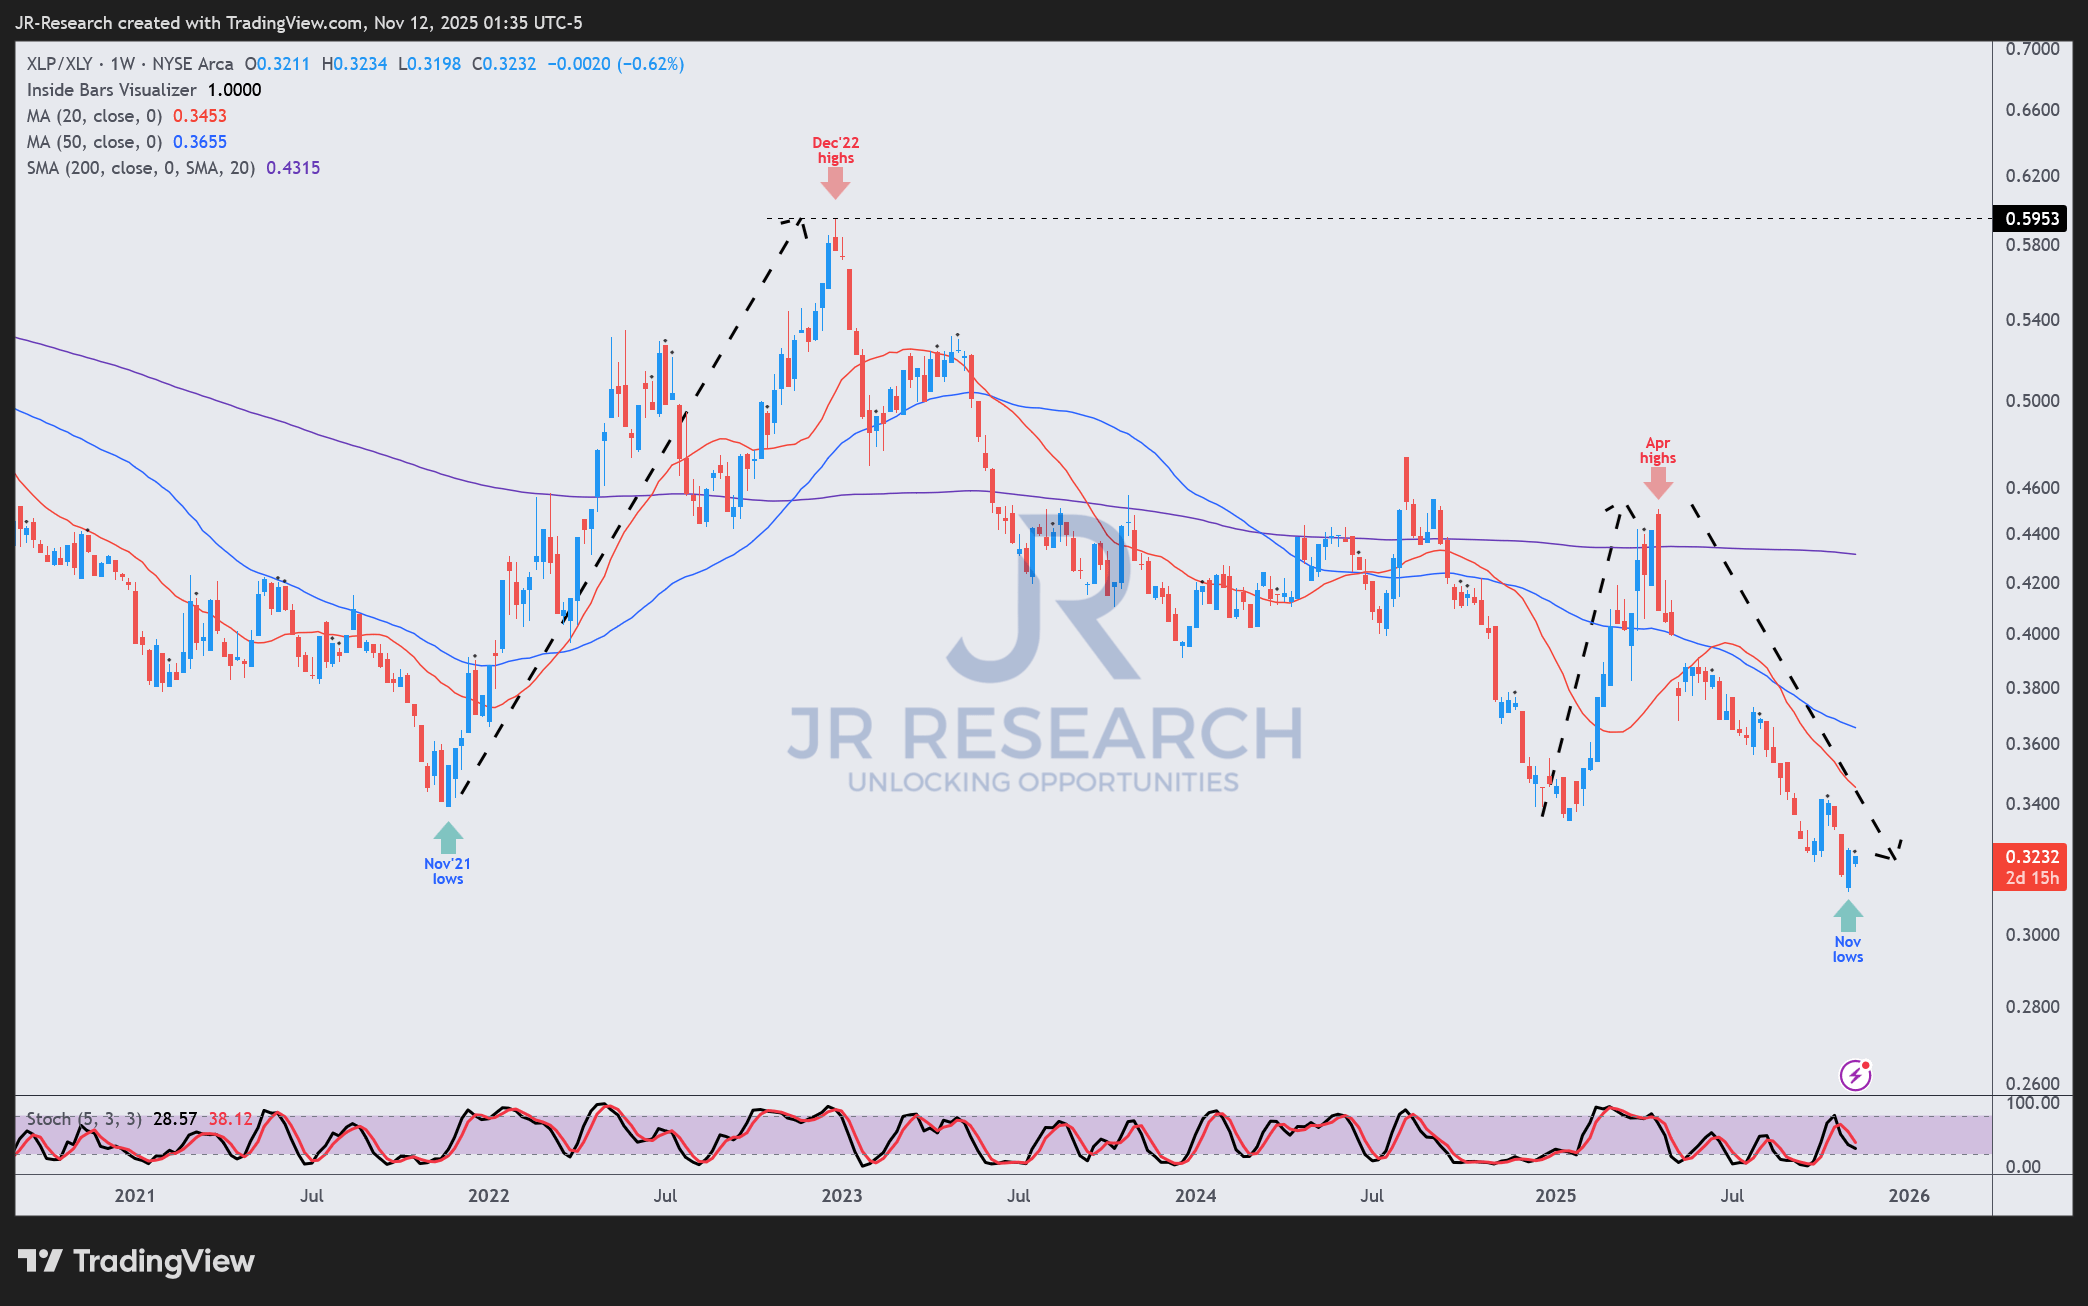
Next, consumer defensive (XLP). These are your Walmart (WMT), Costco (COST), Procter & Gamble (PG), and Coca-Cola (KO), to name a few. In a mega risk-on run up like the one we have experienced in the past six months, I wouldn’t be surprised to see defensives as a whole underperform. And that was exactly how it panned out.
Yet, don’t downplay the benefits of having XLP exposure during times of significant market stress like the pandemic bubble bust (2021-22) and the early 2025 mayhem. Both times saw the XLP outperform consumer discretionary peers (XLY) significantly until the risk-on sentiments regained control of the arc.
In the current context, it appears as if we are starting to see signs of a reversal favoring the XLP over its XLY peers, even though the print isn’t conclusive yet. In other words, pay close attention, as the one way traffic could be approaching an inflection point, which could cause the risk-on trade to turn around quickly into a risk-off one.
We have already gleaned signals from the speculative stocks mayhem, the Dow Jones Industrials starting to reassert strength, and Berkshire stock regaining momentum.
These aren’t isolated incidents, in my view. Rather, they represent critical observations suggesting that a more profound shakeout is still in the making, and one that might not be far from being actualized or panning out. In any case, remember to stay away from low quality and lean in on high quality to mitigate downside risks on your portfolio.

| https://Tonybetau.wordpress.com/ Tonybetau.wordpress.comx stellalaird39@camp.cdfaq.com 196.196.254.245 | I know this website offers quality dependent articles or reviews and other data, is there any other website which provides these kinds of data in quality? https://Tonybetau.wor |
You can read https://moneyforums.citywire.com/ but you can’t post unless you register.
From Asia to the UK, are investors rediscovering overlooked opportunities?
Schroders
Updated 07 Nov 2025
Disclosure – Non-Independent Marketing Communication
This is a non-independent marketing communication commissioned by International Biotechnology (IBT). The report has not been prepared in accordance with legal requirements designed to promote the independence of investment research and is not subject to any prohibition on the dealing ahead of the dissemination of investment research.
The idea of ‘American exceptionalism’ has deep roots. First coined in the 19th century – and popularised by Alexis de Tocqueville’s ‘Democracy in America’ in the 1830s – it captured the belief that the United States was fundamentally different from other countries – a nation founded on ideals of liberty, individualism and enterprise, with a unique role to play in the world. The phrase gained fresh prominence in the early 20th century, and during the Cold War it hardened into doctrine – a lens through which US foreign policy, economic leadership and even moral authority were projected onto the global stage.
In more recent years, that sense of American distinctiveness has manifested itself powerfully in financial markets. In the recovery from the global financial crisis from 2009 onwards, we have seen the rise of a new form of exceptionalism – characterised by the outperformance of US equities, the dominance of large cap technology stocks and the sheer gravitational pull of Wall Street on global capital flows. But such prolonged market leadership has created growing concentration risk – and raised questions about where future returns are most likely to come from.
As money flooded into US markets, the trend became self-reinforcing. Passive investment vehicles tracked rising benchmarks. Valuations expanded. Index concentration intensified. And portfolios across the world became more heavily skewed towards a single market – and, increasingly, a handful of companies. Currently, the US accounts for more than 70% of the MSCI World Index1 – a remarkable share for one country in what is ostensibly a global benchmark.
Yet history demonstrates that while markets can ignore gravity for a while, they cannot ignore it for ever. With political risks rising, fiscal sustainability under scrutiny and relative valuations stretched, many investors are no longer asking whether US outperformance will continue – now they’re asking how much exposure is too much and examining where capital might be better deployed in the years ahead.
While recent market performance shows no clear break in US leadership, signs of investor reassessment are emerging. Perhaps the clearest signal of this is in the weakness of the dollar, which has eaten away at the returns global investors receive from their US assets and may reflect a growing willingness among asset allocators to look elsewhere. What’s unfolding may not yet be a full-blown rotation, but it could be the early stages of a more strategic reallocation – away from concentrated US exposures and towards regions and asset classes offering more compelling long-term value.
In financial markets, nothing lasts forever. Cycles evolve, leadership rotates and what once looked like structural dominance can give way to reversion – especially when concentration runs high and valuations stretch.
The election of Donald Trump for a second term as US President may well come to be seen as a turning point. US equities initially rallied, buoyed by familiar promises of tax cuts and deregulation. But that optimism was soon tempered by renewed tensions around global alliances, fresh tariff threats and a more combative foreign policy stance – developments that unsettled investors and prompted a sharp, albeit brief, correction.
While markets have since rebounded, the episode served as a reminder of just how sensitive sentiment towards highly-priced assets can be. Stocks with stretched valuations and elevated expectations can be especially vulnerable to a shift in market narrative or policy direction. Against this backdrop, it should not be surprising for investors to be asking how exposed they are to the US, and whether overlooked or undervalued alternatives might now offer a more balanced route to long-term growth.
For investors thinking about diversifying their portfolios away from the US, the Schroders range of investment trusts offers plenty of options. From the unloved and undervalued domestic stock market, through the demographic growth tailwinds of Asia, to the resilience and dependability of bricks and mortar in commercial real estate. This is a time for specialism over generalism – for trusts that genuinely know their territory – as we outline below.
Until recently, few regional markets were looking as unloved as the UK. International investors had been reducing allocations steadily since before Brexit, with shrinking index weightings, political noise and a perceived lack of dynamism all perhaps serving as convenient reasons to look elsewhere. But capital flow data suggests that something profound is happening. US investors, in particular, have been buying UK stocks above all other international markets in 2025, taking advantage of others’ unwillingness to do so.
Taking a look at any number of UK quoted companies, the astute investor can see that the UK combines deep, liquid capital markets with high corporate governance standards, attractive dividend yields and a growing trend of value-enhancing share buybacks. While the domestic economic backdrop still faces challenges, it looks comparatively stable – especially when set against the policy uncertainty elsewhere. And with UK equities continuing to trade at a very significant discount to global peers, the valuation case is compelling.
Importantly, the UK market provides a different type of exposure to the US – with a higher weighting to traditional real economy sectors, a broader universe of high-yielding companies and a deep pool of small and mid-cap stocks more closely tied to the relatively benign outlook for the domestic economy. For investors looking to reduce their exposure to US concentration risk, these differences can offer meaningful diversification.
Schroder Income Growth Fund plc and Schroder UK Mid Cap Fund plc both demonstrate the value of selective, active exposure to UK equities. The former has a near 30-year track record of consistent dividend growth , delivered through astute stock picking and with flexibility to invest across the UK market cap spectrum whilst using the unique advantages of the investment trust structure to smooth and enhance income; the latter taps into the long-term potential of Britain’s “growth sweet spot”, companies that are profitable and cash generative, yet still able to grow at a superior rate, with a balanced exposure to both the UK and international markets.
For investors seeking a credible alternative to US technology, Asia offers an obvious starting point. The region is home to world-leading innovation in areas such as semiconductors, automation, clean energy and digital infrastructure. In many cases, these companies offer similar growth potential to their US counterparts, without the same degree of valuation risk.
But the appeal of Asia extends well beyond tech. Demographic tailwinds, rising consumption and growing incomes are reshaping economies across the region – offering investors a deep and diverse opportunity set. Export demand still matters, and to an extent, Asia’s economic momentum remains at the mercy of global trade dynamics. But the region also tends to benefit when the dollar weakens – a distinct possibility if capital begins to flow more meaningfully out of the US.
These dynamics play to the strengths of selective active management. Schroder AsiaPacific Fund plc, Schroder Asian Total Return and Schroder Oriental Income Fund Limited each provide specialist access to the region, but with different objectives. Whether investors are focused on income, growth or a combination of the two, the range offers something for everyone.
Japan also deserves special mention – not least because of the striking parallels with the US today. In the 1980s, Japan came to dominate global indices through years of outperformance that culminated in an asset price bubble. The correction that followed ushered in decades of underperformance – until recently. Now, Japan is re-emerging, with very attractive valuations, improving macroeconomic fundamentals and widespread corporate governance reforms driving higher shareholder returns. This is fertile ground for active managers with a strong stock-picking track record, such as Masaki Taketsume, who manages Schroder Japan Trust plc.
Real estate has long offered investors a distinctive combination of total return, dividends, diversification and inflation protection from an income perspective. Over the past five years, the sector has weathered considerable challenges – first the uncertainty triggered by the pandemic, then the valuation reset resulting from the sharp rise in interest rates from record lows in 2022. But that repricing now appears to be behind us. In many areas, valuations have stabilised. Some sectors – particularly industrial and logistics – have already seen a strong rebound, and there are signs that the recovery is beginning to broaden.
Schroders’ real estate trusts are well positioned to take advantage. Schroder Real Estate Investment Trust focuses on UK commercial property and is actively improving the energy credentials of its portfolio of assets. This “brown-to-green” strategy is underpinned by growing evidence of a green premium – with sustainable, energy-efficient assets commanding higher rents and stronger valuations.
Meanwhile, Schroder European Real Estate Investment Trust targets locations with strong fundamentals, solid long-term growth prospects and resilient occupier demand. These are not generic bets on the region, but carefully selected exposures to Europe’s ‘winning cities’, backed by data and deep local knowledge.
Active asset management remains essential in commercial property – and with the scale, experience and deep resources that Schroders brings, shareholders benefit from more than just property exposure. With much of the global macro uncertainty now emanating from the US, real estate in the UK and Europe can offer a grounded, regionally nuanced source of diversification.
We have thus far focused on the case for reallocating away from the US, but there are still areas where American leadership remains well founded – and worth preserving exposure to. Biotech is one of them.
The sector is underpinned by powerful long-term drivers. As populations age and healthcare demands rise, the need for more effective treatments continues to grow. Many of these advances originate in the biotech sector, where innovation has the potential not only to improve patient outcomes but also to reshape the economics of care.
Recently, the US biotech sector has been caught up in the wider backlash to growing political uncertainty in America, but long-term outcomes will ultimately be tied to company progress. While market sentiment and interest rates affect investor appetite for the sector, intrinsic value is driven by rapidly advancing innovation and burgeoning global demand, neither of which are affected by macro swings.
International Biotechnology Trust plc offers targeted access to this opportunity through rigorous stock selection with a risk management overlay, focusing on businesses with differentiated science, strong management and a clear commercial pathway. Despite its global mandate, the trust’s managers choose to invest more than three-quarters of its assets in the US, because America retains deep-rooted structural advantages in biotech. These include world-leading academic institutions, access to strong capital markets and funding, a deep pool of specialist talent and a regulatory environment that remains highly supportive of innovation.
As a result of these advantages, biotech is one of the few areas where the US retains genuine global leadership. For investors rethinking their US exposure, this may be one of the most compellingly sensible ways to stay invested in America’s strengths.
Diversification is one of the oldest principles in investing – but over the past decade, many investors have found themselves pulled increasingly into a single market, and indeed, a handful of stocks with similar characteristics. Strong returns have masked growing concentration risk. But as the global picture shifts, those risks are becoming harder to ignore.
What we may be seeing now is the beginning of a longer-term rotation – one prompted by valuation concerns, fundamental reassessments and a changing sense of where future opportunities – and risks – might reside.
From some perspectives, the concept of American exceptionalism still holds weight. The US remains one of the most innovative, dynamic and entrepreneurial economies in the world. But when it comes to the financial exceptionalism that has defined global markets for more than a decade, the signs of change are hard to miss. Valuations are elevated, political risks have clearly risen and the gravitational pull of US equities is no longer guaranteed.
For investors looking to reduce risk, restore balance and tap into a broader set of global opportunities, Schroders’ specialist investment trusts – spanning regions, sectors and a range of investment objectives – are well placed to support investors through this changing landscape .

We ask when boards are going to bite the bullet and switch to value.
Thomas McMahon
Updated 12 Nov 2025
This is not substantive investment research or a research recommendation, as it does not constitute substantive research or analysis. This material should be considered as general market commentary.
By now, most investors will have picked up on the fact that the main UK, European and Japanese indices have all outperformed the US index this year, in sterling terms. Despite the stunning returns to a handful of AI-related names like Nvidia, a weak dollar and, dare we say it, the better value outside America, has led to higher returns away from the US, the black hole that been sucking in all the headlines and the capital for the past three years. However, we wonder if many investors have realised yet that value has outperformed growth this year too? Well, to be clear, it is only outside the US that this is true: the MSCI ACWI ex US Value Index is well ahead of the growth index. This is true year to date, over a 12-month period and over three years, all thanks to a fairly sustained upswing in relative returns since February 2024.
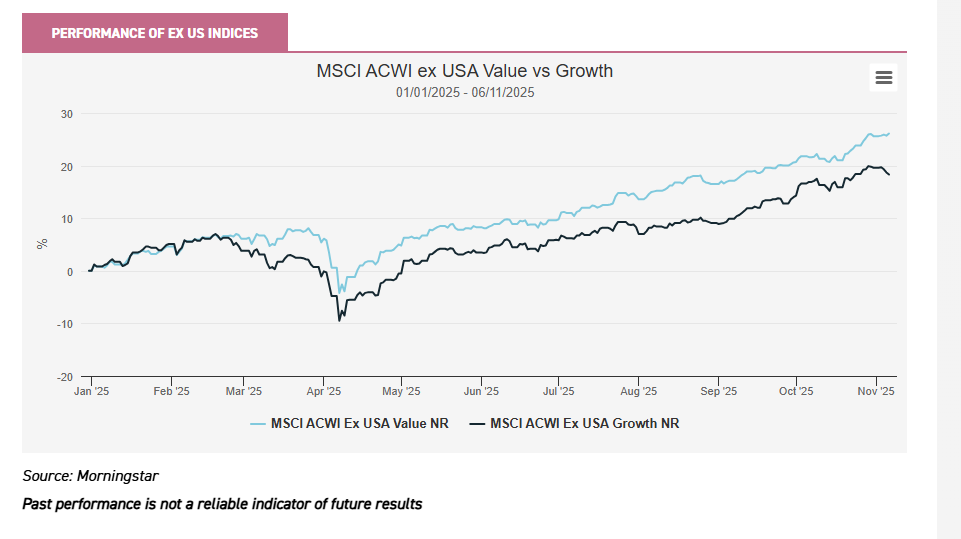
We think this shows that the market is being driven by AI, not by growth, an important distinction. In the major developed world indices, AI-related stocks have been amongst the top performers – SoftBank in Japan, ASML in Europe – but this has not prevented the value indices from outperforming the growth indices in either of these two markets, or in the UK. Other factors have been driving good returns from stocks with no connection to the artificial intelligence trade.
One commonality is the strong performance of banks in all three markets. In Japan, sustained modest inflation and wage increases have seen gently rising interest rates for the first time in decades, creating a positive macro picture for the industry. In the UK and Europe rates have actually been cut, but they remain high compared to the pre-COVID environment, so a reasonably positive environment for their margins remains. Economic growth could also be characterised as ‘getting worse, but slowly enough not to matter’ – there are no great signs of distress in businesses, which are muddling through on the whole, albeit with weak earnings growth. The strength of the rally – Barclays is up 52% this year and Lloyds 65%, for example, seems to be about the ‘value’. Markets are slowly re-rating businesses from deeply discounted levels, creating the stealth rally phenomenon so common when value strategies are successful.
We think one other factor behind this stealth value rally is the rebalancing away from the US we have seen this year, to a large extent by American investors. Morningstar flows data shows sustained inflows into European equities since January. We think investors looking to sell expensive American stocks have been drawn to cheap areas of the market in Europe, the UK and Japan, rather than switching expensive European stocks for their expensive US ones. Banks are also an obvious first place to look for general exposure to a market or an economy, for any investor looking to rebalance away from the US.
We have become accustomed in recent years to consider interest rates to be a key reason for the divergence in performance between growth and value in the pre- and post-COVID environment. If it was as simple as this, then the cuts that are expected in the US, UK and Europe would suggest growth will come back into favour. But in the long period of low interest rates there were other factors supporting growth equities too, one of which was the openness of global trade. Trade tensions and tariff barriers boost demand for materials and energy to build production and manufacturing facilities, increasing demand for products of typical value sectors. They also raise costs and therefore inflation, increasing the appeal of near-term cash flows by reducing confidence in the value of future ones.
Moreover, a less globalised world is one in which the opportunity for growth companies is smaller. Recent years have seen quality growth companies that were once kings of the market fall into disfavour, and the quality growth strategies that were so successful in the post-GFC period have struggled. Diageo, for example, may have had some internal issues, but its brands have been increasingly challenged by local names in China, like Kweichow Moutai. Similarly, the German automakers have been left behind in the electronic vehicle industry by companies like BYD, which is the largest seller of EVs globally. In fact, BYD accounted for 22% of electric and hybrid sales in 2024, with Tesla second at just 10%. BMW was fourth with 3.1% and VW seventh, with 2.6%.
The US’s largest economic concern at the moment has to be the race for AI dominance, not just because of the economic value in the industry but also the strategic importance of leading it economically as well as technologically. In our view, this fear is being ruthlessly exploited by Jensen Huang, Sam Altman and other executives in AI names who are looking to extract all possible support and subsidies out of the US government. We think the main concern for investors is that AI becomes another industry in which China copies, improves and surpasses its Western competitors. The success of Chinese alternatives to Nvidia, OpenAI and other companies in the value chain would materially reduce the potential cash flows for the US leaders, not only in China but in its potential customers, which could not fail to hit multiples via lowering expected growth rates, and therefore stock prices.
At the time of writing, some comments by key executives on the strategic importance of AI have spooked the markets, showing how vulnerable AI-related stocks are at very high valuations. Jensen Huang, president and chief executive of Nvidia, set the cat amongst the pigeons by saying that China “will win the AI race” before revising his comments to the softer “China is nanoseconds behind and the US must win”. Meanwhile, Sarah Friar, the chief financial officer of OpenAI suggested a government backstop for the financing of its data centre deals might be helpful (one friend asks if they will backstop his Wetherspoons tab too). We think it is obvious that these companies are lobbying hard, and using the Washington elite’s fear of China to gain an advantage.
More worryingly, OpenAI’s comments have been widely read as suggesting the company isn’t likely to find the funds elsewhere that are needed to finance its own operations for some time to come, and sounds suspiciously like an appeal for a bailout. They follow the announcement of a number of puzzling deals in the space with a slight circular outline. For example, Nvidia will invest $100bn in OpenAI to allow it to build data centres, for which it will buy Nvidia chips (with the money Nvidia has given it). OpenAI buys AMD chips and also receives warrants over its equity, which equity is boosted by OpenAI’s purchases. OpenAI will pay Oracle for cloud-hosting; Oracle will spend the money on Nvidia chips to run OpenAI’s services. Nvidia pays CoreWeave for cloud-services capacity, which will run on Nvidia chips, allowing OpenAI to use CoreWeave.
You don’t need to be a short-seller to get a little nervous about these deals. A vast amount of cash needs to be spent to fulfil a fraction of the promises that are being made to shareholders, and one of the major players in this series of deals, OpenAI, is unprofitable. Meanwhile Nvidia needs more and more cash to be spent on infrastructure if its own valuation is to be justified by growth rates. A cynic might suggest that the industry is trying to frighten the US government into becoming the next source of cash once the huge piles built up by the large-cap tech companies during the last 15 years have run out. Meta’s results last week saw a negative net cash position for the first time in years, for example.
Whether the cynicism is justified or not, the sharp correction seen in the share prices of Nvidia and related stocks shows how sensitive they are to changes in growth expectations. The 15% losses to Palantir shareholders last week give another example: the company is trading on sky-high P/Es, and seems to have taken a hit solely due to news that famous short-seller Michael Burry had a large short position in the shares.
In conclusion, we think there are plenty of signs that some sort of consolidation in the shares of AI companies will be necessary, if not a correction. For investors, there are two worries. The first is China taking the lead technologically and its companies winning market share and crimping the US champions’ growth potential, knocking the shares back. The second is the huge investment in AI infrastructure is not leading to profitable businesses using that infrastructure, and is therefore getting harder and harder to finance. In short, there is an awful lot of growth priced in to the shares of Nvidia and similar names, which means there simply isn’t the same scope for the shares to rise, even if the worst fears for the industry are misplaced. Nvidia’s impressive sterling returns of 34% are dwarfed by Lloyds’ 74%, for example. Investors don’t need to think artificial intelligence is going to fail to think the companies are going to underperform.
In our view, the chief bull case for value stocks, whether they be defined by sector – mining, oil, banks, utilities – or valuation metrics versus history, is that they are cheap and the artificial intelligence trade is over-extended. We don’t think the economic environment favours growth over value, but that the exciting new technology in the market has sucked in money chasing potentially huge growth. Now the shares have moved, a more realistic assessment is needed of the financial potential of the products. Investors have become massively overweight the artificial intelligence trade and the rebalancing of 2025 is likely to continue.
If this is reason enough to make sure you have exposure to value in your portfolio, it’s worth reviewing the options in the investment trust sector. Frankly, there aren’t that many left after a long period of growth outperformance, for one reason after another. We dug into the Morningstar database to look for those trusts with the greatest allocation to value stocks, which are defined by the average of a number of backwards- and forwards-looking financial metrics. Value stocks are roughly those in the cheapest third. There are only 16 out of 154 trusts for which there is data (the remainder are mostly invested in alternatives, real estate or private assets) with more than 50% of their portfolio invested in value stocks. Of these, ten are members of the AIC UK Equity Income sector (or the UK Equity & Bond Income sector of one).
The trust with the highest allocation to value is one of these, Temple Bar (TMPL). While an equity income strategy naturally leads managers into cheaper stocks, as they tend to have higher dividend yields, Temple Bar’s strategy explicitly targets value, with 75% of the portfolio in value stocks. This has helped the trust deliver exceptional NAV total returns, its 23.5% annualised over the past three years putting it in the top ten performers in the whole sector, behind mostly technology focused trusts and Golden Prospect Precious Metals (GPM), boosted by this year’s extraordinary rally in gold miners. Sector peer Aberdeen Equity Income (AEI) is a rounding error behind when it comes to value exposure, as the table below shows. Total returns haven’t been as good over three years, but in 2025 AEI’s NAV total return of 24.2% is close to TMPL’s 28.5%, and ahead of the UK market’s 21.8%. The rating of the share price is pretty close to TMPL’s though, with the trust on a small discount of 0.5% at the time of writing versus TMPL’s 0.8% premium. In fact, AEI has traded on a premium more frequently than TMPL this year, which we attribute to the exceptionally high yield. While manager Thomas Moore does target capital growth as well as yield, the trust really stands out on the latter metric, currently yielding 6%. It has been held back a bit this year by the mid- and small-cap bias, as it has been large-cap value that has really outperformed.

Source: Morningstar, as at 06/11/2025
We think smaller companies could be a potential source of opportunity in the next few years. If the rotation away from AI and the US continues, it could see a re-rating in the large-cap value areas that have been the first port of call, and investors could move on to small- and mid-caps to find deeper value. The managers of Aberforth Smaller Companies (ASL) have reported interest from US strategic and private equity buyers has risen over the past two years, with many taking advantage of rock-bottom valuations to acquire strong UK-listed businesses. But we think it is fair to say that this value argument hasn’t filtered through to the mass market investor, and UK small-caps remain deeply out of favour.
While ASL has outperformed the sector and small-cap indices over three years, returns have been more muted this year. Investors like to think of small-caps as a play on the UK economy, although this is a massive simplification and many UK small-caps are international earners. So, concerns about the UK economy may have been weighing on the market. However, as we have seen with the banks, if the bad news is all in the price, you don’t need good news for a re-rating. If investors start to look for value opportunities to diversify their portfolios, there could be no more obvious place to look than UK small-caps, and ASL and its stablemate Aberforth Geared Value & Income (AGVI) are the only two straightforward value options in the UK small-cap sector.
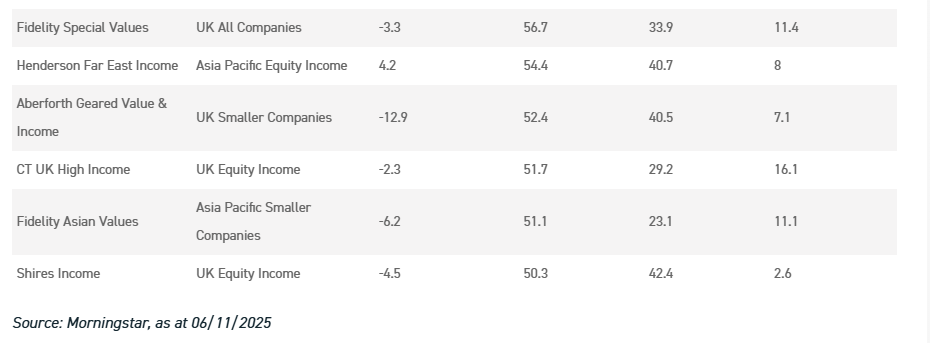
However, Fidelity Special Values (FSV) takes an all-of-market approach but has had a long-standing bias to small- and mid-caps, and manager Alex Wright’s contrarian approach means it could well benefit from any re-rating of cheap UK stocks in these segments. That said, trades in the large-cap space have been important to the trust’s success, including owning some of the UK banks, which he bought into when they were deeply out of favour. The strong performance means there isn’t the same discount opportunity as there is with some of its sector peers, with the discount at the time of writing being just 2%.
There aren’t many trusts investing outside the UK to have a strong value bias. Murray International (MYI) is one that stands out, with 60% exposure to value stocks. Positioning is generally contrarian, MYI having a long-standing underweight to the US on valuation grounds, which has been beneficial this year, helping the trust deliver NAV total returns of 24% as global developed market indices are up around 13%. MYI’s co-manager Samantha Fitzpatrick will be speaking at our online event, Real Dividend Heroes and Growth Giants, on 25/11/2025, and you can register to hear from her here.
MYI has long held a significant position in Asia and the emerging markets. Meanwhile, Henderson Far East Income (HFEL) and Fidelity Asian Values (FAV) are wholly focused on Asia and also have more than 50% in value stocks. HFEL is primarily an income fund, while FAV is a total return focused proposition run by managers with a contrarian approach. This has driven strong returns versus the benchmark this year, with an overweight to the cheaper Chinese market over the more expensive Indian market boosting returns in its recently reported results, as well as some good returns from idiosyncratic single stock positions.
It’s notable there are no Japan or Europe trusts in the list of trusts with the highest value exposure. The Europe sectors have certainly become very biased towards growth. The trust with the highest exposure is JPMorgan European Growth & Income (JEGI), which sets out to provide core exposure, using a mixture of value and growth metrics to select stocks. The managers tilted back towards domestic European earnings this year, which may have increased the value tilt.
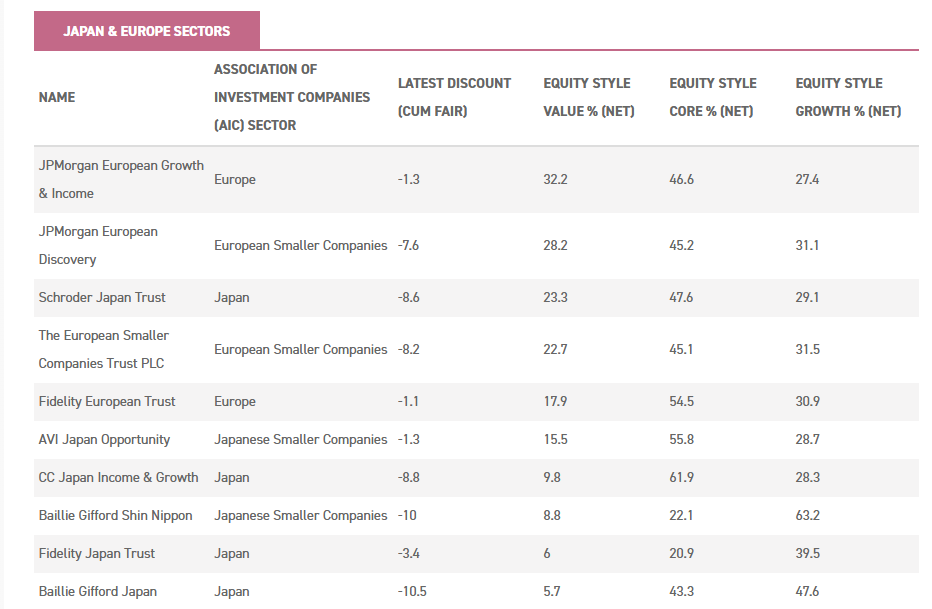
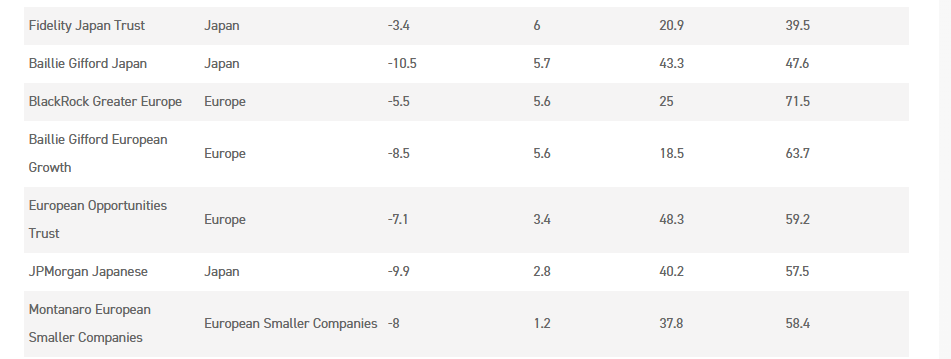
Source: Morningstar, as at 06/11/2025
In Japan, there are a few strategies we would classify as value but don’t show up as such in the table. Schroder Japan (SJG) for example, has a stock-picking process that zeroes in on value and has led it to deliver strong performance under manager Masaki Taketsume. In the small-cap sector, we would highlight AVI Japan Opportunity (AJOT), which takes an activist approach to investing in deeply discounted small-caps. We think the data doesn’t show much of a value bias because the Japanese market includes some extremely cheap companies, so even a typical value strategy might not have to go into the cheapest stocks to find outstanding value, particularly if the manager is looking for an operationally strong business too. Additionally, AJOT’s approach is to invest, engage and watch the business re-rate substantially; if a business is being held through this life cycle, then towards the end of the holding period it may be showing lower value characteristics and higher growth characteristics.
It’s clear that there aren’t many options for investors looking for a value approach left. We think this is why many of the trusts we have highlighted are trading on narrow discounts or indeed have been on slight premiums, even while the general perception remains that investment trusts are out of favour. Of course, those trading close to par are those that have shown good performance or a high yield, but we are suggesting that there is a good chance more of that will be produced by value strategies in the next few years. With so few value options to choose from, the upside pressure on share prices could become a pleasant problem for boards.
We should note, though, that the situation is not quite as bad as we have suggested. Our way of identifying a value strategy won’t capture all that could be grouped under that banner. We highlighted that a value strategy could easily lead managers into shares considered core by Morningstar, particularly when they re-rate. The data also can’t quite capture a portfolio such as that of AVI Global (AGT). AGT invests in companies with complicated structures that are trading well below their intrinsic value, which means mainly closed-ended funds, family-controlled holding companies and asset backed special situations in Japan. The managers’ assessment is based on their analysis of the underlying assets and their potential market value, which an analysis like Morningstar’s can’t capture. Indeed, over 25% of the portfolio isn’t graded growth, core or value by Morningstar at all. We think AGT could be a highly attractive source of growth opportunities if the market broadens out from the AI trade, and we provide a full update in the note we published this week.
In our view, boards and managers should be considering what new value strategies they can offer in the investment trust sector. The market currently seems under-served in most geographies, Europe in particular, and good performance by the value trusts should eventually lead to greater demand. It’s interesting to note the board of BlackRock Greater Europe (BRGE) appointing a new manager to the team in order to support the addition of some quality value ideas to the portfolio, citing the underperformance of growth in the current market; the board explains this was proposed by the manager, BlackRock. We think this might be a straw in the wind, and we might soon be seeing managers and private investors alike looking to increase their exposure to value.

© 2026 Passive Income Live
Theme by Anders Noren — Up ↑