GCP Infra is pleased to announce the publication of its investor report, which is available at http://www.gcpinfra.co.uk.
At 30 September 2025:
· The net asset value was, as previously announced, 101.40 pence per ordinary share;
· The Company was exposed to a diversified and partially inflation protected portfolio of 47 investments with an unaudited valuation of £858.9 million; and
· The portfolio had a weight-adjusted average annualised yield of 8.0%, principal outstanding of £912.2 million and an average life of 11 years.
Capital allocation
The Board reconfirms its commitment to the Company’s capital allocation policy set out in the 2024 Annual Report and Accounts, continuing to prioritise repayment of leverage, as well as reducing equity-like exposures and exposures in certain sectors, whilst also facilitating the return of £50.0 million of capital to shareholders. At 30 September 2025, the Company had £20.0 million (30 June 2025: £43.0 million) outstanding under its revolving credit arrangements, representing a net debt position of £8.0 million (30 June 2025: £36.2 million) which compares to the Company’s unaudited NAV of £848.7 million (30 June 2025: £864.1 million).
Further supporting the capital allocation policy, the Company bought back 8,937,270 ordinary shares in the quarter. In aggregate, the Company has purchased c. £23 million of shares since announcing the capital allocation policy.
The Company continues to progress transactions to dispose of assets in those sectors targeted in the capital allocation policy. If completed, such transactions would enable the Company to complete the capital allocation policy objectives of returning at least £50 million to shareholders and reducing the Company’s outstanding debt to nil. Further announcements will be made in due course, including as part of the Company’s annual report and financial statements, which are due to be published in December 2025.
Regional REIT Limited (LSE: RGL), the regional commercial property specialist, today announces a trading update for the three-month period from 1 July 2025 to 30 September 2025 and a dividend declaration for the third quarter of 2025.
Stephen Inglis, Head of ESR Europe LSPIM, Asset Manager commented:
“We remain committed to reducing leverage through our sales programme. During the quarter, we achieved £17.1m of disposals at 1% above 30 June 2025 valuation, reflecting good progress and we expect to achieve the upper end of our estimated £40m to £50m disposals for the full year. Leasing momentum has been negatively impacted by the uncertainty stemming from the broader economic environment and specifically by the inconsistent messaging from the UK Government regarding the forthcoming budget. The lack of clarity has led many prospective tenants to pause and adopt a ‘wait and see’ approach. While enquiry levels continue to improve, the time from initial enquiry to legal commitments remains lengthy.
In parallel, good progress continues to be made on the refinancing of the August 2026 banking facility with completion expected well ahead of maturity.”
Lettings and renewals update
During Q3 2025, 21 lettings to new tenants and renewals/regears were completed across 86,779 sq. ft., delivering £1.7m of annualised rental income. Retention remained high, with 87.0% of leases up for renewal remaining let to the same tenants at increased rents. Notably:
· Nine leases were exchanged during Q3, totaling 15,757 sq. ft., contributing £0.4m per annum (“pa”) of rental income and 8.3% above June 2025 ERV. This takes the total number of leases exchanged with new tenants since 1 January 2025 to 29 leases, totaling 134,180 sq. ft.; delivering £1.8m pa of rental income when fully occupied and reflecting 5.1% above June 2025 ERV
· Lease renewals in Q3 achieved a 5.2% uplift against June 2025 ERVs
· Post quarter end, four additional lettings and renewals/regears have been achieved across 44,416 sq. ft. providing £0.4m of annualised rental income
These figures reflect the Group’s commitment to improve occupancy, through tenant retention and leasing of vacant accommodation while driving rental growth through proactive asset management.
Portfolio update
· 118 properties, 1,242 units and 690 tenants, totaling c.£595.9m of gross property assets value (30 June 2025: £608.3m)
· Strategic disposals amounted to £17.1m (before costs), which were achieved at 1.0% above 30 June 2025 valuation and reflected a net initial yield of 7.1%
· The Kennedy Building, Leeds was acquired for £1.1m (before costs) providing full ownership of a strategic island development site by Leeds railway station
· Q3 CAPEX spend £3.4m; Q1-Q3 £9.4m
Continued operational delivery
During the quarter, the programme of strategic asset disposals and the net movement in lettings together influenced both the rent roll and occupancy.
· Rent roll of £54.3m (30 June 2025: £56.7m); ERV £80.8m (30 June 2025: £82.9m)
· EPRA Occupancy (by ERV) 76.8% (30 June 2025: 78.6%)
· EPRA Occupancy by portfolio segmentation*: Core 86.5%, CAPEX to Core 71.3%, Value Add 49.1%, and Sales at 61.4%
· Total rent collection for the quarter as at 5 November 2025 97.7%
* Core: well positioned to deliver sustainable long-term income; Capex to Core: targeted investment to upgrade assets to secure lettings; Value Add: assets with potential for repositioning and planning gains; Sales: assets targeted for disposal programme
Maintaining balance sheet discipline while delivering on strategy
· Cash and cash equivalent balances £54.4m (2024: £56.7m)
· Net loan-to-value ratio c. 41.8%*(2024: 41.8%)
· Gross borrowings £303.6m (2024: £316.7m) – following post period end disposals, borrowings amount to £282.0m
· Group cost of debt (incl. hedging) 3.4% pa (2024: 3.4% pa) -100% fixed and hedged. Good progress on refinancing the banking facility; completion expected well ahead of maturity of August 2026
· A further five disposals completed post quarter end totalling £13.3m (before costs), 4.6% above 30 June 2025 valuation. Year-to-date disposals amount to £38.1m (before costs), 1.8% above book value. Expect to complete further disposals during Q4 ahead of year-end, supporting portfolio repositioning and balance sheet strengthening.
* Gross property assets value based upon Colliers valuations as at 30 June 2025, adjusted for subsequent acquisitions, disposals and capital expenditure in the period.
Q3 2025 Dividend Declaration
As previously indicated, the Company will pay a dividend of 2.50 pence per share (“pps”) for the period 1 July 2025 to 30 September 2025. The entire dividend will be paid as a REIT property income distribution (“PID”).
Shareholders have the option to invest their dividend in a Dividend Reinvestment Plan (“DRIP”), and more details can be found on the Company’s website.
The key dates relating to this dividend are:
Ex-dividend date
20 November 2025
Record date
21 November 2025
Last day for DRIP election
15 December 2025
Payment date
09 January 2026
The level of future payment of dividends will be determined by the Board having regard to, among other factors, the financial position and performance of the Group at the relevant time, UK REIT requirements, the interest of shareholders and the long-term future of the Company.
Outlook
Regional REIT faces a subdued investment market with positive leasing momentum hampered by extended transaction timelines and persistent uncertainty. The Board remains focused on strategic disposals and repositioning assets to unlock planning-led value. Operational discipline and dividend continuity remain priorities, underpinned by proactive asset management.
The 1 “Killer” AI Dividend (7.9%) Almost No One Knows About
Brett Owens, Chief Investment Strategist Updated: November 11, 2025
We’ve got a sweet deal on one of my favorite AI dividends (current yield: 7.9%). And it’s not just because of last week’s stock market drop—though that does help.
Truth is, the bargain on this stout fund has been hanging around for a while now. But it’s on borrowed time indeed. We need to make our move.
Forget NVIDIA: This Is the Best AI Buy on the Board
The AI play in question is the Cohen & Steers Infrastructure Fund (UTF). It’s the closed-end fund (CEF) behind that 7.9% dividend (which, by the way, pays monthly).
In addition to the dividend, we like UTF because it’s a “tollbooth” play on AI. You won’t find an NVIDIA (NVDA) or a Microsoft (MSFT) here. Instead, UTF holds stocks that provide the servers, transmission lines and power plants that keep the AI—and indeed the whole digital economy—well-lit and connected.
AI’s voracious power demand is, of course, far from a secret. Data centers—the engines behind ChatGPT and its competitors—already account for about 4% of US electricity consumption, and that number is climbing fast.
And UTF is here for it. Around 35% of the fund’s holdings are in utilities, with another 18% in gas distributors and pipelines. The fund also holds about 15% of its assets in corporate bonds, which stand to gain as rates move lower.
(That, by the way, is exactly what I see happening as AI disrupts the job market and Jay Powell’s term ends in the spring; he’ll almost certainly be replaced by someone who will work with the administration to cut rates.)
All the big names you’d expect are here, including major utilities like NextEra Energy (NEE), Duke Energy (DUK) and Dominion Resources (D), gas distributors like Enbridge (ENB) and AI “backbones” such as cell-tower owner American Tower (AMT).
The fund is a holding of my Contrarian Income Report service, and is now in its second tour in our portfolio. Since we bought it in November 2020, it’s returned a tidy 40% for us—not bad for a “sleepy” fund like this in a period of mostly rising rates.
And in its first tour, from 2016 to 2019, the fund did even better, nearly doubling on a total-return basis. Given the discount it sports now (more on that in a sec) and much more favorable rate setup, this is the kind of return I expect in the next couple of years.
Before we get to the discount, let’s swing back to that dividend for a moment, because it really is about as steady as they come—and has even seen a modest uptick in the last couple of months:
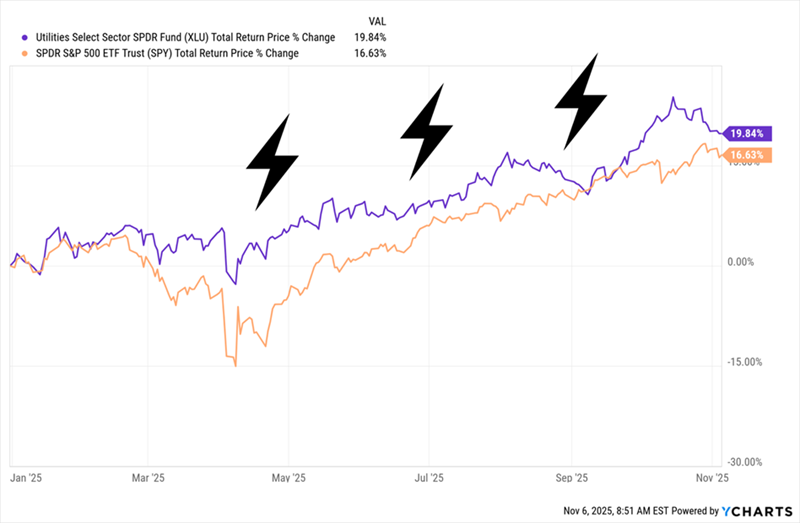
AI’s thirst for electricity has sent the utilities sector—shown below by the performance of the go-to utility ETF, the Utilities Select Sector SPDR Fund (XLU), soaring past the S&P 500 this year:
AI Drives Utilities Past Stocks This Year
This is not normal. This “low-drama” sector almost always trails stocks, and by wide margins, too. But while XLU—and many individual utility stocks—are crowded trades, UTF is anything but.
To get at the deal on offer here, we need to first remember that CEFs like UTF generally have a fixed share count for their entire lives. So they can, and often do, trade at different levels (discounts and premiums) to their net asset values, or NAVs. (NAV is another way of referring to the value of the fund’s underlying portfolio.)
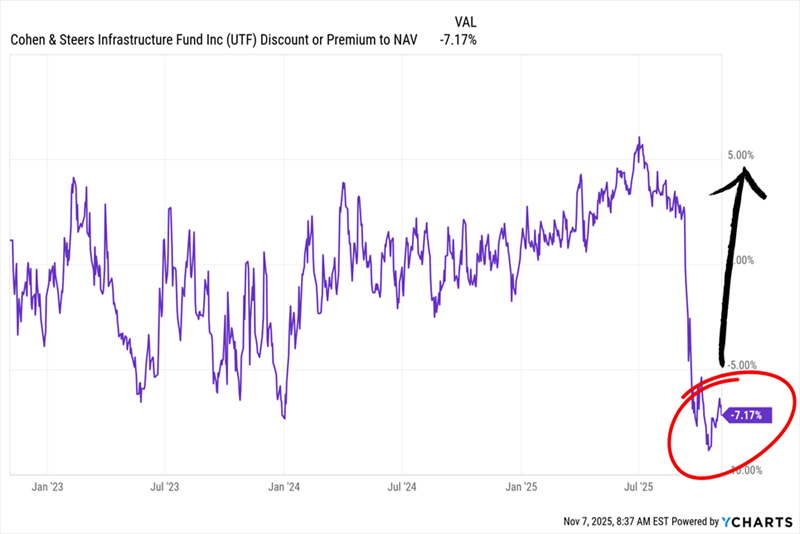
And right now, UTF is doing something few other utility plays are—it’s trading at a steep, and sudden, discount:
UTF Drops to a Discount (That’s Now Starting to Narrow)
That’s weird, given that pretty well everything is going UTF’s way right now. So why does this deal exist?
The reason goes back to the fixed share count I just mentioned. Because while CEFs don’t issue shares like regular stocks, they do sometimes offer existing investors the right to buy more. That’s what UTF has done. And the resulting fear of dilution prompted some shareholders to sell—driving that huge discount you see above.
Now it’s fair to doubt that a share issue could cause such a violent move, and lucky for us, with CEFs, we have a way to check.
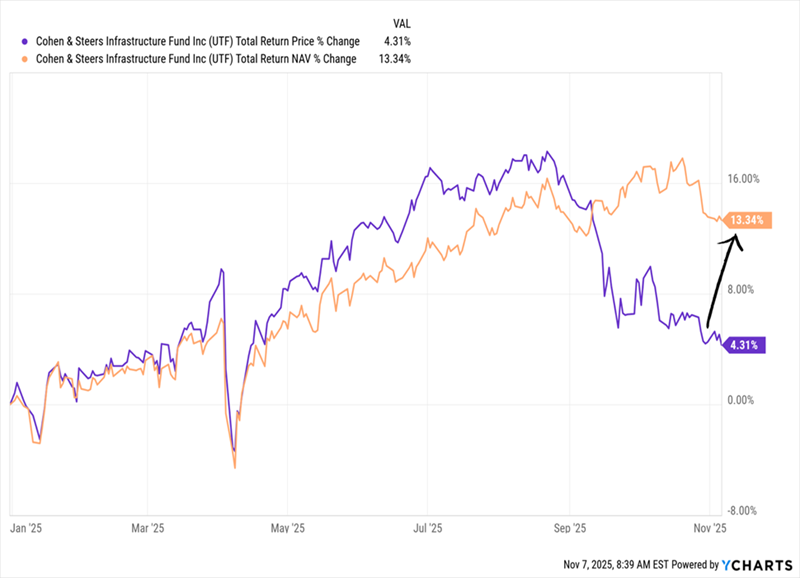
Market Price Plunges, NAV Plods Along Unaffected
With CEFs, when we get a setup like this, we simply need to look at the fund’s portfolio in isolation (something we can’t do with ETFs) and see what its real performance is doing. If it’s ticking along, as is the case here (see orange line above), we’ve almost certainly got a good buy setup.
That’s another reason why CEFs are smart contrarian investments. In regular stocks and ETFs, a bargain like this would appear and disappear fast—likely too fast for us regular folks to pounce. Not so with CEFs, because:
CEFs are a small market, so big “discount swings” often go unnoticed for quite a while, and …
CEF buyers tend to be risk-averse, so they’re quick to overreact to temporary worries, like a share issue.
Moreover, despite the slow-motion response to this drop, the fund’s discount is starting to close. It’s only a matter of time before its market price reassumes its rightful level above NAV. The time to make our move is now.
2025 is now a wrap, having achieved the fcast and the target.
Income of around £11,986. Now it’s time to turn to 2026.
Current expected quarter dividends £2,395.00
Total for 2026 £9,584.00.
While it’s possible that some dividends may be held or cut, some dividends will increase gently. To the total you have to add income as the dividends are re-invested, which should mean the Snowball should meet its fcast and its target.
We declared four interim dividends in respect of the year ended 31 August 2025. These amounted to 24.90p per ordinary share, an increase of 1.2% over the prior year and maintaining our 18 year track record of increasing dividends.
The dividend has been substantially covered by portfolio revenues with a contribution of only £1.5m from reserves. A return to corporate dividend growth in the region gives us confidence that our long-term dividend growth opportunities remain very much intact for the future.
Initial response to the Government consultation on changes to inflation indexation in the Renewables Obligation scheme, market backdrop and capital allocation update
Renewables Obligation Consultation
On 31 October 2025, the UK Government published a consultation on potential changes to the inflation indexation in the Renewables Obligation (“RO“) scheme. The RO consultation has two options (noting that the consultation also invites suggestions for alternative options):
1. Switch the indexation on the RO buy-out price from the Retail Price Index (“RPI“) to the Consumer Price Index (“CPI“) from March 2026;
2. Freeze the current RO buy-out price until CPI catches up with RPI, in effect as if the RO buy-out price had always been inflated by CPI. Thereafter, CPI would apply. By the Government’s estimates, the catch up would occur around 2034/5 and so the RO buy-out price would remain frozen until then.
Based on the information available, initial calculations by the Investment Manager indicate that the impact of option 1 would reduce the latest reported NAV per share of the Company by 2.4p and option 2 by 10.6p.
The overarching policy aim is to reduce consumer bills given the costs of the RO are ultimately levied on consumers. By the Government’s own calculations, option 1 would save “approximately £3 per year for an average UK household” in 2030/31.
Whilst we draft our full response to the consultation, as well as engage directly with Government and peers, the Board and Investment Manager felt it helpful to set out some of the arguments we will make on behalf of investors and consumers.
Investors have made good faith investments into UK renewable energy projects based on stable, government-backed, inflation-linked support. Retrospective revision to the RO will inevitably erode investor confidence. The listed renewables market is a bellwether for investor sentiment and, in the five trading days that followed the Government’s announcement, the six largest UK listed renewable funds[1] saw their combined market cap fall by circa £400 million / 5%.
Investor confidence is also expressed through the cost of capital; we anticipate that investors will demand a higher return on new investments to compensate for the risk of further Government intervention. A small increase in the cost of capital would substantially increase the cost to consumers of new renewable energy projects and can reasonably be expected to outweigh the purported savings to consumers and so serve to increase, rather than decrease, bills.
The role of renewables in the UK electricity market
UK electrical demand is, conservatively, set to increase by 30% by 2035, driven by the electrification of transport, heat and the expansion of data centre capacity. This sits against a backdrop of scheduled plant retirements in the next decade, with a quarter of the UK’s nuclear fleet and 20% of the gas fleet set to retire.
Renewable energy projects, in particular onshore wind and ground-mounted solar, remain the cheapest and quickest to build forms of new generation in the UK. It is therefore vital to retain investor and consumer support for renewable energy projects.
The renewable energy sector must also show what it has done, and can do, to reduce bills for consumers.
Specifically, renewables can further reduce consumer bills in the near term. The Review of Electricity Market Arrangements consultation included discussion of a voluntary Contract for Difference, where existing generators could agree to a fixed electricity price below the prevailing wholesale price. Generators and investors would receive price certainty through a scheme that is voluntary, and consumers would enjoy a price lower than the current market level without volatility.
Depending on take up, we estimate that this could reduce consumer bills by £30 per annum for an average UK household – substantially more than the proposed changes to RO indexation. It could also be delivered relatively quickly. Investors could expect such an arrangement to be value neutral.
We will continue to engage with Government on this, and other ways, so that the sector and Government can work together to reduce bills whilst maintaining investor confidence.
Market Backdrop and Capital Allocation Update
Notwithstanding the impact of the RO Consultation on sentiment towards the listed renewables market, the Board and the Investment Manager are fully engaged and actively working to improve the Company’s overall attractiveness for shareholders.
The fees for the Investment Manager are already fully aligned with shareholders by reference to market capitalisation, which continues to be unmatched by peers, and disciplined capital allocation remains a key priority, in particular:
· UKW reiterates its 10.35p dividend target for 2025, representing an annual distribution to shareholders of approximately £225m;
· In the past 12 months, UKW has completed £222m of assets disposals at NAV with proceeds allocated to debt repayment and share buybacks;
· As at 10 November 2025, UKW had completed £198m of share buybacks from its announced £200m total buyback programme. Share buybacks completed to date have added 1.7p per share to NAV.
As the Company approaches completion of its £200m total buyback programme, it is working towards further asset disposals, with a range of potential buyers. Furthermore, underlying asset cashflows are expected to increase as we enter the seasonally higher winter cash generation period and UKW continues to benefit from structurally high forecast dividend cover.
The Board and Investment Manager remain confident in their ability to allocate excess capital across further buybacks and de-gearing whilst maintaining strategic flexibility for the Company. This puts the Company in a position of strength from which to assess future capital allocation priorities.
Lucinda Riches, Chairman of UKW, said:
“The Board and the Investment Manager recognise the complexity of the market and are committed to enhancing the Company’s long-term attractiveness for our shareholders.
We will continue to navigate this market backdrop through strong sector leadership and disciplined capital allocation. Our attractive proposition and track record since IPO positions us well and we are resolutely focused on doing the right thing for shareholders.”
Potential Impact of UK Renewable Obligation Certificate and Feed in Tariff Consultation
On 31 October 2025, the UK’s Department for Energy Security and Net Zero (“DESNZ”) published a consultation regarding potential changes to the indexation of Renewable Obligation Certificates (“ROC”) and Feed-in Tariffs (“FiT”). The consultation presents two options that could potentially affect NextEnergy Solar Fund’s Net Asset Value (“NAV”).
What are the ROC and FiT schemes?
The UK’s ROC and FiT schemes were designed and introduced by the UK Government to encourage investment in renewable electricity generation by providing long-term certainty of stable inflation-linked revenues. The ROC scheme supports large-scale generators by awarding certificates for each megawatt-hour of renewable electricity produced. Energy suppliers are obliged to buy the ROCs, providing a guaranteed and predictable source of income for generators. The FiT scheme helps smaller-scale generators by paying for both the electricity they generate and any surplus they export to the grid based on inflation-linked pricing set by the UK Government. These schemes have been instrumental in making renewable energy projects in the UK financially viable. Both schemes have now closed to new applicants and been replaced by newer schemes like Contracts for Difference.
How does ROC and FiT indexation work?
Currently, both ROC and FiT schemes adjust payments for inflation using the Retail Price Index (“RPI”). Both are calculated using the previous year’s RPI and applied from 1 April each year. As previously announced (and already reflected in the Company’s NAV), RPI will be retired as a measure of inflation from 2030 and the ROC and FiT schemes will instead use the Consumer Price Index (“CPI”). As a measure of inflation, RPI has historically been higher than CPI.
What does the consultation propose?
DESNZ proposes to change the current approach to indexation of the ROC and FiT schemes. Two potential options are proposed, both summarised below.
What are the two proposed options in the consultation and what is the estimated impact on NESF, if either is adopted?
As of 30 June 2025, approximately 50% of the Company’s total revenues were derived from the UK’s ROC and FiT schemes.
Option 1 – An immediate switch to CPI indexation from RPI:
•
What it means: The UK Government would change the inflation measure for ROC buy-out prices and FiT prices from RPI to CPI, effective from April 2026.
•
How it would work: Annual ROC and FiT prices would continue to be adjusted in line with inflation but would be linked to CPI instead of RPI.
•
Potential impact on NextEnergy Solar Fund if this option was adopted and applied to the 30 June 2025 NAV:
Estimated impact on NAV per Ordinary Share
Estimated % impact on NAV
Option 1
c. -2p
c. -2%
Option 2 – An immediate, temporary freeze to the ROC and FiT prices:
•
What it means: The UK Government would temporarily freeze the ROC buy-out prices and FiT prices, effective from April 2026.
•
How it would work: ROC buy-out prices and FiT prices would be fixed temporarily at their current rate. The UK Government would calculate ‘shadow’ price schedules for ROC buy-out prices and FiT prices as if CPI had been the relevant measure of inflation from 2002. No further inflation-linked increases would be applied to ROC buy-out prices or FiT prices until the relevant ‘shadow’ price reaches the current rate. From that point onwards, annual indexation would resume in line with CPI.
•
Potential impact on NextEnergy Solar Fund if this option was adopted and applied to the 30 June 2025 NAV:
Estimated impact on NAV per Ordinary Share
Estimated % impact on NAV
Option 2
c. -8p
c. -9%
Investors should note that these are proposals around which the UK Government is currently consulting, and there is no certainty that either proposal will be implemented.
Investors should also note that the Company’s estimations currently consider only the direct impacts of the potential changes to the Company’s ROC and FiT revenues and are based on the limited information published by the UK Government in the consultation documentation. At this stage it is not possible for the estimations to take into account countervailing impacts of the investment uncertainty introduced by the proposals, such as increases in wholesale power prices caused by increases in the cost of financing the planned increase in UK renewable generation capacity.
Baillie Gifford Japan Trust PLC ex-dividend date BlackRock American Income Trust PLC ex-dividend date Fidelity Asian Values PLC ex-dividend date Fidelity Emerging Markets Ltd ex-dividend date GCP Infrastructure Investments Ltd ex-dividend date Greencoat UK Wind PLC ex-dividend date ICG Enterprise Trust PLC ex-dividend date International Public Partnerships Ltd ex-dividend date Majedie Investments PLC ex-dividend date Murray Income Trust PLC ex-dividend date New Star Investment Trust PLC ex-dividend date Octopus Renewables Infrastructure Trust PLC ex-dividend date Pershing Square Holdings Ltd ex-dividend date PRS REIT PLC ex-dividend date Schroder BSC Social Impact Trust PLC ex-dividend date Target Healthcare REIT PLC ex-dividend date
I’m reluctant to post the portfolio for the Snowball as always it’s about buying shares to earn dividends to buy more shares that pay dividends. So although a share is currently in the portfolio, I might not buy today using the current information in the Market.