
May the world find some peace.
Investment Trust Dividends
May the world find some peace.

2023
The Snowball earned income of £9,422.00
2024
The Snowball earned income of £10,786.00
2025
The Snowball earned income of £11,914.00
The target for 2026 remains at 10k.
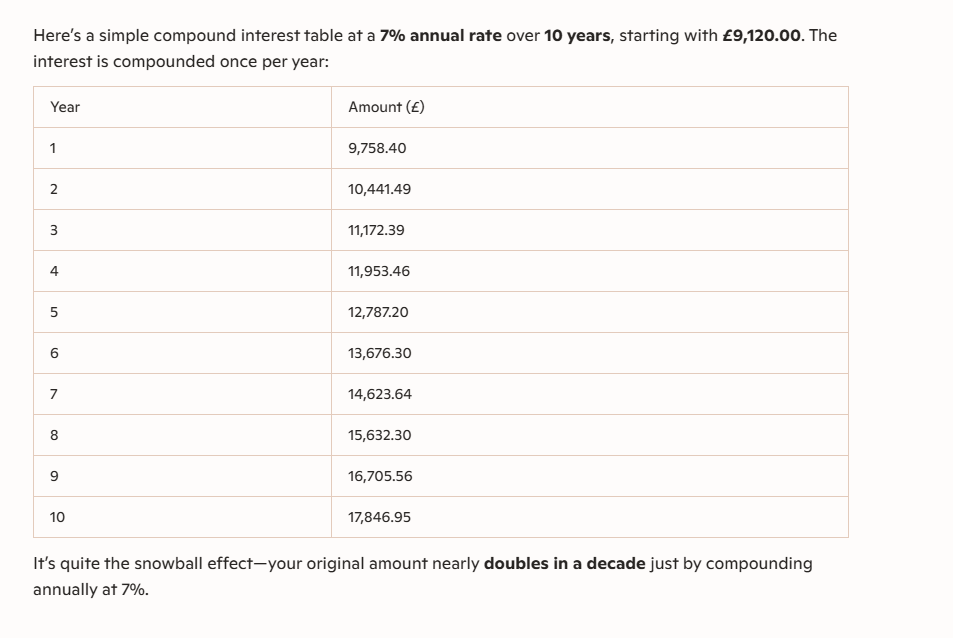
For comparison, the current value of VWRP is £151,722.
Using the 4% rule that would provide a pension of £5,350.00, after withdrawing 3 years of a cash buffer. That is after one of the best years for a TR strategy in recent memory.


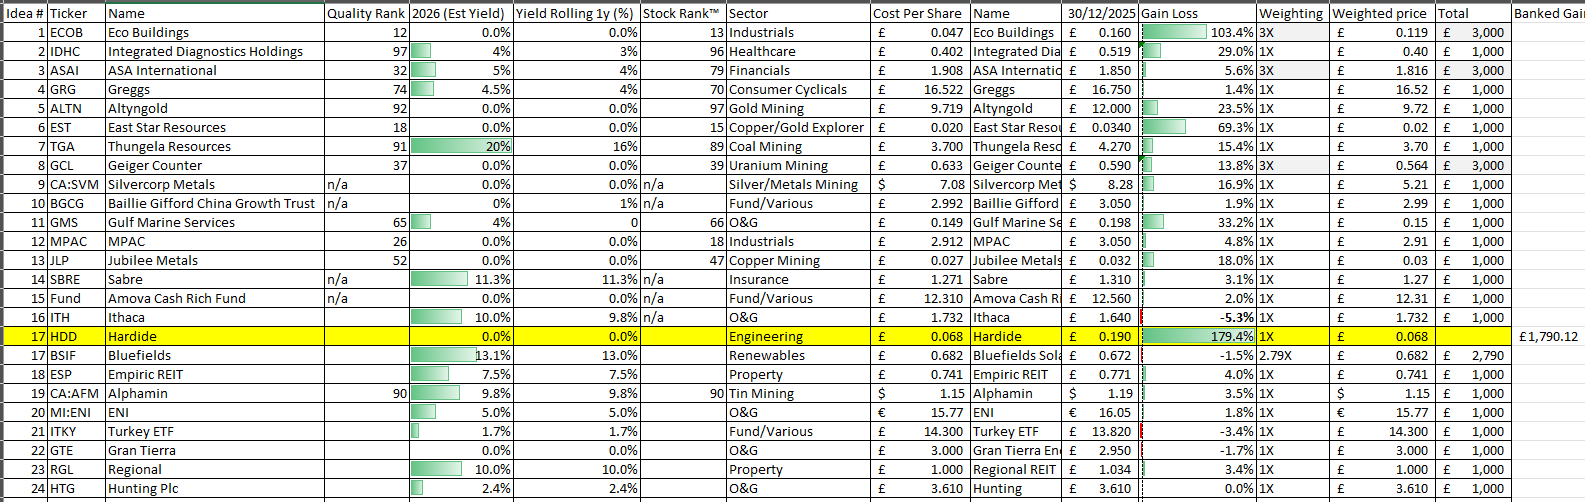
I’ve bought for the Snowball a further1566 shares in FSFL Foresight Solar
Yielding 12.6% and trading at discount to NAV of 38%.
Dec 30, 2025

Dear reader,
BSIF
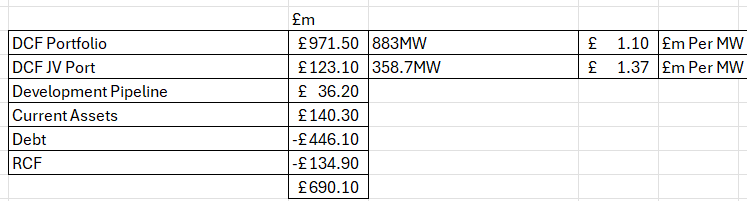
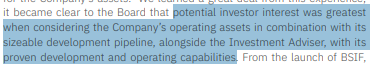
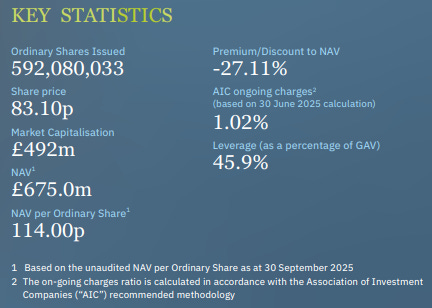
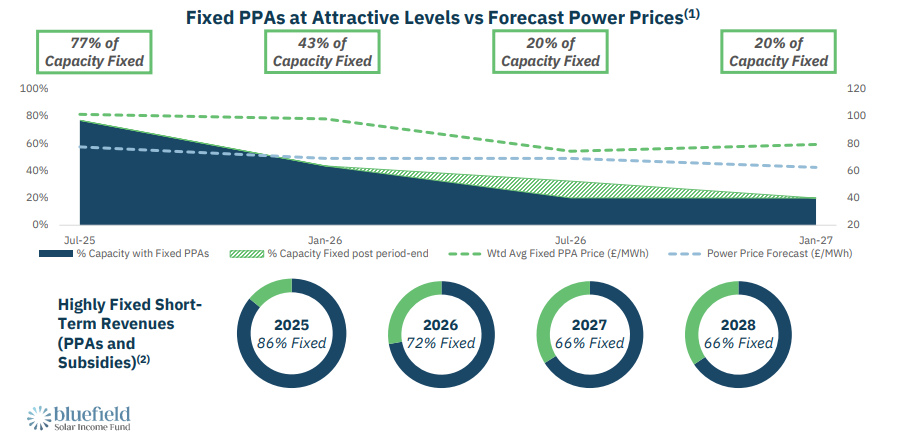
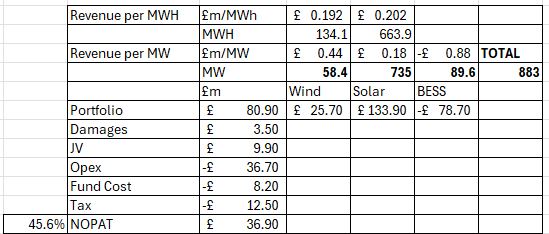
Pay £400m to get assets valued at £690.1m (as at 30/06) falling to £675m (as at 30/09) which pays a divi of 13.1% at today’s 68.60p buy. 9p a year. A slippery slope or an opportunity?
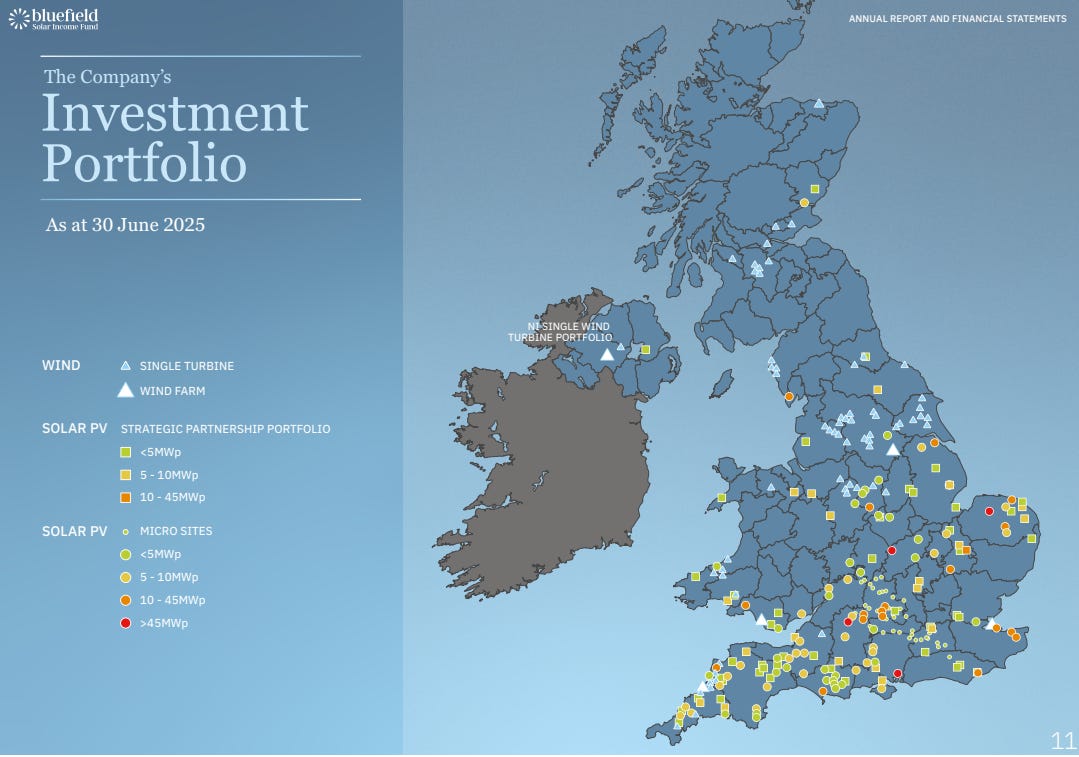
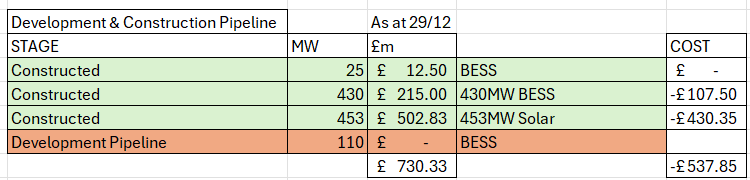
These are the assets: All within the UK. Mainly solar with attached BESS, plus some onshore wind assets.
This is the composition of the NAV.
Bluefields (ticker BSIF) investment objective is to provide Shareholders with an attractive return, principally in the form of regular income distributions, by being invested primarily in solar energy assets located in the UK. The Company also invests a minority of its capital into other renewable assets including wind and energy storage.
BSIF is up for sale as a going concern. The sum of its parts exceeds its NAV according to potential buyers. Hmm.

If that’s true then investors soon won’t be Blue.
Today’s potential buyers at 68.6p buy price would be in the green – since that price implies a more than -40% discount, plus a 13.1% dividend yield meanwhile.
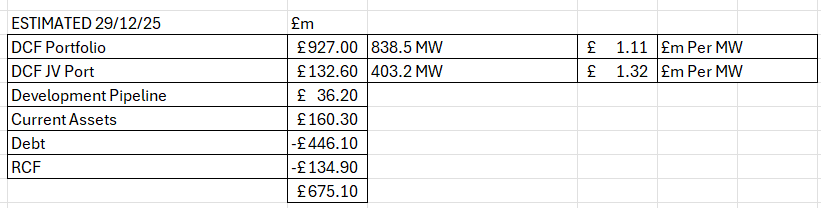
The main portfolio comprised at 30/06 of 883MW of solar and wind assets. These were valued at £1.1m per MW of generating capacity including the attached BESS (there is no separate valuation given to the BESS assets, strangely, only to the generating capacity. This capacity reduced by -44.5MW to 838.5MW in August 2025, as “Phase 3” of its strategic partnership completed, where the assets were sold at NAV to its JV.
Other assets which have no separate valuation value were transferred too. 25MW of BESS and 180MW of development portfolio comprising “four ready to build solar assets” were thrown in too. Three of these have CfD subsidies secured under the AR5 or AR6 schemes.
BSIF then owns 25% of that same JV valued at £123.1m which comprised of 358.7MW of capacity – equating to a valuation of £1.37m per MW. So 403.2MW post period.
So the estimated portfolio looks like this now:
Yes, well, you see the way that BSIF “should” work is capital pours in and develops further assets generating further returns. But guess what?
The capital has dried up.
There is an inability to raise further funds at a discount to NAV, and debt grew expensive (albeit is falling in cost and is starting to look attractive again).
Certainly an outside buyer would be weighing up the numbers and rubbing their chin. Like I am.
Meanwhile a large pipeline is sat there largely unaddressed. The valuation of this is not in the price. 25MW of pre-construction BESS at £0.2m per MW is 60% below what GSF value theirs for (£0.5m per MW). Or 60% below what Harmony ticker HEIT (a BESS asset IT) sold for in mid 2025.
That alone is £7.5m of potential hidden value.
Solar Park construction costs per MW in 2025 range from £0.6m to £0.95m per MW while BESS is around £0.25m per MW (even though the batteries themselves are now £0.1m per MW again as indicated by GSF).
So taking into account the 180MW of consented we have this much remaining.
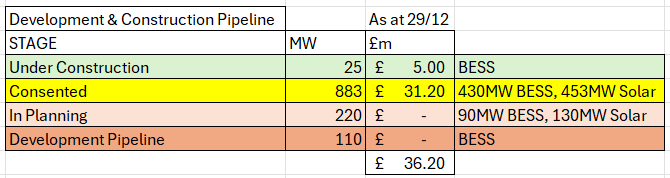
So if the Consented element were constructed (i.e. assigning zero value to In Planning and Development Pipeline and just considering the “Consented” yellow stuff) what would that mean?
A gain of around £150m. So not worth nothing…. if given away in a 25% JV then the upside is still around £40m…. or double today’s valuation in the NAV (of £36m).
Worth double even if it’s given away to a JV. Think about that.
Of course it’s not this simple, and the connection date matters too. These vary. So this isn’t a slam dunk to riches, but there is value to unlock. However HAVING a scheduled connection is worth a lot. There is a long queue for a newcomer to connect energy assets to the grid. That’s part of the hidden value here.


Obviously, the question turns to well, are these assets really worth £1.1m per MW? Or more? They were worth 12% more last year ….. £1.24m per MW at 30/06/24 and a lower revaluation due to power prices were the main reason for the NAV to drop and for BSIF to record a loss in FY25.

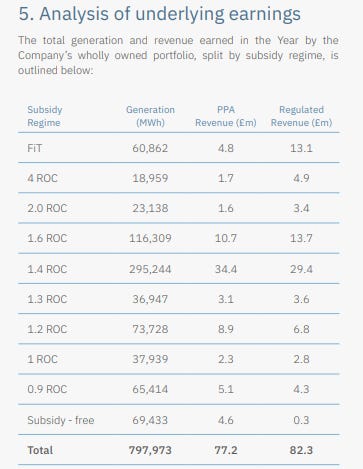
Income Analysis:

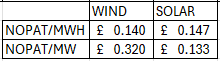
Those assets delivered £161.8m of revenue in FY25, varying between £0.44m per MW for Wind and £0.18m per MW for Solar.
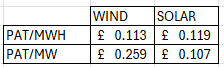
If you consider net operating profit after tax was 72.8% then the assets delivered £0.14m – £0.147m per MWH which is a price divided by pre-interest earnings of 7.5X – 8X.
Now, you’ll notice I’ve gone with NOPAT – net operating profit after tax – but avoided interest costs. That’s deliberate because I wanted to see the earnings relative to the enterprise value and EV/EBITDA is too crude.
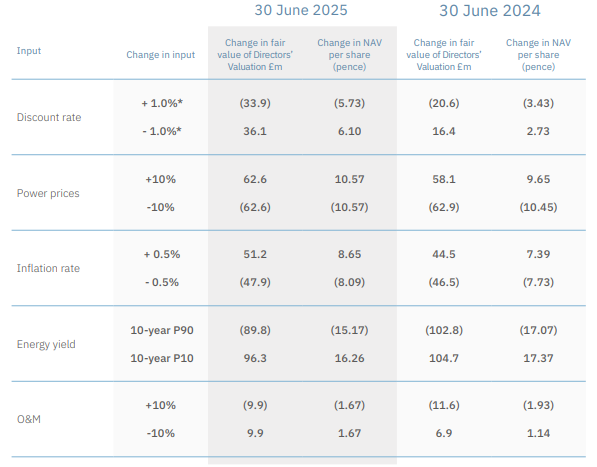
£140,000 per MW is far higher than what the Discounted Cash Flow approach to calculating NAV would imply a 55% upside:

In case you’re curious, the NAV is about 25% higher once you use PAT discounted at 8%.
Of course my calculations assume a flat income based on the prior year numbers. Power Curves and Inflation are increasing and reducing forces.
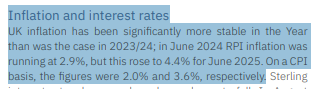
On one hand, RPI assumed at 3% boosts revenues until 2032. That’s how the subsidy reaches 64% that year. BSIF is a beneficiary to inflation. (Although refer to undermined confidence later)

Along with most other electricity generators BSIF is dogged by the 3 leading power forecasters who believe that electricity prices will fall in the period 2025-2030.
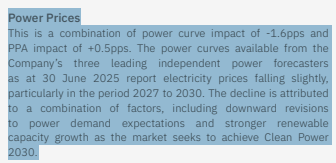
Their 2025 forecasts – as usual – have failed, and prices have been rising since early 2025 and stand at £85/MWh as I write vs the £65/MWh they “forecast”.

In any case, BSIF lock in 1 year to 3 year PPAs to insulate themselves just in case one day their forecasts end up being in any way accurate.
Now it’s also true that while electricity have NOT dropped, renewable electricty producers’ share prices HAVE fallen including at BSIF. Why? That is due to everyone’s favourite politician, Ed Milli.
The government recently threatened to do the dirty on the renewables sector, altering their contracted income and moving their increases from RPI to CPI. Good old Milli, moving the goalposts just like a tinpot republic would – never too far away from courting disaster.
Since the remaining average life of assets at BSIF is 25.5 years the impact if the simple switch approach is taken would be 2% of NAV while the harsher freeze approach would impact NAV by around 8%.

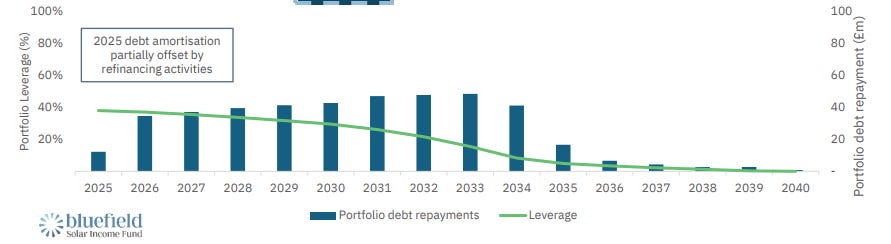
There’s no particular cliff edge to deal with, and the RCF of £135m has a three year life, and costs 1.85%+SOFR (so ~5.1%). The other debt is mainly fixed at 3.95%. Very competitive – and attractive.
The fund can earn leveraged profits on this debt – and does.

Of course there’s no reason why 30 years is the limit for these assets, and life extensions and upgrades remain possible.
Debt is largely amortising and depreciation is 30 years so as subsidies naturally end at the end of their 15-25 years (the terms differ for each AR/CfD/FiT/RoC scheme) then so do corresponding costs reduce too.
It is also worth contemplating what life under a David Turver inspired government might look like. What if the government completely pulled the plug on subsidies? If Reform came to power that could be a vote winning policy – we’ll slash your bills etc etc – let’s reopen the mines and burn some coal instead.
If that happened, based on the current year accounts, revenue would approximately halve. Obviously the impact fades with each year and the earliest one might think this could happen would be 2029, unless the Labour government collapses.
The fund in FY25 would have earned £37m in FY25 (a 45.6% NOPAT margin) and £15m PAT, and paying over -£54m of dividends would be out of the question. Of course one wonders whether the ensuing chaos of such a policy change would lead to much higher electricity prices, and those prices would insulate a power generator to some extent.
You’d not be able to reopen coal mines and coal power stations quickly and what would energy generators do if the government did this? Stop generating? Or accept new terms.
Of course the other effect would be longer term picture of enjoying inflation-protected subsidy rises would be gone. That’s 50% today but grows to 64% of revenue which is subsidised by 2032 based on the effect of RPI increases (assumed at 3%)
If inflation were higher than 3% in the coming years that would be worth 8.65p per share to BSIF in extra subsidies, and if the 3 leading power forecasters continue to be wrong then the current 15% higher power prices are worth 16p a share more to BSIF.
It remains quite unfashionable to be invested into these companies. There is a chance that the government will follow through on doing its dirty, so there’s a chance this share could fall lower – as harrumphers offload it once the consultation concludes. Although losing 1%-2% NAV when the discount is 40% seems an ok risk.
Equally though, there’s a chance the government would cave in – just like they have with many others. Will a £5 change to people’s energy bill change at a cost of torpedoing a cornerstone policy, be a vote winner? The farmers were celebrating a recent win against inheritance tax I believe, joining all sorts of public sector workers celebrating large pay rises.
You can offer reasons for and against the NAV being a bit more or a bit less than today’s current NAV. You can be like me and be pretty sceptical about the accuracy of power curves, or can be sceptical about government’s willingness to curtail inflation. BSIF would be a beneficiary to either. But if I’m wrong on either or both then it’s already priced in. It’s a one-way bet with no stake.
What I cannot see however is how BSIF would sell for below 40% less than its NAV i.e. to actually lose money in the event of a sale. Much like HEIT was like this.
Is the sale guaranteed? No. But if it didn’t happen even for a few years just relax and earn a covered 13% yield – well that’s a hardship isn’t it?
Regards
The Oak Bloke
Disclaimers:
This is not advice – you make your own investment decisions.
Micro cap and Nano cap holdings might have a higher risk and higher volatility than companies that are traditionally defined as “blue chip”

JD Henning
Investing Group Leader

“Timing, perseverance, and 10 years of trying will eventually make you look like an overnight success.” ― Biz Stone, co-founder of Twitter.
Timing matters, and it matters greatly. I have spent the last 35 years trading, researching, and constructing algorithms to identify and leverage the value across fundamental, technical, and behavioral finance models. Of the ten portfolio models designed for optimal portfolio mixes for members to beat the market at Value & Momentum Breakouts, eight come from enhancing well-tested anomaly research in published financial journals. All of the models continue to outperform the S&P 500 in live forward testing here on Seeking Alpha, and again this year.

This article builds on my prior 2026 outlook articles with a more focused look at one of our top models from published financial literature that I have found to consistently outperform in good and bad seasons.
I am a strong advocate for leveraging the strengths of different fields of financial analysis, from fundamental to technical to a wide variety of behavioral variables. These approaches each can deliver successful model portfolios, as documented through our live trading on Seeking Alpha the last 9 years.
The thing to consider is that we rarely ever see market leaders from the prior year be market leaders for the coming year. ~ JD Henning, January Podcast
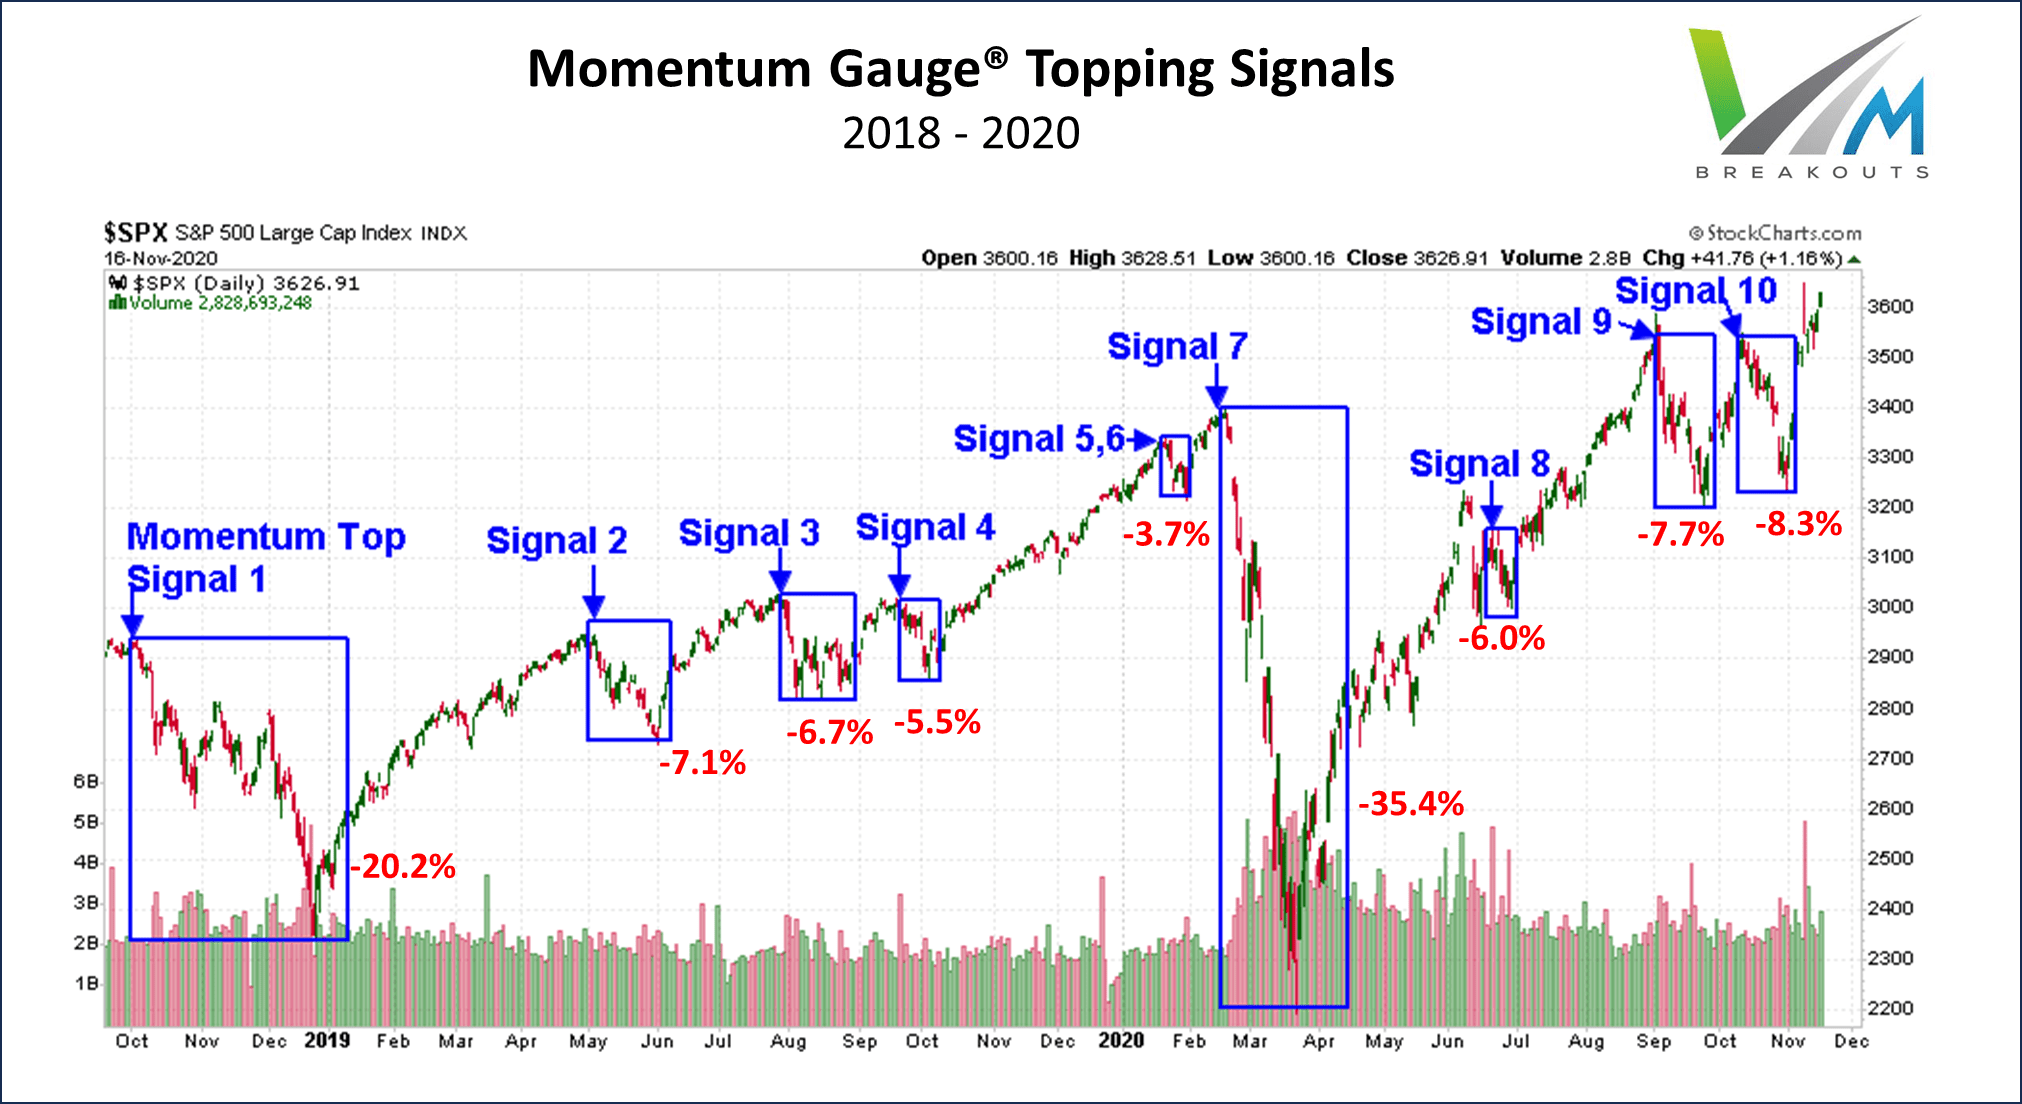
Somewhere over the past decades of trading and researching the markets, I discarded the notion of being a pure buy-and-hold investor. People may do well in buy-and-hold approaches, but they invariably have to ride through some major downturns to arrive with good results in the end. Back in the days when I relied on well-known investment firms for advice, I often received more coaching about my patience than any valuable insight about market behavior. Like many of you, my cynicism and curiosity about the financial markets led me to test, experiment, and run studies across thousands of different trading approaches, algorithms, and models. The long-term development of my momentum gauge algorithms for market and sector trading signals is one of the key reasons I am no longer a “buy/hold and hope for the best” investor.
Here’s a 10-minute view of some key factors to consider for next year. Focus is on leveraging our value portfolio from a wide variety of top-performing models available in our Seeking Alpha Investment Group.
One of the most important factors for market direction is the monetary policy of the Federal Reserve. No forecast of a coming year is complete without consideration of both the fiscal and monetary goals of the key policy drivers. We already know that the Trump administration intends to significantly lower taxes across the board in a loosening of fiscal tax policies. Historically, lower taxes increase the savings rate and are stimulative for markets. We know that major deregulation across U.S. industries has already begun even as tariffs increase to the highest levels in many years.
What is new for 2026 is a heightened emphasis on changing the monetary policies of the Federal Reserve and even replacing Fed Chairman Jerome Powell. The betting markets see a 92% probability that Trump will announce his new Fed chairman before February 1st.
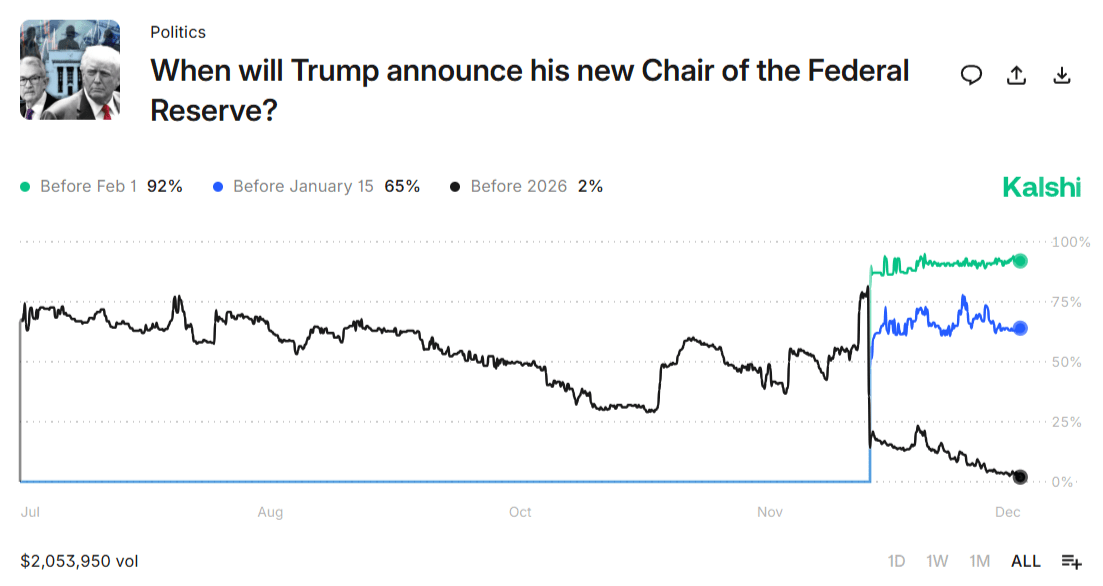
Chairman Powell’s term ends in May, and speculators currently see the most likely replacement is one of two Kevins. Odds place it at 77% that the new Fed Chair will be either Kevin Hassett or Kevin Warsh, with a 92% probability that we will know before February 1st.

Regardless of which Kevin may be appointed Chairman, we know from Trump’s August appointment of Federal Reserve board member Stephen Miran that the new leadership will be enthusiastically for lower rates. Stephen Miran was the only board member voting for the largest -50 bps rate cut in the latest committee decision. Measurements from 1921 show that lower Fed fund rates are extremely bullish for markets, and the DJIA in particular, when there is no impending recession. The most recent GDP numbers of +4.3% in Q3 2025 certainly support a robust current economic condition far from a recession.
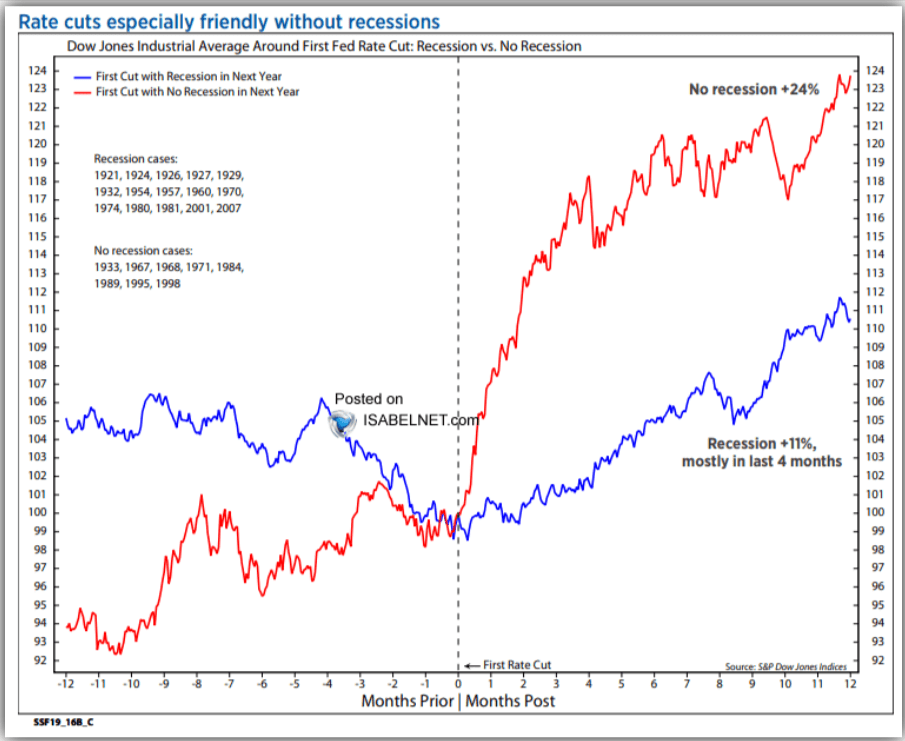
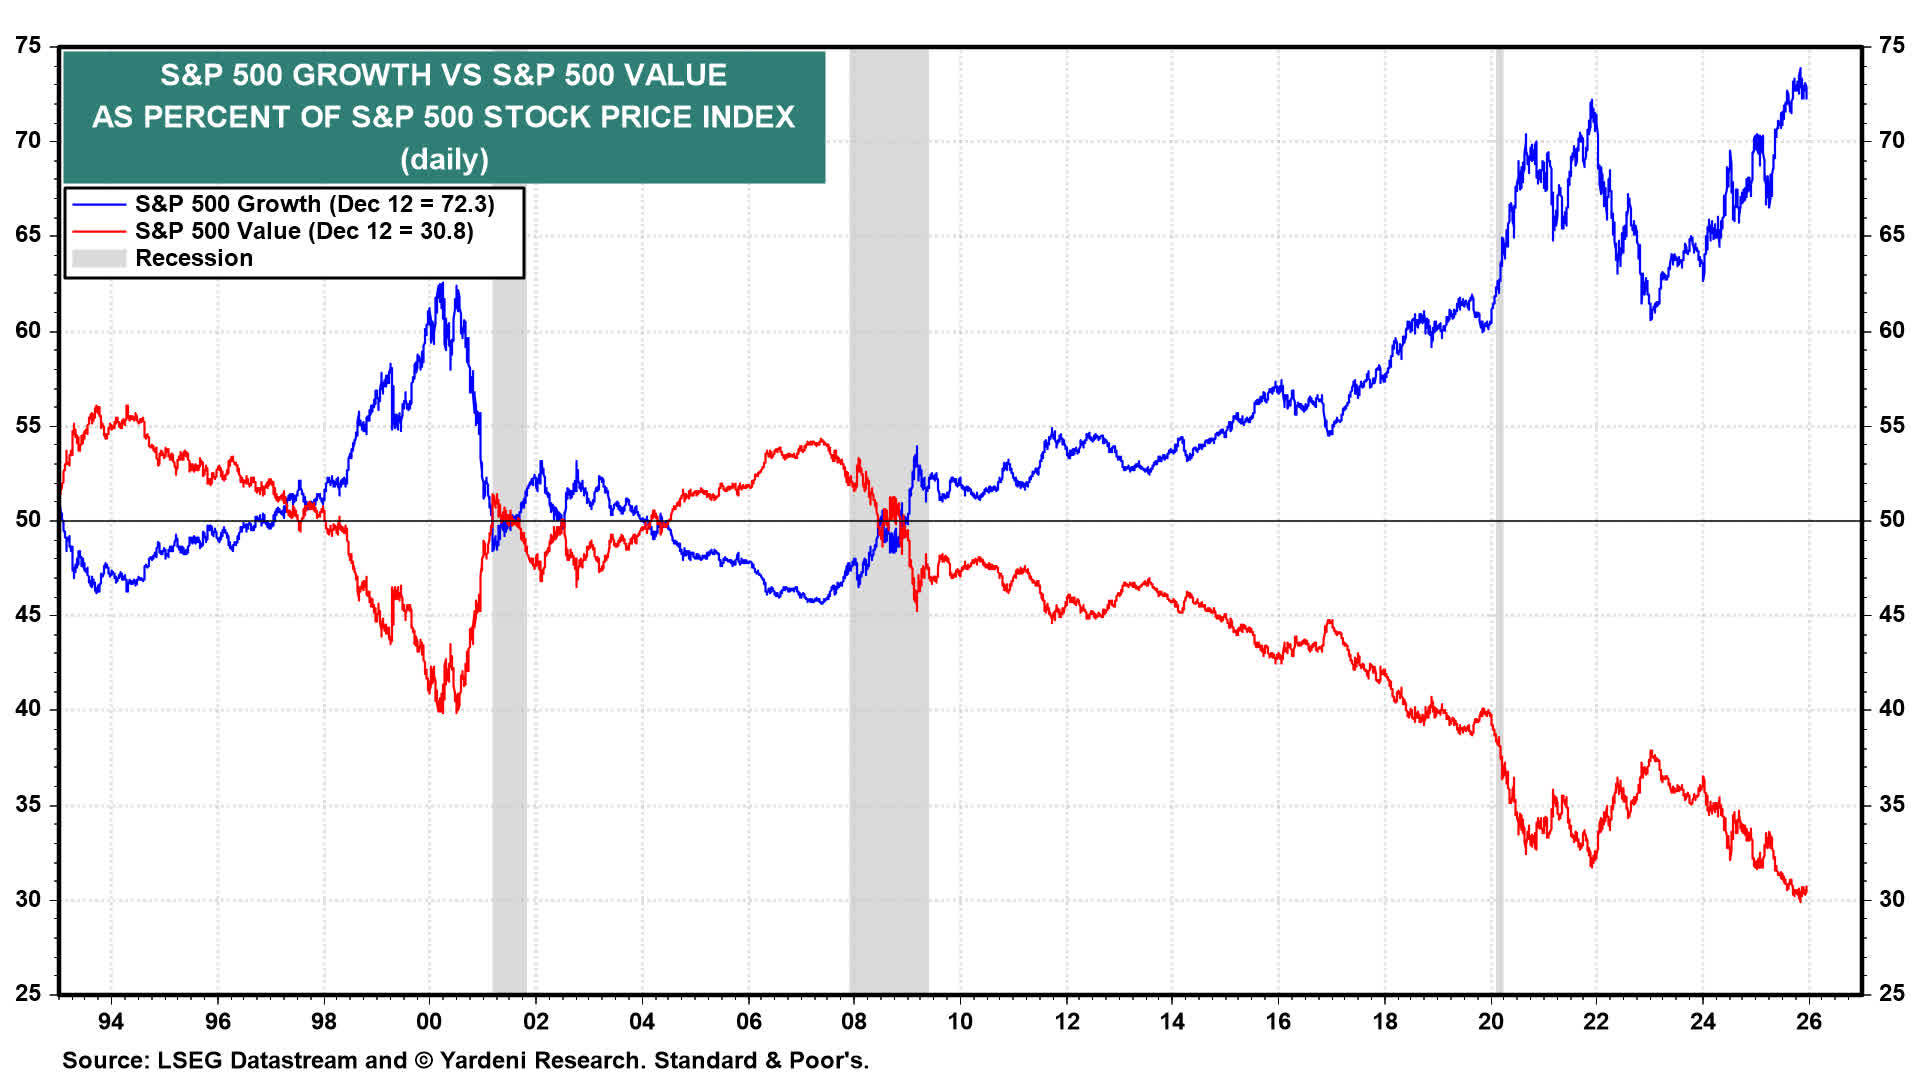
So the Fed fund rate chart above suggests we could experience a very positive DJIA average growth rate for the 12 months from the first rate cut. It may also be that the relatively slow rate of cuts from the highest Fed funds rates in 22 years has not had a meaningful impact yet on the DJIA pattern and a broad market boost beyond the biggest growth stocks.
We can see for the past year that the Dow Industrials lagged all the other major indices during the first few rate cuts of 2025. Growth stocks have done very well in the past year, while value stocks and small caps have lagged the strong growth moves. This suggests that the impact of the rate cut pattern may still be well within the average 12-month growth window, with more gains to come.
The reaction we have seen to the first few cuts of the Fed easing cycle is fully consistent with historical patterns documented from 1974. Growth typically beats value through the first few rate cuts — that we have seen. Small caps typically beat large caps, which we have not yet seen. Bonds lead stocks, which we have definitely not witnessed yet.
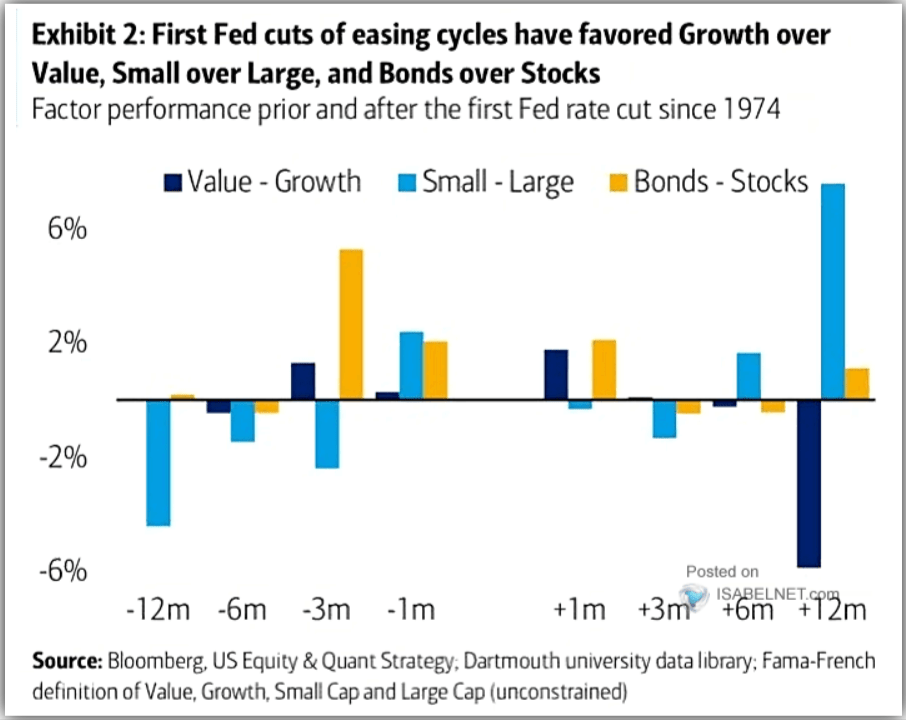
Based on these easing cycles and the current market indices, it seems probable that more value stocks are due for a recovery soon. Certainly more declines in rates may create the expected effects more clearly. I discuss this further in my recent article about market bubbles linked above. Further, the Fed has just shifted from a quantitative tightening program in the fight against inflation to an “unofficial” easing program that started December 1st.
What is the significance of tightening and easing the Fed balance sheet? Since the Global Financial Crisis, we have seen the Fed use quantitative easing to flood the market with liquidity and improve market conditions. The largest and most recent use of quantitative easing was back during the major Covid correction. The S&P 500 lost over -35% from its highs in February, and the Fed stepped in with a major easing program in March of 2020, shown on the chart below.
Fed Balance Sheet vs. S&P 500 during 2020 Covid correction
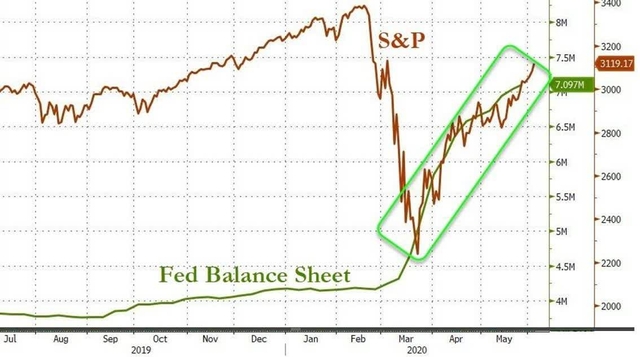
The context of that incredible QE intervention that rescued markets is also shown in 2020 on the Federal Reserve balance sheet chart below. The correlation between market performance and the Fed balance sheet is remarkably strong, but not the only factor of fund flows that benefit equities.
The most important takeaways, without getting into more details about the composition and impact of the Fed’s domestic security holdings, are two-fold:
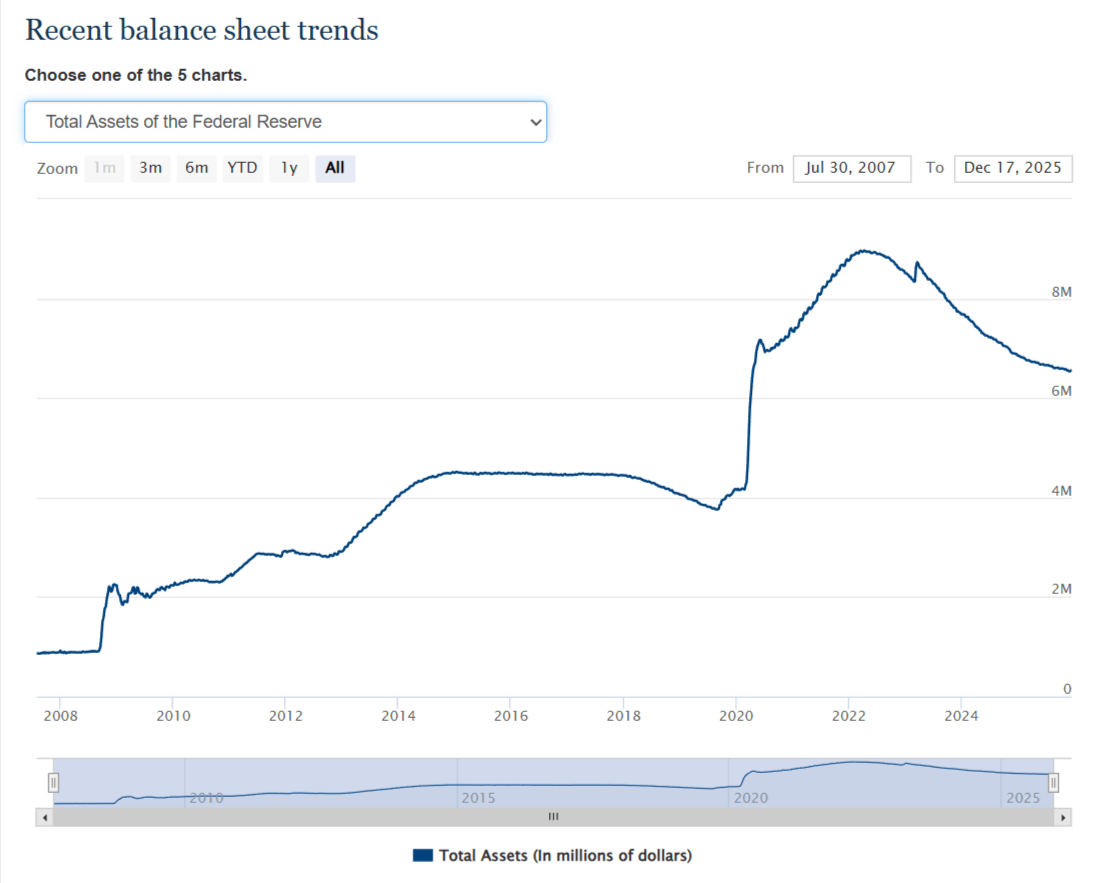
1. A change in the direction of the Fed balance sheet to more easing is more bullish for markets. The recent Fed promises of up to $40 billion per month added to the balance sheet into 2026 have already begun, as the December SOMA reports show. Last week saw an increase in the Fed’s domestic holdings of $20.2 billion and $14.7 billion in the prior week.
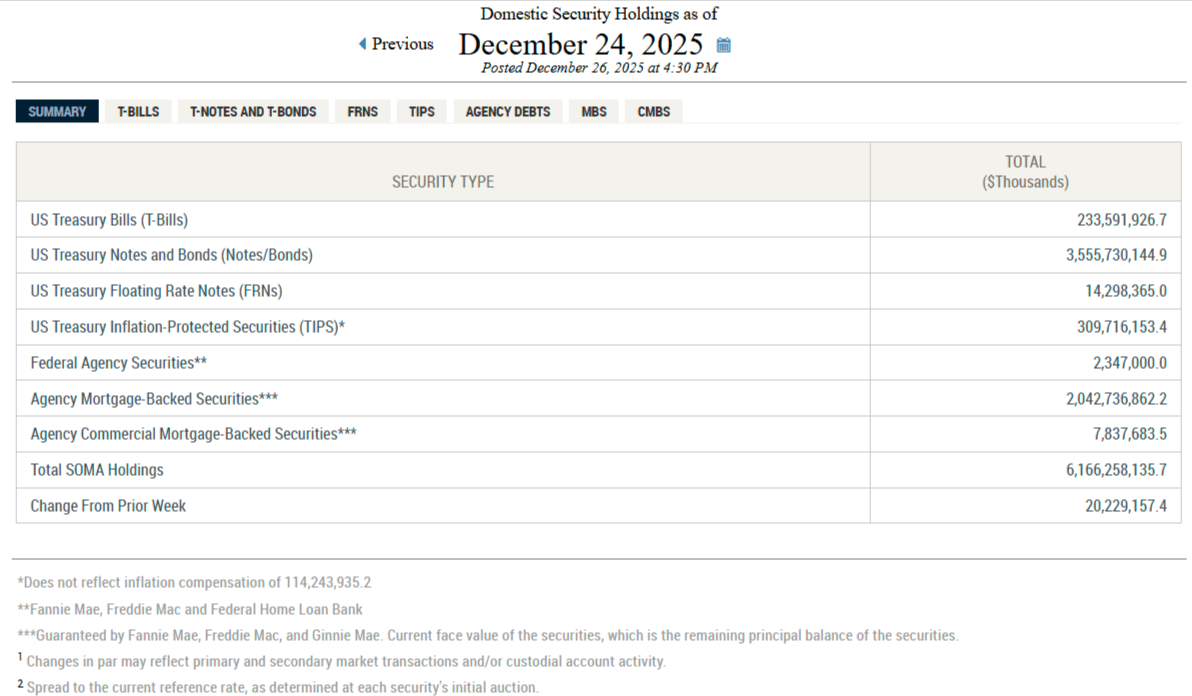
2. The magnitude of the Fed assets on their balance sheet is also of critical importance for overall liquidity. Fed assets peaked at $8.965 trillion in 2022 and have been rolling off steadily to the recent lows of $6.131 trillion this past November, when the tightening ended on December 1st. We can see from the Fed balance sheet chart that these levels rising back up to total SOMA holdings of $6.166 trillion near the end of December are still far above the pre-Covid levels used to stabilize markets through 2018 after the Global Financial Crisis. Many of my prior QE/QT articles suggest that there may be a threshold at which market liquidity gets low enough to shock markets like we saw in 2018.
Both the 2018 QT shock and the 2020 Covid correction were significant negative signals on the Momentum Gauges. I believe that as long as the Fed balance sheet does not dip to 2018 levels, we are less likely to see a severe market liquidity reaction.
So in closing this economic-chartfest section of my article, I am led to believe some notable market shifts are coming that will benefit the broader market and value stocks in particular. These charts illustrate to me the potential for much looser monetary policy, not to mention more fiscal “stimulus” programs and deregulation embedded in the “Big Beautiful Bill” set for action starting in January.


I’ve bought for the Snowball another 1303 shares in NAIT for 3k.
ANNOUNCEMENT OF QUARTERLY INTERIM DIVIDEND
3 November 2025
The Board of BlackRock American Income Trust plc is pleased to announce the fourth quarterly interim dividend in respect of the financial year ended 31 October 2025 of 3.44 pence per ordinary share. The dividend is payable on 12 December 2025 to holders of ordinary shares on the register at the close of business on 14 November 2025 (ex-dividend date is 13 November 2025). The quarterly dividend has been calculated based on 1.5% of the Company’s NAV at close of business on 31 October 2025 (being the last business day of the calendar quarter) which was 229.56 pence per ordinary share.

When the next dividends are received there is a further 1k to be invested in FSFL and then all future dividends to be invested in either BRAI or DIG.
That’s the current plan.


Michael Foster, Investment Strategist
Updated: December 29, 2025
Millions of investors are making a critical mistake that could leave their finances vulnerable—and at the worst possible time, too.
That error? Clinging to so-called “rules of thumb” that sound useful, but are so broad as to be almost irrelevant—even dangerous, depending on your personal circumstances.
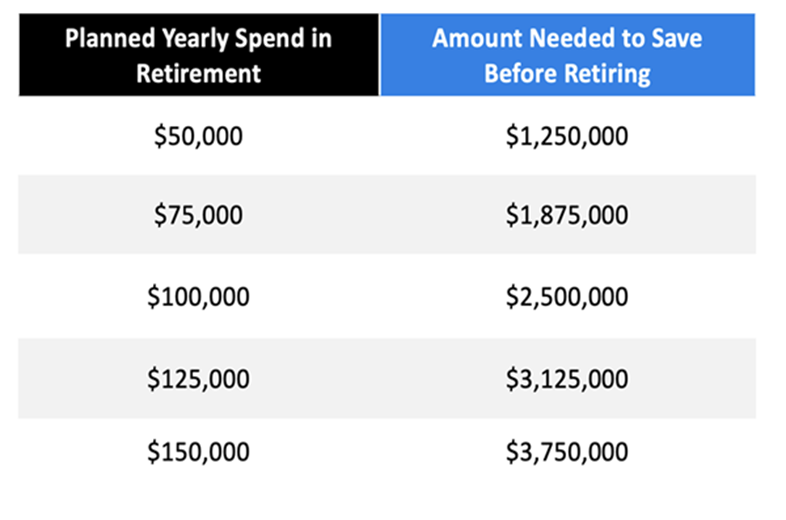
Consider the so-called “rule of 25,” which is as simple as it is deceptive. It simply states that, before we retire, we should have saved up 25 times the yearly amount we plan to spend in retirement.
That’s a lot! The chart below matches up how much a retiree plans to spend (setting aside inflation to make things a bit simpler) to see how much they’d need to save, going by this “rule.”
Now let’s say our hypothetical investor earns $100,000 a year and saves 20% (much more than the average American does) to get to retirement quickly. At that rate, assuming an 8.5% return from stocks (around the market’s historical rate of return), it’s going to take a bit over 29 years to get to retirement.
If you’re young, that might sound like a long time, and if you’re older, you might think you don’t have enough time to get there. In both cases, though, this anxiety is built on a false premise, because the “rule of 25” has been debunked by none other than its original author.
William Bengen invented the related “4% safe-withdrawal rate” based on historical research in 1994. What it basically means is that you need to have 25-times your retirement spending saved up for retirement. If you have less, you face the risk of running out of money when you’re very old, exactly the worst time to be broke.
However, Bengen updated his rule to 4.7% in 2022, based on updated data. So problem solved, right? Nope.
I mean, I guess that’s a little reassuring, as we’re now looking at something more like the “21.27-times rule.” Not a nice whole round number, to be sure, but at least it’s more grounded in actual data. But be that as it may, there are still a lot of assumptions in Bengen’s model.
There is, however, a much better alternative.
CEFs: The Key to a Faster Retirement
There are many closed-end funds (CEFs) designed to translate the long-term roughly 8.5% annualized historical returns of the stock market into a regular income stream that retirees can use to replace a salary.
For one example, let’s take the Liberty All-Star Equity Fund (USA), a broad-based equity CEF holding stocks like Microsoft (MSFT), Visa (V), Amazon.com (AMZN), Wells Fargo & Co. (WFC), Broadcom (AVGO) and other stalwarts of the US economy. As I write this, USA “translates” its profits from these stocks into a 10.6% current yield.
On that basis alone, we could say that an investor needs just $943,397 saved, which would take about 17 and a half years to get for someone making $100,000 and saving 20%, compared to the previously mentioned 29 for the so-called “rule of 25.”
Now I know that there are naysayers out there who attack CEFs, saying that these high payouts aren’t sustainable. And yes, USA’s dividend does float some, tied as it is to the fund’s underlying net asset value, or NAV. So let’s look at the history.
USA has been around for 39 years, and has paid about 82.4 cents per share per year on average in payouts in that time. That’s about 11.6% of the $7.13 at which its shares traded back in 1987, while the fund’s lower market price (since it gives out all of its profits as dividends) meant investors could get in or out of USA whenever they wanted.
USA’s Price Chart Looks Worrying …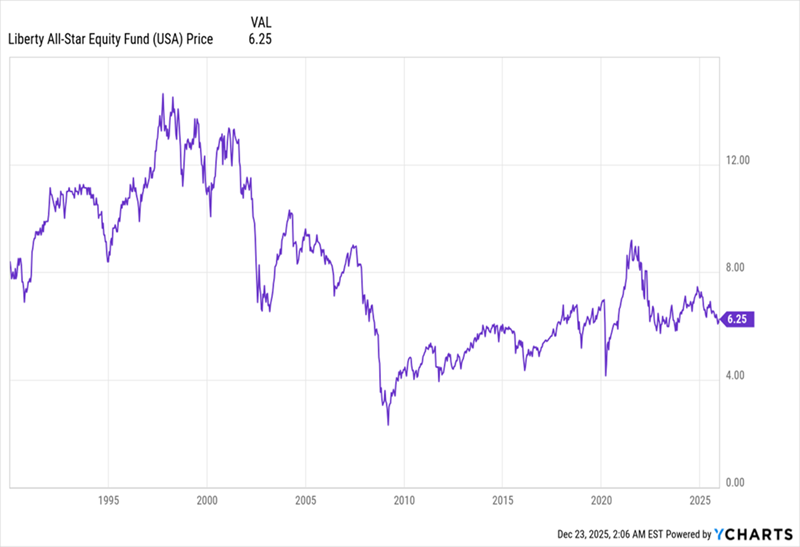
Now that lower market price may look like a concern. But USA gave retirees enough passive income to maintain their financial freedom throughout the end of the Cold War, the dot-com bubble, the housing bubble and Great Recession, and of course the slow recovery of the 2010s and the pandemic and its aftermath.
And here’s the real takeaway: This chart shows us what would’ve happened if an investor had reinvested their dividends back into USA.
… Until You Add the Dividends Back In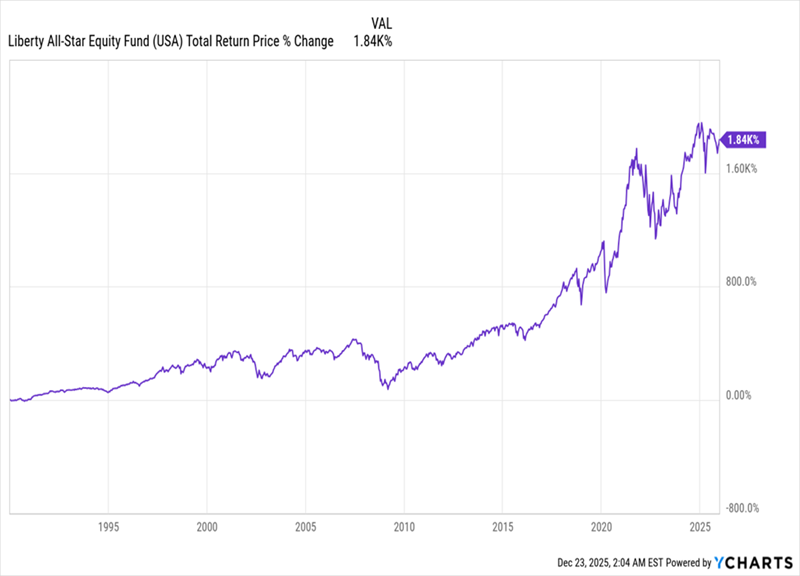
That’s a staggering 1,840% profit over several decades, thanks to this fund’s ability to “translate” profits into dividends that investors can either put back into the fund or use to pay the bills. USA, and funds like it, give us that choice.
Investors were in risk-management mode during 2025, with passive trackers and money market funds among the most popular with investors through the year
By Dan McEvoy

Deciding which funds to invest in for 2026? Data from AJ Bell reveals that passive funds have been all the rage with investors on its DIY investment platform during 2025.
The list of the most popular funds of 2025 reflects a preference on the part of DIY investors for passive exposure to global markets as well as defensive assets like gold, though US stocks are still in vogue, with two of the top ten funds tracking the flagship S&P 500 index.
In the everlasting debate over passive vs active investing, DIY investors are showing a clear preference for passive funds.
Seven of the ten most popular funds of 2025 were classified as passive.
| HSBC FTSE All World Index |
| Fidelity Index World |
| iShares Physical Gold ETF |
| L&G Global Technology Index Trust |
| Vanguard S&P 500 ETF |
| Vanguard LifeStrategy 80% Equity |
| Vanguard LifeStrategy 100% Equity |
| Vanguard FTSE Global All Cap Index |
| SSGA SPDR S&P 500 ETF |
| JPMorgan Global Growth & Income |
Based on £ net flows on AJ Bell’s DIY investor platform from 1 January 2025 to 2 December 2025.
“Tracker funds and ETFs (exchange-traded funds) dominated the list of most popular funds as investors sought convenience and lower costs,” said Dan Coatsworth, head of markets at AJ Bell. “Rather than pay more for active management in the hope of outperformance, they’ve gone for the cheaper option to simply track the market.”
Of the three active funds that made the top ten, two (Vanguard LifeStrategy 80% Equity and 100% Equity funds) have passive investments under the hood.
“They are only considered active funds because Vanguard is making active decisions about asset allocation, but it uses passive funds to get market exposure,” explained Coatsworth.
The only truly actively-managed strategy to make the top ten list was an investment trust, JPMorgan Global Growth & Income (LON:JGGI).
During 2025, DIY investors mainly used passive funds to gain exposure to global stock market indices (including US and UK stocks), gold and technology.
| HSBC FTSE All World Index |
| Fidelity Index World |
| iShares Physical Gold ETF |
| L&G Global Technology Index Trust |
| Vanguard S&P 500 ETF |
| Vanguard FTSE Global All Cap Index |
| SSGA SPDR S&P 500 ETF |
| Vanguard FTSE All World |
| Vanguard FTSE 100 |
| UBS S&P 500 |
Based on £ net flows on AJ Bell’s DIY investor platform from 1 January 2025 to 2 December 2025.
“Tracking a global equities benchmark is a simple and low-cost way to invest. It’s like buying an assorted box of biscuits,” said Coatsworth. “Rather than spending ages in the supermarket choosing which brand or product type to buy, you just put the collection in your basket and get a multitude of different tastes and flavours.”
Investors’ choice of active funds, meanwhile, reflected demand for Vanguard’s LifeStrategy funds (which offer investors different weightings between equities and bonds, and as such convenient risk management for different stages of life).
| Vanguard LifeStrategy 80% Equity |
| Vanguard LifeStrategy 100% Equity |
| Vanguard LifeStrategy 60% Equity |
| Royal London Short Term Money Market |
| Artemis Global Income |
| Blue Whale Growth |
| Polar Capital Global Technology |
| Fundsmith Equity |
| Rathbone Global Opportunities |
| Fidelity Global Technology |
Based on £ net flows on AJ Bell’s DIY investor platform from 1 January 2025 to 2 December 2025.
Royal London Short Term Money Market Fund, which like all money market funds offers cash-like risk and returns, came in above all funds outside the Vanguard LifeStrategy range – further underscoring the notion that investors have adopted a cautious, risk-averse approach this year.
According to AJ Bell’s data JPMorgan Global Growth & Income was the most popular investment trust of 2025 – and the only truly active strategy to make the top 10 funds across all categories – despite having underperformed the wider market this year, returning 2.6% compared to MSCI All Countries World index in pound terms.
Coatsworth highlighted that the trust has traded at a discount to its net asset value since the summer, having previously been at a premium.
“It adopted a more cautious tone earlier this year, which might have surprised some investors who thought the investment trust was a permabull,” he said.
| JPMorgan Global Growth & Income |
| City of London Investment Trust |
| Scottish Mortgage |
| F&C Investment Trust |
| Greencoat UK Wind |
| TwentyFour Select Monthly Income |
| Alliance Witan |
| Law Debenture |
| Henderson Far East Income |
| BlackRock World Mining Trust |
Based on £ net flows on AJ Bell’s DIY investor platform from 1 January 2025 to 2 December 2025.
Investors started the year with worries about Trump tariffs and taxes but where will markets go in 2026?
By Marc Shoffman

(Image credit: Getty Images/Oscar Wong)Share
It has been a good year to be an investor, with stock markets hitting record highs.
Technology stocks, which have been some of the top picks for DIY investors, continued to drive the US markets, while even the more traditional companies in the FTSE 100 helped the British blue chip index soar.
The FTSE 100 was one of the best performers in 2025, passing the 9,000 mark for the first time.
In fact, research from Fidelity International shows all the major regions delivered double digit gains in 2025 – the first time this has happened since 2019.
Latest Videos From MoneyWeek
That is despite concerns about Trump tariffs, geopolitical tensions, high inflation, tax changes and interest rate cuts that have dominated investor decisions for much of this year.
So, 2026 has a lot to live up to, especially with the Bank of England and the Fed now expected to be in an interest rate cutting cycle, while concerns are emerging about an AI bubble that could hit the US and global markets.
Here is what investing experts are looking out for in 2026.
The continued rise of artificial intelligence (AI) and technology stocks, particularly the Magnificent 7 such as Nvidia, may have dominated stock market performance for much of 2025 but attention is shifting from a boom to a bubble in the AI sector.
Lindsay James, investment strategist at Quilter, said: “Despite continued strong earnings growth expected from AI in 2026, concerns are growing that not only are some of these companies priced for perfection but also that they are becoming more capital-intensive businesses, with only the most optimistic of forecasts justifying the scale of the capex spend.”
James said attention is now turning from the AI builders and hyperscalers to the ‘downstream’ adopters such as financial services companies, healthcare providers and companies that can actually put the technology to good use.
Jason Hollands, managing director of Bestinvest, added that while the debate over whether we are in an AI bubble and when it might burst is also going to rumble on, bubbles can balloon for quite some time.
He said: “The dotcom bubble lasted five years before bursting. AI excitement began three years ago with the launch of ChatGPT, so the real question is whether we are still in the foothills, midway up the mountain or near the peak.”
Political uncertainty in the US and UK could weigh on economic growth and stock market prospects.
US president Donald Trump is likely to continue to exert his influence over the world, which could have an impact on tariffs and geopolitical tensions including the Russia and Ukraine conflict as well as in the Middle East.
The US mid-term elections in November 2026 could also have political and economic ramifications.
Hollands said: “The Republican party is at serious risk of losing its narrow majority in the House of Representatives. President Trump will therefore have a fight on his hands to avoid being reduced to a lame duck President on domestic policy. We can expect a renewed focus on the economy and cost of living issues.”
He highlights that the tax cuts in the One Beautiful Bill Act will start kicking in next year and in May Jerome Powell’s tenure as chair of the Fed ends, a point at which President Trump may look to appoint a ‘dovish’ replacement.
Another possibility is that the Supreme Court will rule that tariffs levied under the auspices of the International Emergency Economic Powers Act were not legal, which could result in compensation to businesses that are suing the US government. Such a move would have a stimulus effect, Hollands said.
He added: “The read across for markets could be the US economy running hotter, continued softness in the Dollar and it remains hard to see the case for owning longer dated US bonds,”
In the UK, both Labour and the Conservatives are braced for steep losses in the May council and devolved assemblies’ elections.
Hollands said: “It is not without possibility we could see changes in the inhabitants of both No. 10 and 11 Downing Street, with Keir Starmer and Rachel Reeves hanging on by a thread. That might see a further leftward shift – so yet more tax rises could be coming down the line.”
Chancellor Rachel Reeves may be hoping to encourage more investment in UK stocks but analysts are backing more global strategies, particularly amid concerns about US valuations.
James said: “Europe is leading the pack with expectations for 14% earnings growth in the next 12 months, as spending on infrastructure and defence moves from the policy level to order books.
“Japan is also looking more promising with a decade of corporate governance reforms now paying off. Companies continuing to focus on capital efficiency, improving dividends and buybacks, whilst the end of the deflationary era is leading to healthy wage growth, higher consumption and monetary normalisation, making life easier for financial companies in particular.”
After a long period in the doldrums, emerging markets could rise again in 2026.
Salaman Ahmed, global head of macro and strategic asset allocation at Fidelity International, said: “Any depreciation of the dollar should be a boon to emerging markets. Emerging markets assets are one of our central convictions for 2026.
“Equities in places like South Korea and South Africa are re-rating higher, with improving fundamentals and attractive valuations relative to the rest of the world. China looks compelling for 2026 too with its ongoing policy support creating specific opportunities – see our Asia outlook for more on this.
“Likewise, emerging markets local currency debt, particularly in Latin America, offers attractive real yields and steep curves.
Tom Wilson, head of emerging market equities, Schroders, added “Emerging market equities have performed strongly in 2025, outperforming global equities.
“We are inclined to anticipate US dollar depreciation on a structural basis would provide a tailwind to emerging markets relative equity performance as it eases financial conditions and has a positive translation effect, benefitting dollar-nominal growth and earnings. This may combine with attractive relative valuations, and a potential stabilisation or improvement in relative return on equity.”
Gold hit record highs this year, peaking at $4,361 in October. The question is whether it can continue its gains amid interest rate cuts and hit the $5,000 mark in 2026.
Hollands said: “With worries about the US debt burden, dollar weakness and emerging market central banks diversifying their exposure beyond US treasuries, I believe gold can continue to play a useful role in portfolio diversification next year and beyond.”
Bonds have enjoyed a resurgence in recent years amid a flight to safety by investors and high interest rates.
Government bonds, gilts, have also been boosted in recent months due to concerns about tax and high inflation.
But overall performance has been poor this year and interest rate cuts along with slowing inflation could reduce the attractiveness of new debt.
Hollands added: “Concerns about government debt burdens continue, and this will impact the wider fixed income universe. Sticky inflation, still well above central bank targets, creates some uncertainty as to how much further rates will be cut.
“It therefore makes sense to focus on shorter-duration bonds within any fixed income component of a portfolio, as well as considering alternative ways to diversify a portfolio beyond equities such as absolute return funds

© 2026 Passive Income Live
Theme by Anders Noren — Up ↑