Is the FTSE 100 gearing up for its latest Santa Rally?
Wednesday, December 3, 2025
Russ Mould
Investment Director
Since its launch in 1984, the FTSE 100 index has gained 2.1% on average in December, whereas April and July are the only other months to offer an average advance of 1% or more.
If you want to know why markets talk about the Santa Rally, that is why – because the numbers back it up. Quite why the Santa Rally should occur is less clear.
Investors used to talk about ‘the January effect,’ as money managers put clients’ money to work and into the market in the new year, but since 2000 the FTSE 100 has only advanced 10 times in 25 attempts in January and has chalked up 15 losses, so that may be the end of that.
It is possible that the Santa Rally has developed because investors have looked to anticipate the January effect, and price it in or discount it. But for all its apparent reliability – the FTSE index has fallen just nine times in December since 1984 and only six times since 2000 – the Santa Rally is not certain to offer anything more than festive cheer because it does not seem to be a particularly reliable indicator for the following year.
The FTSE 100 has served up 11 annual losses since 1984 and 10 of those came after a gain in the December of the previous year – the only exception was 2015, whose 4.9% annual decline came after a 2.3% slide in December 2014.
If anything, some of the best Decembers have led to the most treacherous subsequent years. A buoyant festive season in 1993 was followed by 1994’s Fed rate rise shock, 1989’s knees-up let investors stumble into a recession and a bear market, while 1999’s party led to the hangover that came with the collapse of the technology bubble in 2000.
If nothing else, that may back up Warren Buffett’s old aphorism that: ‘The less prudence with which others conduct their affairs, the greater the prudence with which we should conduct our own affairs.’
By contrast, some grim Christmases – 1985, 1990, 1994, 2002 and 2018 – have been followed by cheerful years.
Without wishing to tempt fate, 2024’s dismal December does not seem to have held back 2025 in any way. The FTSE 100 fell by 1.4% in December last year, but the index is up by 18.9% as of the end of November and on course for its seventh-best capital return in its 42-year existence.
In this respect, a joyless festive season for the stock market does not necessarily mean investors will be left with just a lump of coal in the following calendar year.
It depends on whom you ask, of course. But those looking for market-beating returns, along with superior income over time, will want to own investments that combine:
Yield
Growth
Value
Safety
Not everything needs to be perfect, but if an investment enjoys a good mixture of these characteristics, it is likely to be a big winner in the long run. Naturally, it is very rare to find such opportunities because if an investment is really that great (without major caveats), it will likely trade at a high valuation and low dividend yield.
Why Become a High Yield Investor?
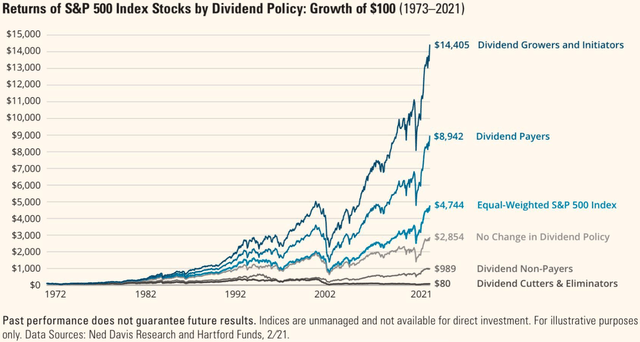
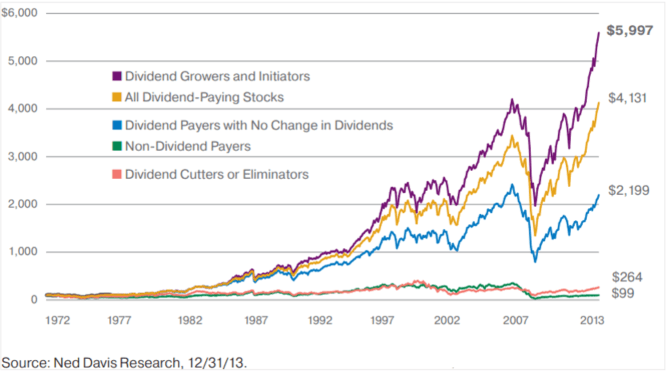
Dividend stocks have historically outperformed non-dividend-paying stocks. Taking this a step further, dividend-growing stocks have also outperformed other dividend stocks.
We believe that earning a steadily growing ~6% yield not only leads to higher returns but also helps you remain patient and disciplined during times of volatility.
However, investors still need to be mindful of risks and balance them against growth expectations. Many high yield investors make the mistake of chasing the highest yield, sacrificing safety and future growth. From our experience, this is almost always a mistake. It is far better to earn a safe and growing 6% yield than a risky and flat 9% yield. In fact, high yields are often the market’s way of signaling that a dividend is at high risk of being reduced or eliminated.
At High Yield Investor, we focus on finding the right balance between safety, growth, yield, and value. Achieving this balance can materially improve your investment results.
Sure, you could invest in a dividend-oriented ETF and be done with it, but you might leave a lot of money on the table. As we explain in our Introductory Course to high yield investing, such ETFs have several flaws. They are heavily exposed to companies paying unsustainable dividends. They also invest in many poorly managed companies with conflicting interests and blindly allocate to challenged sectors like malls, airlines, and movie theaters.
In short, dividend ETFs rely on passive indexing, which is inherently a backward-looking approach to investing. It’s a strategy that focuses on the rear view mirror rather than the road ahead.
Sorry boys and girls, navel gazing not naval gazing.
For any new readers, where have you been ?
The target for 2026 is income of 10k, to be re-invested to earn more dividends to be re-invested to earn more dividends. On all current information it’s likely the target will be exceeded but the target remains 10k.
The first full year of dividends for the Snowball were earned in 2023, so the Snowball could be 3 years ahead of the plan.
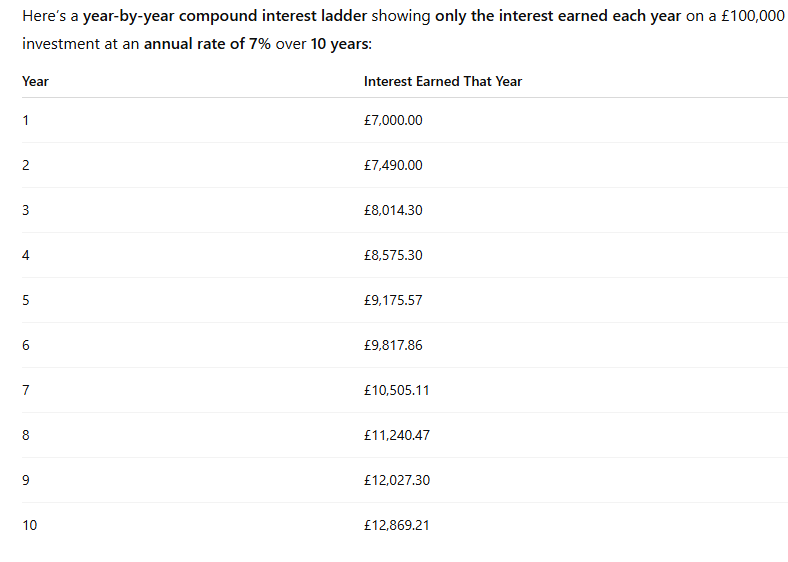
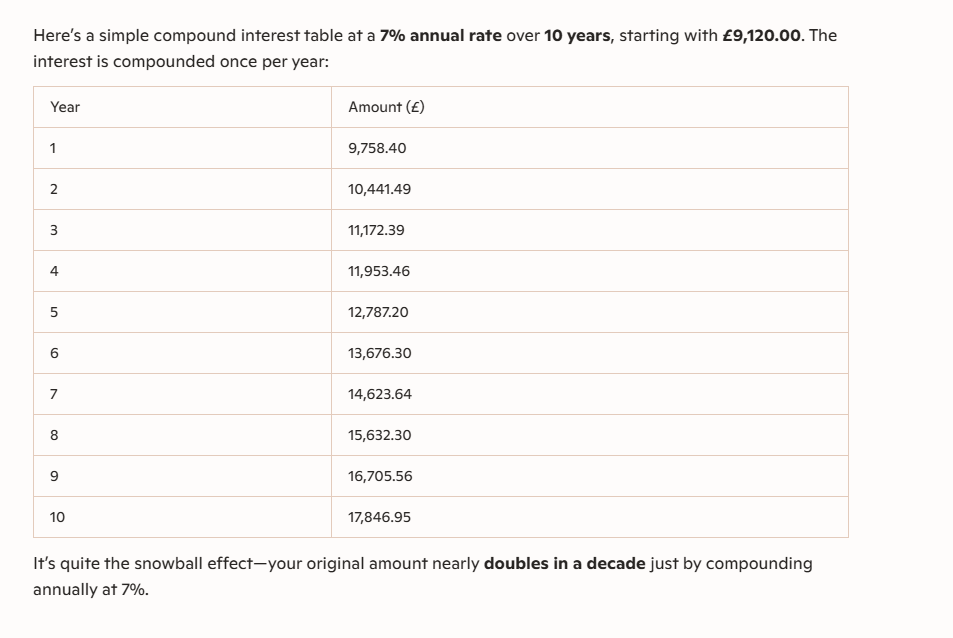
The exciting part is if the Snowball earns £10,441.49, then it would be less than 8 years** where the income could be £17,844.00, which is nearly 18% a year, which you could use to pay your bills or continue to re-invest.
Unpicking the curveball that’s rocked trusts with 10%-plus yields
Proposals to change the inflation indexation of legacy subsidies have triggered share price falls across renewable energy trusts. Jennifer Hill examines the potential impact and the outlook.
4th December 2025
by Jennifer Hill from interactive investor
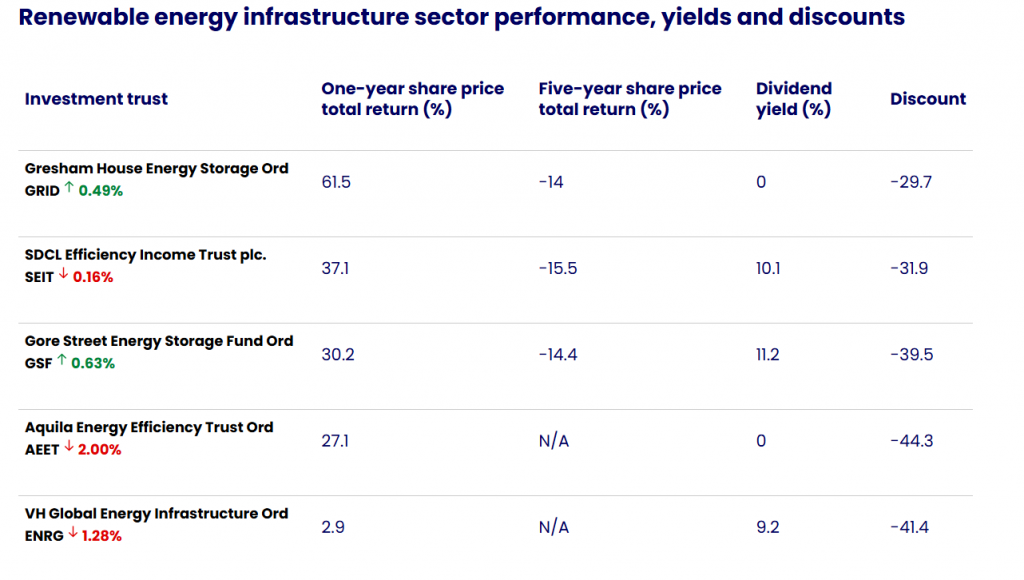
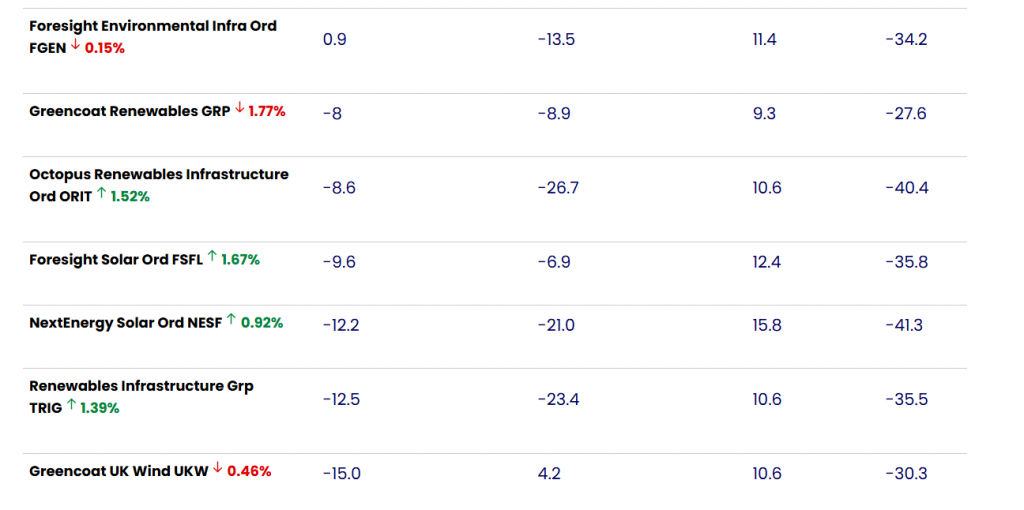
Shares in renewable energy investment trusts have tumbled – widening discounts across a sector that had hoped the worst was behind it – following a government consultation proposing changes to subsidies.
The investment trust industry has sharply criticised proposals to retrospectively switch the inflation indexation of older renewable energy subsidies – the Renewable Obligation Certificate (ROC) and Feed in Tariff (FiT) schemes – branding it a “redistribution by stealth” from UK investors.
The changes would align indexation with Consumer Prices Index (CPI) instead of the Retail Prices Index (RPI), altering the terms of contracts that underpin billions of pounds of investment in wind, solar and other clean energy projects.
Renewable energy investment trusts derive up to half their income from government subsidies, with the rest coming from market power prices. Opponents argue that changing indexation halfway through the 20-25-year support periods would undermine investor confidence in the UK and deliver almost no meaningful benefit to consumers, with an estimated reduction in household energy bills of just a couple of pounds per year.
The Association of Investment Companies (AIC) highlighted that the ROC scheme supports projects generating 30% of the UK’s electricity and has attracted £12 billion of investment into UK renewable energy trusts.
“The impact of this U-turn midway through an agreement would erode investor confidence in the British government as a business partner,” says chief executive Richard Stone.
“These proposals must be withdrawn. They threaten the viability of clean energy projects and the entire UK transition to net zero for a saving of only £3 a year on household bills.”
The long-term consequence, he warns, would be higher costs for consumers as investors lose faith and the cost of capital increases.
“This would be a redistribution by stealth,” says associate Haohua Wu. “These assets are owned in large part by UK pension funds, insurance companies and UK-listed investment companies – in other words, by ordinary savers.”
Gravis argues that the overall cost of legacy subsidy schemes is already declining and will start to fall sharply from 2027 as older projects reach the end of their support periods. In addition, environmental levies make up only a small proportion of energy bills, with recent surges driven mainly by global gas prices.
“If the goal is to ease the pressure on bills, a fairer approach would be to move the cost of legacy renewables support off electricity bills entirely,” adds Wu. “This could perhaps be achieved by funding it through general taxation or a small levy on gas consumption. That would reflect the real cost drivers and avoid penalising UK investors who helped finance the transition to clean energy.”
Another option, she says, would be to lower existing subsidy levels but extend scheme durations, balancing the protection of investor interests with lower bills.
The proposals: switch or freeze
The government consultation sets out two potential approaches: an immediate switch to CPI indexation, implemented ahead of the next annual adjustment scheduled for March 2026, or a freeze in inflation-linked increases until CPI-based inflation catches up with the higher RPI level, which could take until 2035.
James Carthew, head of investment company research at QuotedData, says the discounts on renewable energy trust share prices already more than reflect the worst-case scenario – option two.
“In fact, I wonder whether they now also reflect my feared outcome of this, which is that a future government that is less keen on renewable energy and addressing climate change cites this as a precedent for scrapping subsidies altogether and reneging on CfD arrangements agreed through the various auction rounds,” he says. CfDs, or Contracts for Difference, guarantee a fixed price for renewable electricity, giving investors revenue certainty.
Winterflood Securities says the key to understanding how material the proposed changes could be is to look at how much each trust relies on ROCs and FiT income, the inflation assumptions baked into their valuations – including the expected gap between RPI and CPI – and how long each trust’s remaining subsidy life is.
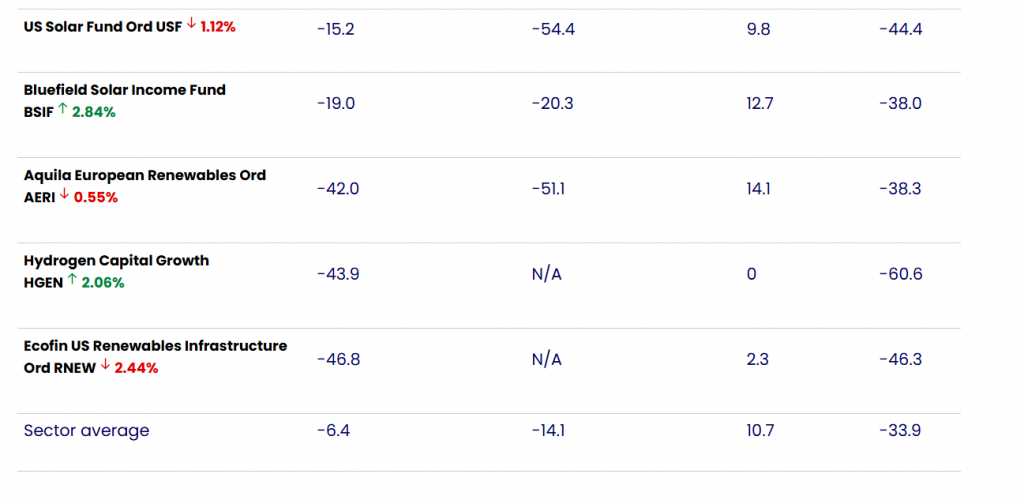
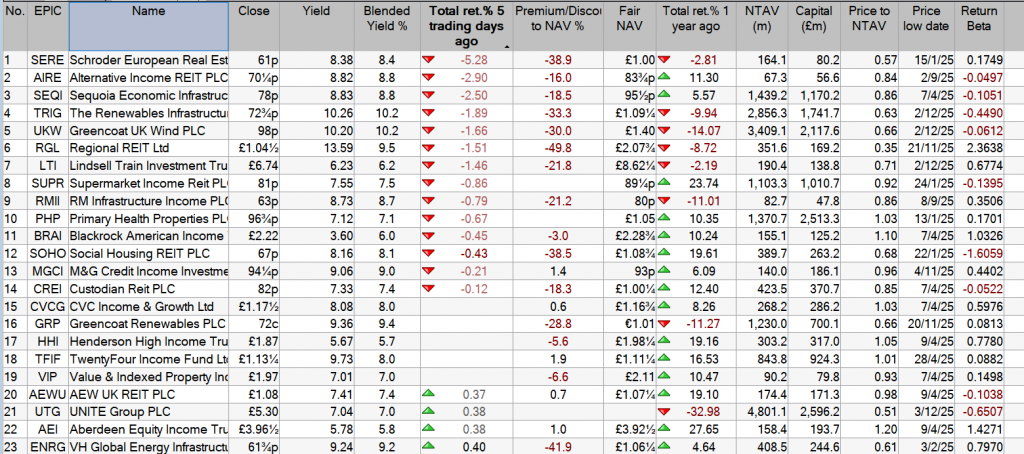
At the other end of the spectrum, Bluefield Solar Income Fund BSIF and Foresight Solar Ord FSFLand NextEnergy Solar Ord NESF derive close to half their revenues from these schemes (48%, 46% and 46%). These solar trusts, however, typically have long remaining subsidy lives – around 26 years for BSIF, 25 for NESF and 21 for FSFL.
Greencoat UK Wind UKWhas a lower proportion of ROC/FiT revenue than the UK solar funds (around 36%), but this is offset by higher inflation assumptions embedded in its models. UKW assumes RPI of 3.5% to 2030 and the largest wedge between RPI and CPI (a 100 basis point differential from 2027-30, compared with TRIG’s 75 basis points from 2027-29).
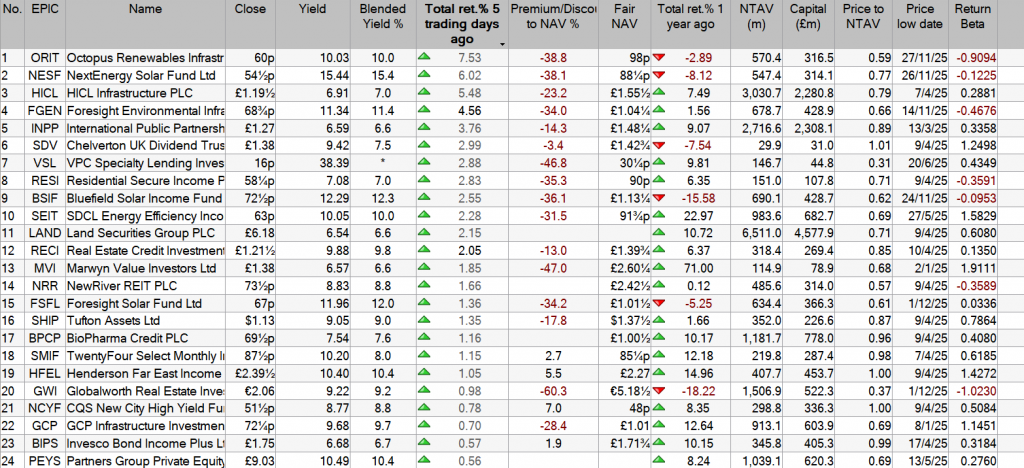
Several trusts have already quantified the potential net asset value (NAV) hit from the two consultation options. TRIG estimates a reduction of 0.5% under option one and 2.2% under option two, ORIT forecasts a 1.1% and 4% impact respectively and BSIF expects 2% and 10%. GCP Infrastructure expects more modest effects, at 0.5% and 1.2% for the two scenarios.
Across the seven trusts reviewed by Winterflood, the average impact of option one is a 1.3% hit to NAV (and a 2.1% implied share price reduction). For option two, the average NAV impact rises to around 6%, with an implied share price hit of 9.3%. BSIF is expected to be the most exposed under option two, with an estimated 10% NAV decline and 16% share price impact, followed by NESF (-9% / -14%), FSFL (-8% / -12%) and UKW (-8% / -11%).
Against this backdrop, dividend cover is an increasingly important differentiator, with FGEN and FSFL having the highest levels at 1.3x.
However, Ashley Thomas, infrastructure and renewables research analyst at Winterflood, says: “Our analysis of share price implied returns flags the UK solar funds as all distributing more than the base portfolio should be able to support, so excluding TRIG and ORIT (where the ROC/FiT indexation impact is very limited), we would view FGEN as having the more secure dividend cover on a post-debt amortisation basis.”
The future: re-pricing the renewables trade
Whether the proposals translate into action remains to be seen, with some analysts assigning a low probability to the most severe outcomes.
“We see the likelihood of drastic changes, particularly retroactive ones, that would cause material losses to investors in UK ROC/FiT subsidised projects as low, given the potential negative consequences this might have for the funding cost of future UK infrastructure projects reliant on public subsidy or funding,” says Peel Hunt analyst Markuz Jaffe, noting that several affected trusts have already begun to recover from the initial share price shock.
William Heathcoat Amory, managing partner at Kepler, adds: “This is not the first time ROCs have been consulted on, and the pullback is pricing in an overly negative scenario for a decision that is far from certain, and still subject to input from key stakeholders.”
Peel Hunt currently has ‘outperform’ ratings on two renewable energy trusts – ORIT and UKW.
ORIT benefits from diversification across European wind and solar markets, reducing dependence on any single regulatory or power price regime. Its newly announced ‘ORIT 2030’ roadmap also provides clearer visibility on medium-term growth priorities.
UKW, by contrast, appeals through its simplicity and cashflow resilience: a single-geography, single-technology wind portfolio supported by robust dividend cover, even under scenarios of materially lower power prices.
“This helps to offset potential concerns around the ongoing consultation, where UKW’s portfolio mix places it as one of the most sensitive, based on the financial impact estimates we’ve seen the peer group report,” says Jaffe.
EQ Investors also sees “the larger and more liquid” UKW as the standout option – but points to value across the sector.
“Across the board, it increasingly seems as though share price falls are reaching a capitulation point,” says Daniel Bland, head of sustainable investment management. “Ultimately, these trusts are to a certain degree interest-rate plays. It’s a matter of time before the value of cash flows versus lower rates (and cost of capital) is recognised.”
Morningstar data sourced by interactive investor via the Association of Investment Companies (AIC) on 3 December 2025. Past performance is not a guide to future performance.
No bull market lasts forever, but investors cannot possibly predict exactly when it will end. Analyst Robert Stephens looks at the current market and a high-quality FTSE 100 stock for long-term investors.
3rd December 2025
Investor concerns about the prospect of a stock market crash have intensified over recent weeks. The volatility index (VIX), which is often referred to as Wall Street’s “fear gauge”, recently spiked to its highest level since the market correction during April.
This evidences investor concerns regarding whether artificial intelligence (AI) can ultimately deliver on its much-hyped potential and if stock market valuations have become excessively high following a period of exceptionally strong growth that has seen the S&P 500 index and the FTSE 100 index make several new record highs.
Investors are also worried about whether a continued uncertain period for the world economy amid above-target inflation, elevated interest rates and ongoing geopolitical risks will negatively affect company earnings, and thereby share price performance, over the short run.
Stock market unpredictability
Of course, it is understandable that investors have such concerns. After all, no bull market has ever lasted in perpetuity, with it having always been replaced by a bear market. The problem facing investors, though, is that it is impossible to predict exactly when a stock market crash will occur. Red flags surrounding market valuations, the economy and geopolitical uncertainty, as well as countless other risks, can be present for many months, or even years, before a bull market ultimately comes to an end.
For example, in the case of the FTSE All-Share index, the average length of a bull market since 1970 is around seven years. This compares with the current bull market’s length of roughly 5.5 years. The previous bull market, which lasted from the depths of the global financial crisis to the beginning of the Covid-19 pandemic, went on for nearly 11 years. This was in spite of many investors predicting its demise well before its end, with rich market valuations and various other red flags being given as reasons for a market crash that took much longer to arrive than anticipated.
As a result, investors who predict there will be an imminent market crash could easily be proved wrong. Indeed, annual inflation across developed economies is widely expected to moderate over the medium term so that it consistently meets central bank targets. This should provide scope for additional monetary policy easing that, alongside recent interest rate cuts, has a positive impact on economic growth and company earnings, thereby helping to justify today’s elevated market valuations.
A buy-and-hold strategy
Rather than trying to forecast when the FTSE 100 index or S&P 500 index will crash, it may be simpler and more logical to instead adopt a buy-and-hold strategy that doesn’t seek to time the stock market. Although such a strategy leaves investors exposed to the stock market’s inherent volatility, which may include periods of severe decline, equity markets have ultimately generated exceptional total returns over the long run.
For example, the FTSE 100 index’s annualised total return since its inception in 1984 is in excess of 8%. When compounded over the long run, this rate of return could have a hugely positive impact on a portfolio’s total valuation.
Investors, of course, can potentially beat the wider stock market’s performance by focusing on high-quality companies that are undervalued. They are likely to include firms that benefit from having a solid balance sheet and a clear competitive advantage, as well as other attributes including strong cash flow and a sound strategy. Over time, they could deliver superior earnings growth, as well as the prospect of an upward rerating, that produces a relatively attractive capital return vis-à-vis the wider stock market.
While the FTSE 100 index’s elevated price level may suggest there is likely to be a dearth of attractively priced, high-quality companies at present, several UK-listed large-cap stocks appear to offer long-term investment appeal. Holding a diverse range of them for the long run, rather than seeking to time what is a highly unpredictable stock market, could prove to be a worthwhile move
Dividends can be more reliable than share prices as they’re driven by the companies performance itself and not by the whim of investors.
As part of a total return / reinvestment strategy, this income could be reinvested into income assets or back into the equity market depending on the relative valuations.
The emotional benefits of dividend re-investment. In fact, with this investment strategy you can actually welcome falling share prices.
These “Ironclad” 9%+ Dividends Get Cheaper With Every Gloomy Headline
Brett Owens, Chief Investment Strategist Updated: December 2, 2025
The spreadsheet jockeys on Wall Street have it all wrong—and their blunder is dragging down the average investor’s returns (and income!).
Their mistake? Looking at “old school” measures, like the recent spate of soft jobs reports, and jumping to the conclusion that the economy is hitting the skids.
Trouble is, this take is totally disconnected from reality, especially when it comes to the nation’s small businesses. Because these mom-and-pop shops are still upbeat—and many of them are looking to grow.
The proof is in the numbers. First up, even though small biz optimism did tail off a bit in October, according to the NFIB Small Business Survey, it’s still above its historical average, where it’s been for the past six months.
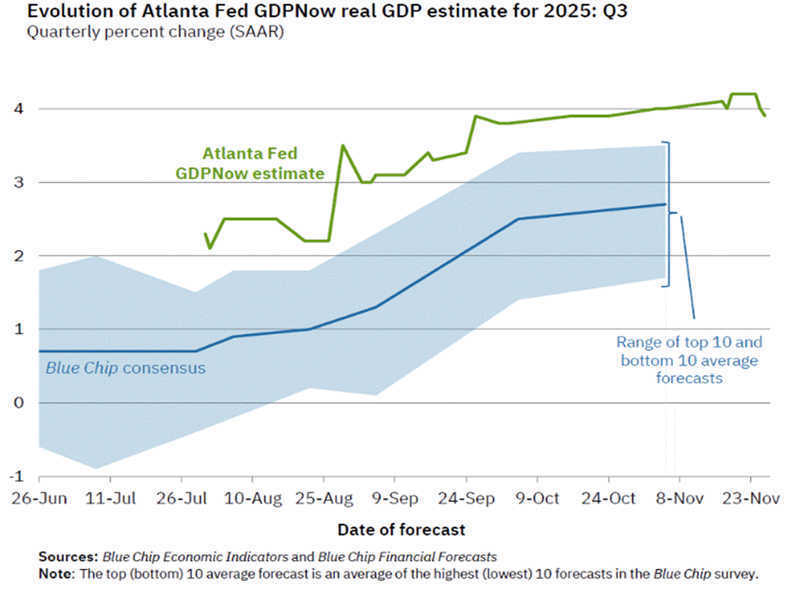
And then there’s the Atlanta Fed’s GDPNow measure, the most up-to-date indicator we have, which shows the overall economy growing 3.9%. Cooking along just fine, in other words.
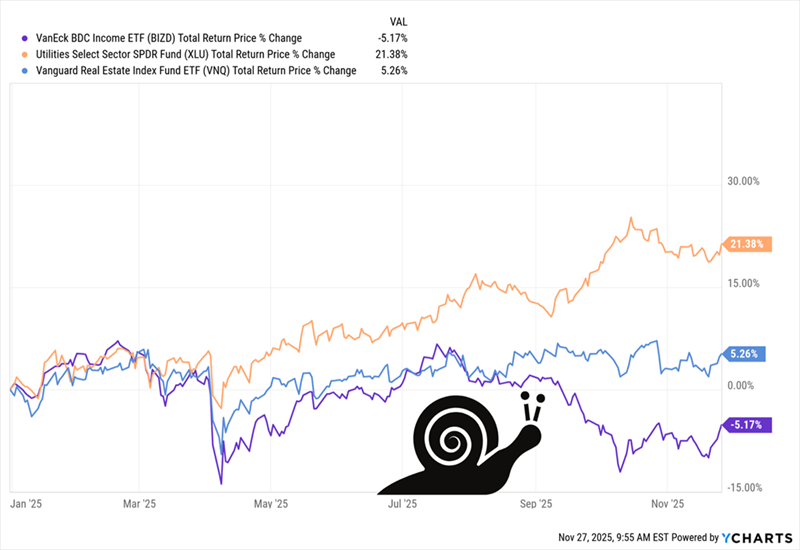
When small biz grows, profits at business development companies (BDCs)—which loan money to these companies—sizzle! That means big divvies for those of us who hold BDCs: The two we’ll delve into below pay a hefty 9.4% and 11.7% (!), respectively.
Luckily for us, Wall Street’s unwarranted gloom is prompting investors to toss BDCs over the side. You can see that in total return of the benchmark VanEck BDC Income ETF (BIZD), which is down this year (see purple line below), as of this writing. That’s despite the fact that other income plays, like real estate investment trusts (REITs), in blue, and utilities, in orange, are up:
REITs and Utilities Surge. BDCs? Not So Much
BDCs are in the cellar precisely because of those sluggish jobs reports. But the truth is, this setup is bullish for small business. Ask any small biz owner about their biggest challenge these days and they’ll likely all tell you the same thing: They can’t find good workers!
Now, thanks to the slower job market, they’re more likely to find the help they need, and at a lower cost, too. Then there’s AI, which small businesses are diving into with abandon: According to a recent study by Reimagine Main Street, more than 50% of these firms are looking at adopting AI—and one in four already have.
Beyond the labor front, there’s reason for hope around another small-biz bugbear: tariffs.
You likely know about the Trump administration’s recent removal of tariffs on around 200 food items. This shows that the administration is sensitive to price pressures. More easing seems likely, especially if inflation remains stuck around current levels.
With all this in mind—small-biz optimism, a still-strong economy, more (and cheaper) labor and a potential easing of supply chain woes—it’s prime time to move into BDCs.
Below are two that should be at the top of your list. The first is a newer player with that monster 11.7% dividend I mentioned a second ago. The other is what I call the “BDC bully”: It pays a gaudy 9.4%, and its sheer size lets it be very picky about who it lends to.
High-Yield BDC #1: A “New Kid” Crashing the BDC Party
The Morgan Stanley Direct Lending Fund (MSDL), payer of that 11.7% divvie, has all the markings of an overlooked bargain: It’s new, at least to investors, as it started trading on the NYSE in January 2024; it’s small, with a $1.5-billion market cap, and it’s cheap (of course!), trading at 84% of book value.
That price-to-book measure only shows the BDC’s share price in relation to its physical assets and its loan book. It doesn’t account for MSDL’s hidden value—of which there is a lot.
Start with management. As the name says, the BDC is backed by Morgan Stanley (MS), more specifically, by MS Capital Partners Adviser, a Morgan subsidiary. That gives MSDL the expertise and resources of the 90-year-old investment bank. That’s an edge few other lenders—especially those as young as MSDL—can match.
Management knows how to control risk, too: In the third quarter, 96.3% of MSDL’s overall loans were “first lien” and 100% of the new loans the firm made in that quarter were of this variety. This means that if bankruptcy hits one of these borrowers, MSDL is first to be repaid.
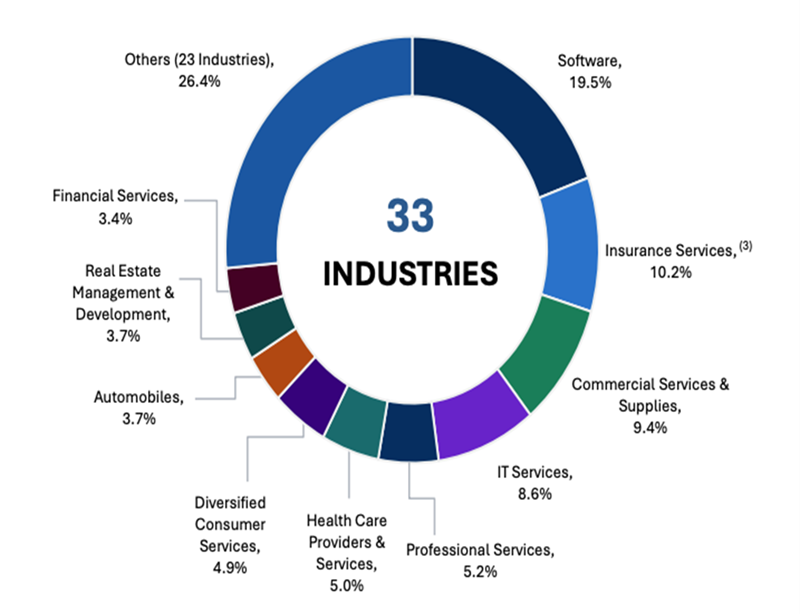
But the team at the top has taken steps to minimize even that outcome, with a portfolio spread across 33 industries in all:
Source: MSDL Q3 earnings presentation
The dividend? It’s paid quarterly and covered by net investment income (NII), with $0.50 in NII over the last quarter matching the $0.50 quarterly payout.
There’s good reason to think that this coverage will improve, starting with the direction of interest rates, which is always key to BDC profits.
Here too, there’s a disconnect” for us to profit from. When the Fed cuts its policy rate, BDC loan income typically falls, especially on floating-rate loans, an MSDL specialty (99.6% of its portfolio).
As I write this, futures traders see an 85% chance of a December Fed rate cut, and rates are likely to move lower after May, when Jerome Powell’s term expires (and he’s replaced by someone—potentially Kevin Hassett, director of the national economic council—likely to back the administration’s call for lower rates).
This seems like bad news for BDCs, but we need to remember that lower rates drive up loan demand, especially when businesses plan to grow (see small-biz optimism above). This, in turn, helps offset lower loan income and gives BDCs more floating-rate loans on which to collect a rising income stream when rates inevitably move up again.
MSDL is already seeing this: In the past year, as rates have fallen, it’s grown its loan book from 200 borrowers to 218—a 9% jump. I expect that to continue as small-biz optimism rolls on.
High-Yield BDC #2: The King of BDCs (With a 9.4% Yield)
Next up is Ares Capital (ARCC), a holding in my Contrarian Income Report service that we love for one main reason: scale.
ARCC is the biggest BDC by far, with $28.7 billion in assets. This brings a steady stream of deal flow, helping management dictate favorable loan terms.
That’s why Ares is our “BDC bully”: Its size helps it be picky and grow quickly. As of September 30, it had 587 borrowers. Plus, the biggest borrower accounted for just 1.9% of ARCC’s assets under management, further lowering its risk.
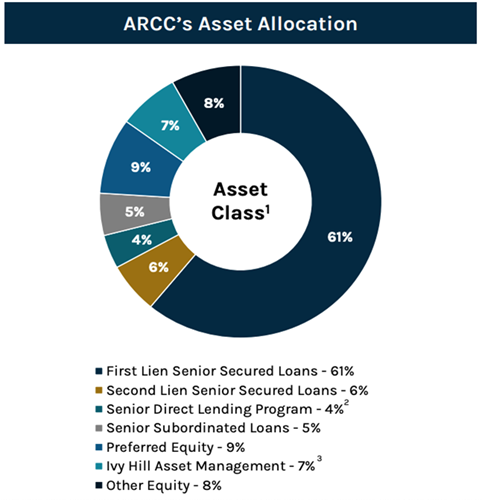
ARCC’s ability to grab the “pick of the litter” among borrowers has also let it build a diverse portfolio, with a lean toward those lower-risk first-lien loans:
Source: ARCC Q3 investor presentation
ARCC continues to aggressively write new loans at attractive yields. Last quarter, the fund generated NII of $0.48 per share. As is the case with MSDL, that covered the BDC’s dividend: a matching $0.48 quarterly in ARCC’s case.
We also have a lot of dividend history to go on here, with ARCC going public more than two decades ago, in 2004. That history is very favorable indeed:
About 71% of ARCC’s portfolio was floating rate at the end of Q3, but management is steering more loans that way, as that total is up from 69% in the second quarter. This is a smart move as future rate cuts spur more small-biz borrowing.
Finally, ARCC trades around book value, which is fair in light of its dominant position and long history. Sure, we’d like to buy “cheap,” but investors rarely knock ARCC below book. So we’ll happily buy here and collect ARCC’s 9.4% payout while we wait for its next run up.
You Saved and Saved—and Think You Still Can’t Retire? You Probably Can.
I urge investors to buy steady high-yielders like MSDL and ARCC for one simple reason: They’re a proven way to grab a strong income stream in retirement.
Stack up a few payers like these in your portfolio, and pretty soon you’re well on your way to a retirement funded by dividends alone—and on far less than you think you need.
The wreaths are up, and the mince pies are in the oven. And in the investment world too we have our own end-of-year traditions. Foremost amongst these is the “Santa rally”, specifically the old lore that the market invariably performs strongly over the festive period. But is it true? And if so, can trust investors benefit from this seasonal cheer?
Like so many aspects of modern Christmas, the theory of the Santa rally has its origins in America. Personally, I would prefer the more British-sounding Father Christmas rally, but I’m probably just being a Scrooge (or Grinch if you’re American). It was coined in 1972 by Yale Hirsch, founder of the annual Stock Trader’s Almanac, and refers specifically to the final five trading days in December and the first two in January. Since 1950, the S&P 500’s average return during this window has been 1.3%, with the index rising on three quarters of occasions – crucially, this positive hit rate is higher than for a randomly chosen seven-day period.
Nowadays, the term “Santa Rally” is used rather more loosely for any period of strong market performance during Advent, and there is plenty of evidence that the whole of December is generally a strong month for equities. And there is equally strong evidence of a Santa rally effect closer to home. December appears to be the best month of the year for UK equities, with the FTSE 100 delivering positive returns in 24 of the 30 years to 2023, versus 23 for the S&P 500 – although it must be noted that both markets fell over the month last year.
So if the Santa rally does seem to exist (just like the big man himself), what could be the cause? There are numerous hypotheses and there is clearly no one specific answer, but some or all of the following might play a part. Firstly, market volumes tend to be thinner at the end of the year, and if traders are feeling positive as the holidays approach, this can have an outsized impact on prices. Fund managers can also be tempted to “window-dress”, tidying up portfolios before year-end statements, which can mean adding to winners and driving prices higher, and closing out short positions.
This tendency to add to those stocks that have had a good run can also be driven by retail investors influenced by “year in review” pieces highlighting particular winners over the preceding months. Amongst professionals, asset allocation and risk committees slow down in December, which can lead to less appetite to sell into a market that is rising.
If the Santa rally effect is real, at least to an extent, how can investors in investment trusts benefit? The most obvious way is by just sitting tight and waiting for the positive year-end effect to be reflected in fund NAVs. Clearly, trusts with gearing should benefit most, as even a small rally of 1 or 2% is amplified. However, what could make trusts particular beneficiaries is what happens to discounts – opening a path to a possible double boost. For example, in 2023 there was some commentary on an “early Santa rally” coinciding with trust discounts narrowing from much wider levels. And if you manage to buy a trust on an unjustified discount at a time when risk appetite is beginning to improve, a positive year-end could see a mean-reversion of that discount come more quickly than would otherwise be expected.
There are plenty of examples of trusts that look oversold to us, perhaps too many for the Santa rally effect to have a meaningful impact on. That doesn’t mean that these bargains aren’t worth picking up now. Logic would suggest that in time, sanity will prevail (or, in a worst-case-scenario, we’ll see more liquidations).
Towards the end of the year, as is now tradition, QuotedData’s analyst team will be selecting its top picks for 2026 and we’ll also be explaining where we went right and wrong in 2025. Please look out for that.
Going back to Santa and his rally, perhaps the best that can be said for trust investors is to see it as a tailwind, not a strategy in itself. Banking on an unpredictable short-term move in markets is certainly no substitute for understanding the assets, governance, management and strategy of a trust. I have also written previously about the importance of “time in the market” over “timing the market” for investors, and that surely applies here. A strategy of buying and holding quality funds over numerous years is undoubtedly a better bet than trying to be too clever by half and taking advantage of short-term seasonal effects. Indeed, just like with the dogs in those old adverts, a good investment trust is for life (or at least the long term), not just for Christmas.
Disclosure – Non-Independent Marketing Communication
This is a non-independent marketing communication commissioned by Octopus Renewables Infrastructure (ORIT). The report has not been prepared in accordance with legal requirements designed to promote the independence of investment research and is not subject to any prohibition on the dealing ahead of the dissemination of investment research.
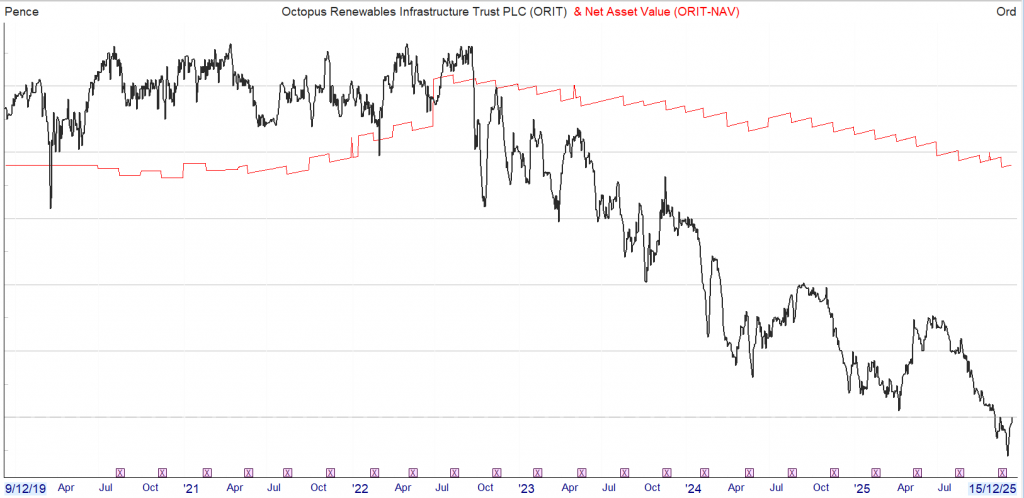
Octopus Renewables Infrastructure’s (ORIT) half year results to 30/06/2025 show a NAV total return of -0.2% (H1 2024: +2.0%). The lower NAV per share, 99.5p (31/12/2024: 102.6p) mainly resulted from lower power price forecasts, higher discount rates and dividend payments, partially offset by macro factors (e.g. higher UK RPI inflation, lower corporation tax in Finland).
ORIT’s dividend yield is c. 9.6% (as at 21/09/2025). In the first half dividends totalling 3.08p were on track to achieve the full year target of 6.17p. The target dividend represents a 2.5% increase on 2024’s 6.02p and, in attaining, would extend ORIT’s record of increasing dividends in line with UK CPI inflation to four years . First half dividend cover was 1.19x operating cashflow.
Revenue of £68.7m and EBITDA of £44.3m were broadly flat year-on-year, although note that in the FY to 31/12/2024 revenues and EBITDA increased by 12% and 16% respectively. 85% of revenues are fixed over the next two years and 47% are linked to inflation for the next ten years.
ORIT generated 654 GWh of clean electricity (H1 2024: 658 GWh). In a year when wind speeds were lower, ORIT’s diversified strategy demonstrated its value, with an offsetting 34% increase in solar output. This output is equivalent to powering an estimated 158k homes with clean energy (H1 2024: 147K).
ORIT was geared 47% LTV at the end of the period (89% as a percentage of NAV), a slight increase from 45% at 31/12/2024. The increase was a result of both slightly lower valuations and the impact of share buybacks, both reducing net assets. The board has restated the target to reduce gearing to 40% or less by the end of the financial year.
A new five-year term loan facility allowed for the repayment of £98.5m of short-term borrowings through the Revolving Credit Facility (“RCF”). The remaining £150m RCF’s term was extended to June 2028. The average cost of debt decreased to 3.6%, from 4.0% as at 31/12/2024. Resulting savings are expected to be c. £850,000 (or 0.15 pence per share).
Under ORIT’s capital allocation policy, a total of £21.6m (to 15/09/2025) of the £30m targeted share buybacks have been executed. The asset disposal process is on track to deliver £80m of sale proceeds by year end. Selective investments continued, with a total of c. £4.3m of follow-on funding for two of ORIT’s developers and a conditional forward purchase agreement for a price of c. €27m to acquire a sixth site at ORIT’s existing Irish solar complex, Ballymacarney, with completion expected in H2 2026.
The portfolio’s weighted average discount rate (WADR) increased to 7.9% (31/12/2024: 7.4%), largely due to market conditions, and informed by observed transactions in renewables assets. The introduction of project level debt for UK assets (which replaced some of the more expensive RCF) also contributed to the increase.
Post period end, ORIT’s board agreed a change in management fees with the manager. Effective 01/11/2025, management fees will be charged on an equal weighting of net assets and average market cap, which at prevailing levels equates to an annualised cost saving of c. £0.7m.
The board separately announced its ‘ORIT 2030’ strategy, which sets out its four priorities for the next five years.
Grow: Invest for NAV growth, deploying capital into higher growth investments, including an increased ~20% target allocation to construction assets, maintaining the current 5% allocation to developers. There will also be a greater focus on asset improvement and disciplined capital recycling.
Scale: Target £1 billion net asset value by 2030, to create a more liquid and investable company. Alongside investment growth, this could include corporate M&A.
Return: Target medium-to-long-term total returns of 9-11% through a combination of capital growth and income, maintaining the progressive dividend policy, while preserving full cover and targeting long-term gearing below 40%. Retain diversification across core technologies and geographies.
Impact: Aim to build approximately 100 MW of new renewable capacity per annum.
As part of the ORIT 2030 strategy, the board is also recommending that the continuation vote moves to a cycle of every three years, from the current five. The change will be put to a vote at the 2026 AGM, with the next continuation vote then held at the 2028 AGM.
Phil Austin, chair, said: “ORIT 2030 marks the next phase in the Company’s development. This clear five-year strategy aims to scale ORIT significantly, drive NAV growth through investment into construction and development assets and – underpinned by resilient cash flows – maintain progressive fully-covered dividends.
“More than 90% of shareholders backed the Company at its continuation vote in June, indicating strong support for ORIT’s future, yet it has also been made clear from our active dialogue with investors that they want the Company to become larger, more investable and to stay true to its purpose. ORIT 2030 addresses this directly with a plan that balances yield, growth and impact, ensuring the Company delivers for shareholders, while supporting the energy transition.
“With disciplined capital management and the expertise of our Investment Manager, we believe we are well placed to execute ORIT 2030 and to pursue our ambition of building a £1 billion renewables vehicle by 2030.”
Kepler View
As we’ll see further below, Octopus Renewables Infrastructure’s (ORIT) current yield spread over UK 10-year gilts is at a lifetime high, making this a good moment for investors to examine its investment proposition more closely. And while the ‘ORIT 2030’ strategy is clearly meant as the centrepiece of the results, with a separate simultaneous announcement, it’s worth reflecting on some key points of the results themselves. The first of these is the practical demonstration of ORIT’s diversification strategy. In the geography that ORIT covers, wind speeds this year are already known to have been lower, so it is no surprise that ORIT has reported lower output from its wind assets. But wind speed tends to have an inverse correlation to solar output and ORIT’s solar output, up 34%, confirms this, offsetting the lower output from wind. This is a good demonstration of why power grids need different sources of energy generation, and why a trust such as ORIT, targeting a progressive dividend, is assisted by diversification. It’s also notable that ORIT’s short-term debt has partly been replaced with a term loan secured against UK assets, reducing the overall interest cost from 4.0% to 3.5%. If the goal to realise £80m of assets by the year end is achieved, then we can expect a further reduction in the remaining £150m of RCF, which would reduce the overall debt cost further. The revised management fee will also be an incremental cost saving.
The two most immediately practical elements to the strategy in the ‘ORIT 2030’ roadmap are the defined target allocation of owning c.20% in construction assets, and the accompanying increase in the trust’s return targets. It’s worth noting that these do not reflect a change to the investment policy itself. ORIT’s manager has a long track record of asset construction dating back to 2011 and has over 150 professionals with experience at all stages of managing renewable energy infrastructure assets, so this change plays to the inherent capabilities of Octopus Energy Generation. Within ORIT the case study that best illustrates this is the 2024 sale of its fully operational Swedish wind assets for c. €74m, having acquired the assets pre-construction in 2020, with a resulting IRR of 11%.
The focus on reducing costs, noted above, will be important in achieving one of the other goals, to maintain the progressive dividend. Clearly, as ORIT slowly increases to ~20% exposure to non-income producing assets in future, this will mean the balance has to work that much harder. The management team notes that dividend cover will be an important consideration in the decision process to recycling assets, which in simple terms means that lower yielding assets are more likely to be sold and proceeds recycled into construction. The company also reiterated its commitment to a progressive dividend, noting that while increases may not always track CPI in future, this has been achieved in practice, despite never being a formal policy. Further, the revised fee structure, partly calculated on market cap, means the manager’s fee is reduced when there is a discount, aligning the manager’s interests more closely with shareholders. One of ORIT’s other ambitions is to act as a consolidator in its peer group and it seems very likely that earnings enhancement will be a key consideration in the pricing of any M&A transactions that result from this ambition.
Coming back to the present, the chart below shows ORIT’s dividend yield as a spread over 10-year gilts. UK government bond yields have not been playing nice with interest rates this year and are approaching 5%, which accounts for a good deal of the recent price weakness for ORIT, its peers and indeed many other rate-sensitive ‘alternatives’. But as the chart below shows, the spread over gilts is close to a lifetime high for ORIT. With a set of proposals that reduces costs, puts more alignment between the manager and shareholders in terms of addressing the discount and which plays to the manager’s strengths as an experienced constructor and operator, as well as increasing the frequency of continuation votes, we think ORIT’s discount of over 30% seems excessively pessimistic.


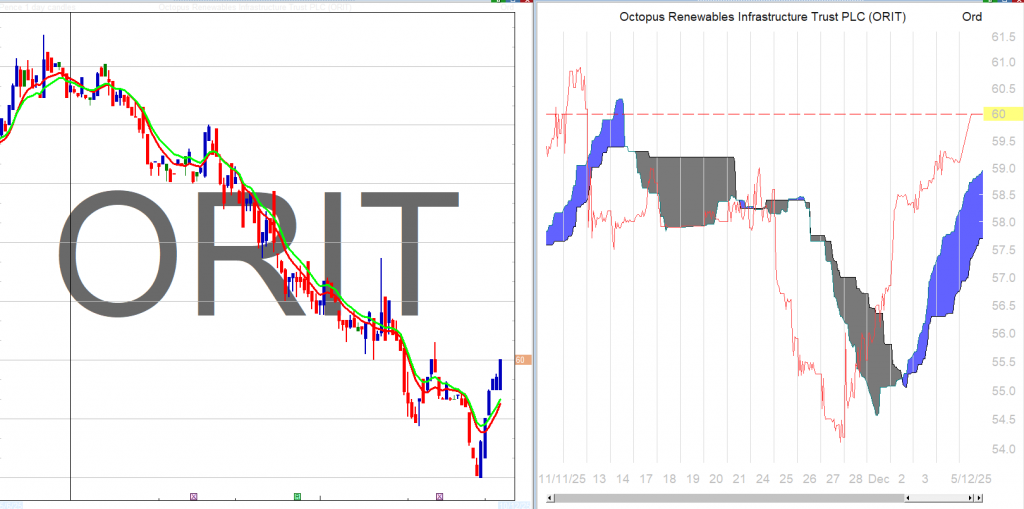
