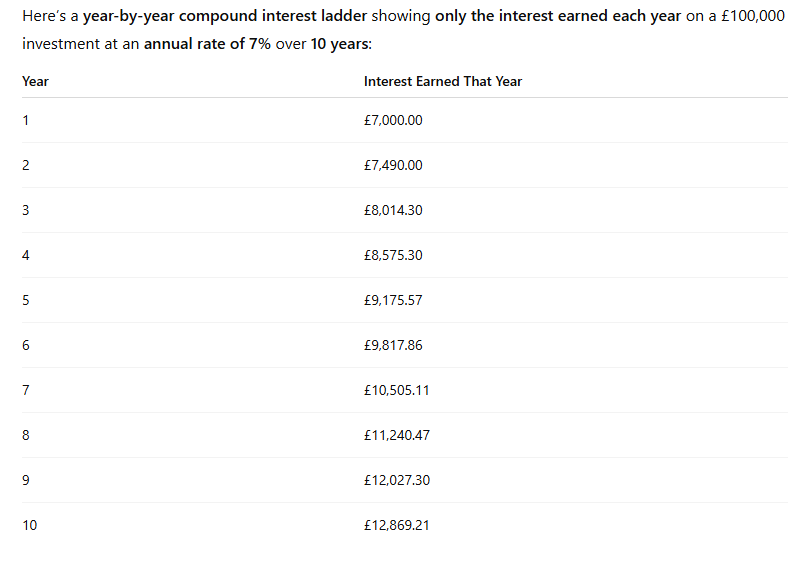
That would provide a ‘pension’ of around 13% and guess what you get to keep all your hard earned. Remember if you only have a modest amount to invest, the good news is, compound interest takes a few years to really start to make a difference.
One advantage as your Snowball starts to compound you are using the Market’s money rather than risking all of your hard earned so you are more likely to
Tomorrow for any new readers, where have you been ? I will update the rules for the Snowball.
Looking for income stocks to buy? Consider these 8%+ yielders!
Mark Hartley
MotleyFool
22 January 2026
When hunting for stocks to buy for passive income, I try not to look at yield alone. Yes, it’s the most direct metric that determines how much I could earn, but it shouldn’t be relied upon alone.
Often, high yields are unsustainable and end up leading investors into a dreaded ‘dividend trap’. Soon after purchase, the company slashes dividends and the investor’s left with a bag of worthless shares.
So when I see companies with yields of 8% or more, I first take a closer look. And it pays off because, on a few rare occasions, I find some that are actually worth considering. Here are two of them.
The up-and-coming REIT
NewRiver REIT (LSE:NRR) is a small (£307m) UK real estate investment trust that focuses on retail and community assets. Earnings are up 54% year-on-year, yet the shares still look cheap, trading on a forward price-to-earnings (P/E) ratio of just 8.9.
That suggests the market’s sceptical about the outlook for smaller property players, but the fundamentals are moving in the right direction.
For income seekers, its financial metrics are impressive: a meaty 9.2% dividend yield with a payout ratio of 97.2%. For most companies that would look dangerously high, but REITs are designed to distribute the bulk of their profits, so this isn’t unusual.
Please note that tax treatment depends on the individual circumstances of each client and may be subject to change in future. The content in this article is provided for information purposes only. It is not intended to be, neither does it constitute, any form of tax advice.
Crucially, NewRiver’s paid dividends uninterrupted for 15 years and currently has enough cash to cover the payouts, which adds comfort.
The risk? The balance sheet’s a little stretched, with total debt exceeding equity. That doesn’t make it uninvestable, but it does mean investors should watch borrowing levels and refinancing costs carefully. If earnings continue to rise, a fresh injection of equity or asset sales could help de‑risk the capital structure.
Until then, this is a high‑yield stock to consider that could reward well for accepting some leverage and sector risk.
Income in the heart of the capital
City of London Investment Group (LSE: CLIG) is a global asset manager specialising in closed‑end funds. It offers an 8.55% yield, with a payout ratio of about 106.6%. On the face of it, that’s a bit stretched, but the company has a 12‑year uninterrupted dividend record and about 1.2 times cash coverage, which helps soften the concern.
Earnings are heading the right way, up 11.6% year-on-year, and the shares look sensibly priced, with a P/E growth (PEG) ratio around 1. That suggests the valuation roughly matches its growth prospects, rather than relying on heroic assumptions.
The balance sheet is another plus: a very low debt‑to‑equity ratio of 0.03 drastically reduces the risk of a debt‑driven dividend cut.
The main risk here is that performance is tied to global markets and investor sentiment. A sharp downturn would impact the company’s assets under management (AUM), hurting fee income and the share price in one go.
For that reason, it’s best considered as part of a diversified income basket rather than a lone selection.
A risk/reward balance
While both these stocks have lower dividend coverage than I’d usually consider sufficient, their track records and balance sheets add comfort.
Still, when talking about yields above 8%, there’s always a higher risk of cuts. Both could certainly give a nice boost to an income portfolio’s average yield, keeping in mind the importance of diversification.
Allan Lockhart, Chief Executive, commented: “We delivered another strong quarter of operational performance, with growing demand across our core markets driving strong leasing activity and rising occupancy. We remained disciplined in recycling capital, improving our portfolio quality and strengthening our financial position.
With market conditions becoming more supportive and our portfolio in its best shape since before the pandemic, we move into FY27 with real momentum. We are confident in our ability to deliver further earnings growth and a well covered dividend.”
Another strong quarter of leasing performance
●
During Q3 completed 234,500 sq ft of new lettings and renewals, securing £2.1 million in annualised income across 98 transactions; long-term transactions were completed in-line with ERV and +56.9% vs prior rent
●
Key leasing transactions in Q3 include deals with Boots and B&M in Middlesbrough and H&M in Bexleyheath
●
Year to date completed 650,800 sq ft of leasing, with long-term transactions +8.2% vs ERV and +31.1% vs prior rent
●
Ongoing constructive discussions to mitigate the impact of H1 retailer restructurings and no subsequent restructurings announced
Operational metrics trending positively supported by resilient consumer spend data1
●
Occupancy increased to 96.1% (vs 95.3% at 30 September 2025) and retailer retention rate remains high at 91%
●
Total in-store customer spending in the important Christmas quarter was in-line with last year. We saw strong performance in Grocery which is our largest spending segment with +6.2% vs same quarter last year
●
Total in-store customer spending for the year to December 2025 was also in-line with last year; Non-Food Discount delivered +7.2% sales growth, F&B +4.0% and Health & Beauty +2.4%, offsetting some weakness in Value Fashion at -1.1%
●
As of 1 April 2026, the new rateable values across our portfolio are expected to increase by 7%, which is more than offset by the recently announced discount for retail, hospitality, and leisure properties, resulting in an 11% reduction in rates payable for our tenants. This is positive for our tenants and supports our rental affordability
●
Snozone performance ahead of prior year and budget with Q3 delivering EBITDA of £2.0 million vs loss of £1.6 million in H1 due to seasonality; year to date EBITDA £0.4 million, again ahead of prior year and budget with most profitable quarter to come in Q4
On target to complete c.£40 million of disposals in H2 in-line with book values
●
During Q3, completed the disposals of The Marlowes in Hemel Hempstead and Sprucefield Retail Park in Lisburn for combined proceeds of £12.6 million (NRR share); The Marlowes was the smallest asset acquired as part of the Capital & Regional transaction, accounting for 2% of the acquired portfolio by value; Sprucefield Retail Park was held in our Capital Partnership with BRAVO and its disposal means only one asset remains in this partnership (The Moor in Sheffield)
●
In January 2026, exchanged contracts on the disposal of Cuckoo Bridge Retail Park in Dumfries for proceeds of £26.5 million, subject to conditions expected to be discharged during Q4
Significant Regeneration and Work Out progress
●
In December 2025, entered into a conditional agreement to form a JV with Mid Sussex District Council to deliver the mixed-use regeneration of The Martlets shopping centre in Burgess Hill, Mid Sussex; the JV is expected to be formalised by the end of March 2026 once a series of conditions have been realised, including the sale of the residential site which is under offer, and pre-lets of the food store and hotel for which the legal negotiations are well advanced
●
In January 2026, agreement for lease signed with experiential leisure operator on c.80,000 sq ft which will re-position the Capitol Centre in Cardiff as a Core asset and reduces the portfolio weighting to Work Out and Other to 1% from 3% at 30 September 2025
Only pays a dividend twice a year, next xd in June, depending on the price could be an option to buy before the xd date and receive three dividends in just over a year, enhancing your Snowball’s yearly yield.
One to consider if you need a REIT to balance your Snowball, Fair NAV seems high, so not buy advice as it’s always better to do your own research.
Disclosure – Non-Independent Marketing Communication
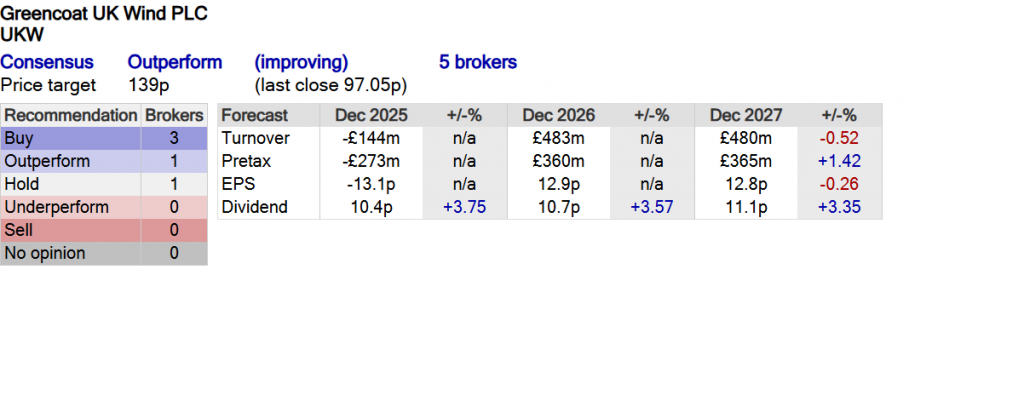
This is a non-independent marketing communication commissioned by Greencoat UK Wind (UKW). The report has not been prepared in accordance with legal requirements designed to promote the independence of investment research and is not subject to any prohibition on the dealing ahead of the dissemination of investment research.
The UK government has announced the result of its consultation into changes to the inflation indexation used in the Renewables Obligation (RO) scheme. The RO scheme will, from 01/04/2026, be indexed at the consumer price index (CPI), instead of the retail price index (RPI).
Greencoat UK Wind (UKW) had released its factsheet for 31/12/2025 on the day of the announcement and made some changes to its net asset value (NAV) and dividend policy as a result of this news on 29/01/2026.
UKW’s unaudited NAV per share had been announced as 136.1p before the RO consultation announcement, as of 31/12/2025. That was updated solely for the changes to the RO scheme the next day to 133.5p, a reduction of 2.6p, in line with November’s guidance.
The dividend policy has also been updated to reflect the RO scheme changes. Since inception in 2013, UKW has targeted (and successfully achieved) increasing its dividend each year by RPI or more. The RO scheme has been the principal instrument from which UKW has derived its explicit RPI cashflow linkage, which will now be linked instead to CPI. In addition, UKW’s contracts for difference instruments also have explicit CPI linkage.
As a result, UKW’s board has decided that its new dividend policy will be to aim to provide shareholders with an annual dividend that increases in line with CPI inflation. The target dividend for 2026, then, will be 10.7p per share, an increase of 3.4%, in line with CPI for December 2025.
The quarterly interim dividend of 2.59p per share with respect to the quarter ended 31/12/2025 remains unchanged.
In its most recent factsheet, UKW noted also that it had seen a return to normalised wind speeds in Q4 (1.6% below budget), with Q4 dividend cover of 1.8×. Overall generation in 2025 was 8.5% below budget, primarily owing to low H1 wind speeds.
Net cash generation in 2025 was robust, at £291m, producing a dividend cover of 1.3×. Gross disposals proceeds through 2025 were £181m which, alongside free cash generation, was allocated to share buybacks and debt reduction. UKW has now made cumulative buybacks of £199m since the inception of its programme.
There was a net reduction in debt principal of £118m, with a further reduction from scheduled project debt amortisation. Aggregate group debt at the end of the year was £2,126m (including MTM), or 42.5% of gross asset value.
Kepler View
While neither of the two possible changes to the RO scheme that were being consulted on were ideal,this is clearly the least-worst outcome and removes a key piece of uncertainty that had been hanging over renewable energy infrastructure investment companies. Accordingly, UKW’s shares initially rose as much as 4.5%, before settling c. 0.7% higher by the end of the day (28/01/2026).
Considering the result of the consultation, it makes sense to us that UKW would change the inflation linkage in its dividend policy from RPI to CPI to ensure that dividend cover remains strong and does not compromise future dividend growth nor dividend cover.
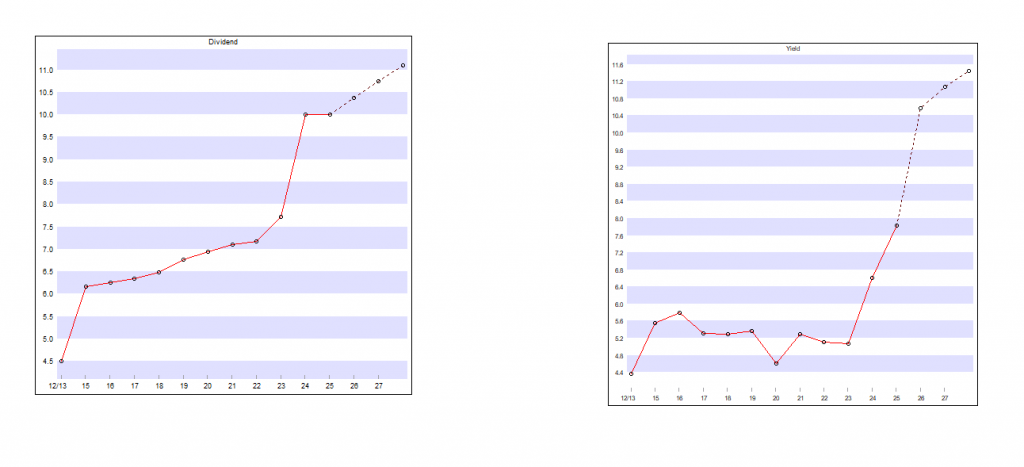
Indeed, UKW has increased its dividend by RPI or better for each of the 12 years it has been a listed company. The dividend has grown from 6p per share at IPO to 10.35p by 2025, a cumulative increase of 72.5%, and the target is to increase this further to 10.70p in 2026. This dividend progression has been underpinned by strong cashflow generation since IPO.
The company’s forward-looking dividend cover and cashflow generation expectations remain robust and the former is substantially unchanged. This leaves UKW with one of the most robust dividends in the sector and unique in that the dividend is still linked to inflation.
With shares trading at 98p at the time of writing (on 29/01/2026), the forecast yield based on UKW’s 2026 dividend target is 10.9%. That’s extremely attractive, at almost two-and-a-half times the 4.5% yield offered by a 10-year UK government bond.
In addition, UKW’s structurally higher dividend cover means that it still has options to deploy surplus cashflows towards new investments, buybacks or reducing debt. We note that UKW continues to buy shares back, illustrating the confidence the board has in strength of the balance sheet.
As discussed in our recent feature, the fundamentals of the renewable energy sector appear to remain as strong as ever, and UKW has delivered impressive NAV total returns of 185% since launch 12 years ago, yet shares currently trade below their IPO price, suggesting, on a discount of c. 27%, there remains latent value, in our view.
Greencoat UK Wind PLC is pleased to announce that the Company has been named winner of the Renewables – Active category in the AJ Bell Investment Awards 2025.
AI Overview
Greencoat UK Wind (UKW) is considered by some analysts to be an interesting investment due to its attractive dividend yield (around 10%), strong cash flows, inflation-linked revenue, and a discount to its Net Asset Value (NAV), potentially offering significant upside if rates fall and discounts narrow; however, recent performance has been hit by lower wind speeds and higher interest rates impacting sector valuations, though its long-term strategy focuses on outperformance through asset management and accretive investments, with recent refinancing showing resilience.
Potential Positives (Bull Case):
High Dividend & Yield: Offers an attractive dividend yield, well-covered by earnings, and is linked to inflation (RPI), providing income growth.
Discount to NAV: Trades at a discount to its underlying asset value, suggesting potential capital appreciation if the discount narrows.
Inflation Protection: 60% of revenues are fixed and linked to inflation, protecting dividend growth.
Long-Term Outperformance: Historically outperforms its sector over longer periods, despite recent headwinds.
Management Expertise: Experienced team actively managing assets and pursuing accretive investments.
Potential Risks (Bear Case):
Sector Headwinds: Rising interest rates and lower energy price forecasts have impacted the entire sector.
Low Wind Speeds: Recent periods of low wind have affected generation and valuations.
Discount Persistence: The discount to NAV could remain, limiting capital raising ability.
Valuation Assumptions: Long-term NAV valuations rely on assumptions that might not always prove accurate.
Analyst Sentiment (Recent):
Despite recent share price struggles and sector pessimism, some analysts see attractive forward-looking returns and believe the “baby has been thrown out with the bathwater”.
Forecasts suggest significant total returns (price appreciation + dividends) are possible over the next year.
Conclusion:
Greencoat UK Wind presents a compelling case for income-focused investors seeking inflation-linked returns, but it’s not without risks tied to macro-economic factors and weather. Its valuation discount and strong cash flows make it interesting, but investors should be prepared for volatility, as highlighted by recent performance.
CANACCORD STARTS GREENCOAT UK WIND WITH ‘HOLD’
Dividend Policy and 2026 Dividend Target
The Company also announces a quarterly interim dividend of 2.59 pence per share with respect to the quarter ended 31 December 2025.
Dividend Timetable
Ex-dividend date 12 February 2026
Record date 13 February 2026
Payment date 27 February 2026
The Company has been reviewing its dividend policy in line with the range of potential outcomes from the RO Indexation Consultation. The Company has, for 12 consecutive years, increased its dividend by RPI or better, from a 6 pence dividend per share at IPO to 10.35 pence in respect of 2025. Dividend progression has been underpinned by strong cashflow generation.
The principal instrument from which the Company derives explicit RPI cashflow linkage is the RO scheme, which will now be indexed to CPI. The Company’s Contracts for Differences instruments also have explicit CPI linkage. The Board has therefore determined that its dividend policy will now be to aim to provide shareholders with an annual dividend that increases in line with CPI inflation.
Accordingly, the Company announces an increase in the target dividend for 2026 to 10.7 pence per share in line with CPI for December 2025 of 3.4%. The Company’s forward looking dividend cover expectations remain robust and are substantially unchanged.
For the avoidance of doubt, the quarterly interim dividend of 2.59 pence per share with respect to the quarter ended 31 December 2025 remains unchanged.
CT Global Mgd – CMPI – Half Year Report to 30 November
Unaudited Half-Year Results for the Six Months ended 30 November 2025
The Board of CT Global Managed Portfolio Trust PLC (the ‘Company’) announces the unaudited half-year results of the Company for the six months ended 30 November 2025.
Income Shares – Financial Highlights and Performance Summary for the Six Months
· Dividend yield(1) of 6.2% at 30 November 2025, compared to the yield on the FTSE All-Share Index of 3.2%. Dividends are paid quarterly.
· Net asset value total return(1) per Income share of +12.0% for the six months, outperforming the total return of the FTSE All-Share Index of +11.8% by +0.2 percentage points.
Growth Shares – Financial Highlights and Performance Summary for the Six Months
· Net asset value total return(1) per Growth share of +11.9% for the six months, outperforming the total return of the FTSE All-Share Index of +11.8% by +0.1 percentage points.
· Net asset value total return per Growth share of +208.8% in the 15 years to 30 November 2025, the equivalent of +7.8% compound(1) per year. This compares with the total return of the FTSE All-Share Index of +213.5%, the equivalent of +7.9% compound per year.
The Chairman, David Warnock, said:
“The Board and Manager continue to believe the Portfolios comprise high class investment companies, diversified across geography and investment style and are well set to deliver future shareholder returns”.
Notes:
(1) Yield, total return and compound annual NAV total return – See Alternative Performance Measures.
Chairman’s Statement
Highlights
• Net asset value (‘NAV‘) total return for the six months of +12.0% for the Income shares and +11.9% for the Growth shares as compared to the total return for the FTSE All-Share Index of +11.8%
• Income shares dividend yield of 6.2% at 30 November 2025
Investment performance
For the six months to 30 November 2025, the NAV total return was +12.0% for the Income shares and +11.9% for the Growth shares. The total return for the benchmark index for both share classes, the FTSE All-Share Index, was +11.8%. Of relevance and for interest, the FTSE All-Share Closed End Investments Index total return was +13.1% for the period.
These six months saw strong returns across equity and bond markets as worries over a global trade war dissipated. This is mostly thanks to the initial level of tariffs announced by President Trump back in April being watered down and a number of ‘trade deals’ being announced between the US and its trading partners. Economic data remained generally positive, with falling – yet still above central bank target – inflation, allowing central banks to further cut interest rates. In the UK, the long-awaited budget brought some relief in respect of keeping financial markets and Labour backbenches satisfied but failed to deliver policies to boost the UK economic growth outlook.
UK equities posted solid returns over the six-month period, with a +12.4% total return for the FTSE 100 and a +7.4% total return for the FTSE 250. Elsewhere, in sterling terms, US equities continued their recovery from the ‘Liberation Day’ selloff, with a +18.6% total return for the S&P 500, while in Europe the total return for the MSCI Europe ex UK Index was +9.4%. The strongest returns included South Korea, with a total return of +52.6% from the MSCI Korea Index. Global government bonds, as referenced by the FTSE World Government Bond Index (GBP Hedged) were up +2.5% and the gold price continued its ascent, up +28.1%.
From 1 June 2025, the beginning of the Company’s current financial year, the investment portfolios have been managed by Investment Managers Adam Norris and Paul Green, supported by the Manager’s broader EMEA Multi-Asset Solutions team (of which they are members). The previous longstanding Investment Manager, Peter Hewitt, has retired and the Board wishes him a long and happy retirement, while thanking him for his years of service.
The Investment Managers’ Review follows, and it is pleasing to see that, in their first six month period, the NAV total return of both Portfolios was strong and also marginally ahead of the benchmark index. The Investment Managers have been repositioning between sectors and regions and highlights of their recent investment activity are set out in their review.
Dividends
As I referenced in the 2025 Annual Report and Financial Statements, in the absence of unforeseen circumstances, it was (and remains) the Board’s intention to pay four quarterly interim dividends, each of at least 1.90p per Income share so that the aggregate dividends for the financial year to 31 May 2026 will be at least 7.60p per Income share (2025: 7.60p per Income share).
To date, first and second interim dividends in respect of the year to 31 May 2026 have been announced and paid, each at a rate of 1.90p per Income share (1.85p per Income share in the corresponding periods in the year to 31 May 2025).
The minimum intended total dividend for the financial year of 7.60p per Income share represents a yield on the Income share price at 30 November 2025 of 6.2% which was materially higher than the yield of 3.2% on the FTSE All-Share Index at the same date.
Borrowing
At 30 November 2025 the Income Portfolio had total borrowings drawn down of £7 million (9.2% of gross assets), unchanged over the period, the investment of which helps to boost net income after allowing for the interest cost. The Growth Portfolio had no borrowings, also unchanged.
Management of share price premium and discount to NAV
In normal circumstances the Board aims to limit the discount to NAV at which the Company’s shares might trade to not more than 5%. During the six months to 30 November 2025 the Income shares traded at an average discount to NAV of -0.4% and the Growth shares traded at an average discount of -3.5%. At 30 November 2025, the Income shares and Growth shares stood at a premium to NAV of +0.6% and +0.9% respectively.
The Company is active in issuing shares to meet demand and equally in buying back when this is appropriate. During the six months to 30 November 2025, 200,000 Income shares were bought back for treasury at an average discount of -3.6% to NAV and then subsequently resold from treasury at an average premium of +1.5% to NAV. In addition, 2,430,000 new Income shares were issued from the Company’s block listing facilities at an average premium to NAV of +1.6%. 1,578,000 Growth shares were also bought back to be held in treasury at an average discount to NAV of -3.8% and 450,000 Growth shares were resold from treasury at an average premium to NAV of +1.6%.
Since the end of the period, a further 3,095,000 new Income shares have been issued and a further 765,000 Growth shares have been resold from treasury. To facilitate this demand, at the start of December 2025, the Company obtained a further block listing of 8,000,000 Income shares, which can be allotted, when there is demand. The Income shares were issued and the Growth shares resold from treasury at average premiums to NAV of 1.6% and 1.5% respectively. Much of this recent demand has come from former shareholders in European Assets Trust which underwent a corporate transaction with The European Smaller Companies Trust (‘ESCT‘) in the autumn. Shares in ESCT are not eligible to be held through the Manager’s savings plans and we welcome those investors who have decided to invest instead in CT Global Managed Portfolio Trust.
Last year was one to remember for dividend hunters and followers of this column, generating more income than expected and a record capital gain.
Lee Wild explains how it happened.
29th January 2026
by Lee Wild from interactive investor
It seems difficult to believe that so much was packed into 2025. Events that might otherwise have condemned global financial markets to a miserable time after back-to-back winning years, turned out to be a trigger for a third consecutive prosperous 12-month period for investor US President Donald Trump continued to have an outsized impact on stock performance. His radical Liberation Day tariffs caused one of the biggest stock market corrections in decades. However, some serious backpedalling on the scale of import duties gave birth to the amusingly named TACO trade, or Trump Always Chickens Out.
Equity markets recovered almost as quickly as they had fallen, and every major global stock index ended 2025 ahead. For UK investors, it was thrilling to see the FTSE 100 register a 21.5% gain, its biggest annual increase since 2009 and better than anything Wall Street could muster.
Falling interest rates have played a significant role in the spectacular rebound and UK stock market revival, as inflation washed through the system. Investors have also been excited by major themes such as artificial intelligence (AI) on which tech giants have been spending hundreds of billions of dollars. Now the pressure is on to make it work, and big profits are needed to justify spending and sky-high valuations.
New themes such as quantum computing grabbed headlines, although momentum has been lost more recently. It was the same for crypto, where bitcoin raced to a new high at $126,000, dragging related assets with it, before a swift pullback. Enthusiasm for precious metals amid geopolitical uncertainty has seen prices for gold and silver regularly make record highs. And there seems no obvious end to the mining sector boom.
Trump proved again that he has the power to move markets in either direction, when he gave a massive boost to the global defence sector. Bullying other countries into spending more on their militaries propelled UK operators such as BAE Systems BA.
and Rolls-Royce Holdings RR. to record highs.
And the ongoing precious metals rally reflects investor fears about the president’s unique approach to domestic and foreign policy. Both the metals and defence sectors are key reasons why the FTSE 100 just broke above the psychologically important 10,000 level. And geopolitics remain a major talking point in 2026. Already this year we’ve had the seizing of Venezuela’s leader by American forces and the threat of repercussions for European countries opposing his annexation of Greenland. It’ll be interesting to see how the land lies when Trump faces mid-term elections in November. Before then, we’ve got any number of potential flashpoints and concerns to navigate. It’ll be another interesting year for sure.
Income portfolio performance in 2025 A year ago, I expected the 10 stocks in this income portfolio to generate £10,338. I like to go for a little bit more than the round £10,000 as a kind of insurance policy should anything go wrong with one or more of the choices. I needn’t have worried. I ended up with £10,680, a chunk of which is attributed to an unexpected special dividend from Sainsbury (J) SBRY
Apart from a small shortfall from Rio Tinto Ordinary Shares RIO
other constituents delivered pretty much the income I expected. As well as the £1,452 from Sainsbury’s, the portfolio banked £1,483 from my favourite income play M&G Ordinary Shares MNG
.But the biggest income generator in 2025 was Legal & General Group LGEN
where the 9.2% yield I locked in a year ago dropped £1,653 into the coffers.
Targeting a 6.8% yield, the portfolio delivered 7%. But there was a fantastic capital return this time, too. In fact, it was the biggest profit generated by any of my equity income portfolios.
By the end of the 12 months, the £152,000 it cost to buy the 10 stocks had turned into £189,963. Both HSBC Holdings HSBA
and M&G were up almost 50% and GSK GSK
,Rio Tinto and British American Tobacco BATS
all rose 30% or more. Only Taylor Wimpey TW.
fell, dropping 9%, although the income was welcome. Combined, the income and 25% capital gain generated by the entire portfolio gave a total return of 32%.
As always at this point, I issue a reminder that investors don’t typically revamp an entire portfolio at the beginning of a calendar year. The reason I make changes to this income portfolio is to ensure the exercise remains relevant whether you’re an existing investor or coming to the portfolio for the first time. This year there are four changes.
The shares that stay in 2026
Rising stock markets means it has cost a bit more to put together this year’s portfolio. To achieve the targeted £10,000 of annual income, I’ve had to spend £168,000, the same as in 2024, but £16,000 more than in 2025. The prospective yield is 6%.
With share prices significantly higher than they were this time last year, there are fewer eye-catching yields out there, especially in the blue-chip index. However, I’ve been able to stick with a few of the same high yielders in 2026 and some of last year’s other stocks for diversification.
I’m remaining faithful to the pair of star income plays of 2025 – L&G and M&G – both yielding well over 9% and between them generating over £3,000 of income. This time they yield 8.4% and 6.9% respectively, and their consistency over the years would be foolish to reject this time.
The tariff playbook: why I’m sticking with UK markets in 2026 Sign up to our free newsletter for investment ideas, latest news and award-winning analysis While I don’t expect Sainsbury’s to return anything like the 9.7% it generated last year – it’ll likely be about half that – it remains the best income option in the grocery sector. It’s also working hard on growing market share, battling the discounters such as Aldi and Lidl while offering premium alternatives to Waitrose and Marks & Spencer Group MKS
In the blue-chip oil sector, it’s BP BP.
that keeps its spot in this income portfolio. At around 5.5%, it yields about 160 basis points more than Shell SHEL
and, while it’s slightly more expensive, it outperformed its rival too in terms of share price performance. There’s seems little reason to switch sides.
Utilities are rarely exciting, which can be great for an income portfolio like this. However, last year National Grid NG.
generated a dividend yield of 4.8% for us plus a 21% capital return. And despite a more modest 3.9% predicted yield in 2026, I’m keeping this diversifier for its defensive appeal, inflation-linked dividend and attractive forecast earnings growth.
I’ve given this final stock a lot of thought, and the decision to keep it was not an easy one. I want a housebuilder in the portfolio, and the sector still screens as cheap, trading on 0.8x price to book, according to Morgan Stanley. Taylor Wimpey might not be the analysts’ favourite, perhaps exposed more than others to slower house price growth, but it has an eye-catching 8.3% dividend yield and is similarly valued to sector peers. That’s impossible to ignore.
Heading for the exit British American Tobacco yielded 7.5% in dividends last year plus a 32% capital return, outperforming sector peer Imperial Brands IMB
But this year may be harder, with weaker cigarette fundamentals and growth in so-called New Category sales. I’m looking for better value and a more compelling investment case.
I’m grateful to GSK for three years of strong dividend income, including last year’s 4.7% yield and 30% share price gain. But the shares now trade at the top of their 13-year range of roughly 1,300p to 1,800p, and a forecast dividend yield of 3.5% doesn’t cut it. Time to let another stock have a go.
HSBC was the second-biggest riser in the 2025 portfolio with a 48% rally, but it also delivered the 6% dividend yield I’d picked it for. Of course, I still want to own a bank stock here, but a sector-wide rally has made it less attractive for income seekers, yielding a more modest 4%.
Rio Tinto is a fantastic company, and it has provided valuable dividend income over the years. However, the shares are up 46% in the past six months at a record high, and the yield has dropped to almost 4% from nearly 6% in 2025. A potential mega-merger with Glencore GLEN
also carries with it risk, so I’m going without a miner in the portfolio this time.
New holdings for 2026 Despite a 56% surge in the past 12 months, NatWest Group NWG
is the cheapest UK bank and yields 5%, much more than its high street rivals. Yes, it is a little more sensitive to interest rates, but it’s both a fitting replacement for HSBC and gives us exposure to a sector which should benefit from an improving UK economy.
Land Securities Group LAND
makes its debut in this income portfolio series, which tells you all you need to know about the parlous state of the property sector in recent years. However, the ship has steadied and LandSec offers one of the best yields in the sector at around 6.4% plus an attractive valuation.
Pennon Group PNN
is the second utility in this year’s portfolio. The water company had underperformed peers in recent years but has staged a recovery, now offering a sector-leading 6% yield. As utilities are minded to, the company set out its five-year dividend policy to 2030 which will see the payout grow in line with the Consumer Price Index including Owner Occupiers’ Housing Costs (CPIH).
My rationale for ejecting BATS this year was to find “better value and a more compelling investment case”. There’s not much choice in the UK tobacco sector, but Imperial Brands and its 5.5% prospective dividend yield is a worthy replacement. The valuation is undemanding – it’s much cheaper than BATS – and the view in the City is that earnings visibility and moderate leverage should guarantee superior capital returns.
Recession in 2026? Here’s My Take (and a 9% Payer to Profit)
by Michael Foster, Investment Strategist
My prediction for 2026? Strange as it may sound, given the wild headlines we’re seeing pretty much daily, I’m calling for more of the same.
As I said a couple weeks ago, I expect around 12% returns from the S&P 500 this year.
That’s why we’ve been adding to the equity CEFs in the portfolio of our CEF Insider service. Today I want to talk about one of our holdings, in particular: a 9%-payer called the Liberty All-Star Growth Fund (ASG).
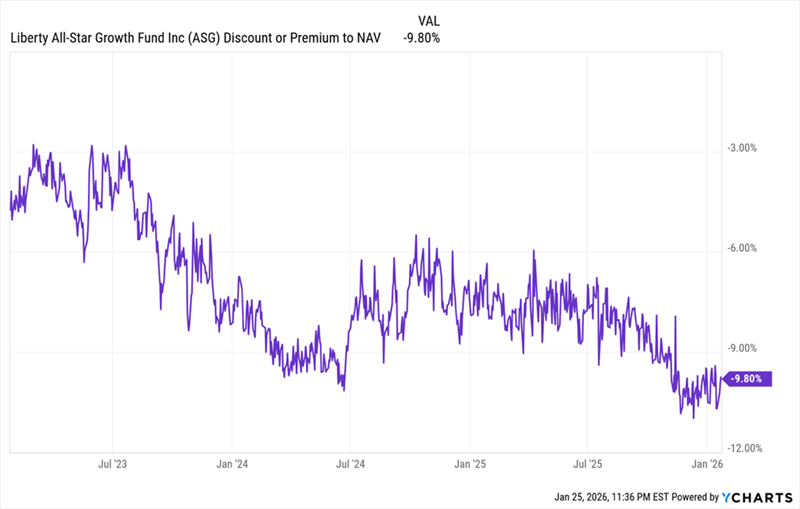
We’re zeroing in on this one because its discount to net asset value (NAV, or the value of its underlying portfolio) is the biggest it’s been in three years. As a result, we can buy ASG, and its portfolio of US blue chips, for around 90 cents on the dollar. That markdown helps reduce any worries around valuation as the market keeps rising higher.
Bubble Worries Are a Plus for Us (and This 9%-Paying Fund)
Remember that recession we were told had a 100% chance of happening back in 2022? Well, we’re still waiting for it.
Meantime, US GDP rose 4.4% at the last reading for the third quarter, and our most up-to-date estimate, the Atlanta Fed’s GDPNow indicator is showing over 5% growth for Q4. These are strong numbers, especially with average annual growth around 3%.
Then there’s AI, which continues to spread through the economy, boosting productivity as it does. When you account for the AI effect, the 13.4% return the S&P 500 has put up over the last 12 months (versus its long-term average of 10.6% annualized) makes sense. The market is simply telling us that it’s pricing in a bit of extra juice from this new tech.
So we’re going to go ahead and let the mainstream crowd fret. The truth is, the numbers don’t support the idea of a bubble right now.
That’s one reason for the 9.8% discount on ASG, which sports a high-quality portfolio of US blue chips like NVIDIA (NVDA), Microsoft (MSFT) and Apple (AAPL), as well as domestic-focused midcaps like property manager FirstService (FSV) and Pennsylvania retailer Ollie’s Bargain Outlet Holdings (OLLI).
ASG Drops Into the Bargain Bin That 9.8% discount makes ASG particularly compelling when you consider that its NAV has gained 11.5% annualized over the last decade.
Something else many CEF investors don’t realize is that a discount like this helps keep a fund’s dividend stable. That’s because, when you calculate ASG’s yearly payout based on NAV, not the discounted market price, you get 8.1%. This is significantly below ASG’s yield on market price and an easier figure for management to cover.
That said, the point is pretty much moot when you consider that the fund’s 11.5% annualized NAV return over the last 10 years means it has been out-earning that payout for a long time.
Now, we do need to bear in mind that ASG’s management ties its dividend to NAV, with the stated goal of paying 8% of NAV as dividends a year, so the payout does float around some. But given ASG’s strong NAV performance, the dividend has been pretty stable for the last three years.
Steady Payouts at a Healthy DiscountSource: Income Calendar But all that said, there is a question we need to ask: After three years of the discount getting steeper, should we worry it will never go back to where it used to be?
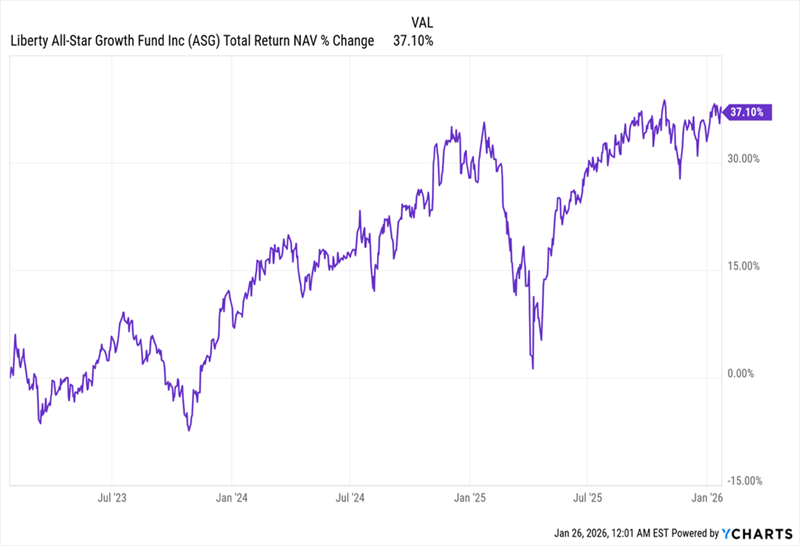
To answer that, we need to look at where ASG’s total NAV return has gone in that three-year span. And it’s been nowhere but up:
ASG’s Short-Term Performance: Strong Over the last three years, ASG has delivered about a 12% total NAV return, a bit above the 11.5% it’s posted over the last decade. Over the long haul, discounts like this tend to narrow in the face of such persistent strong gains.
That makes this discount a sign that ASG is ripe for buying: The market will eventually reward this strong performance (and dividend). But if we buy today, we’ll get in at a discount before that happens.