Our columnist highlights a handful of trusts that he hopes will deliver a high and rising income.
8th January 2026
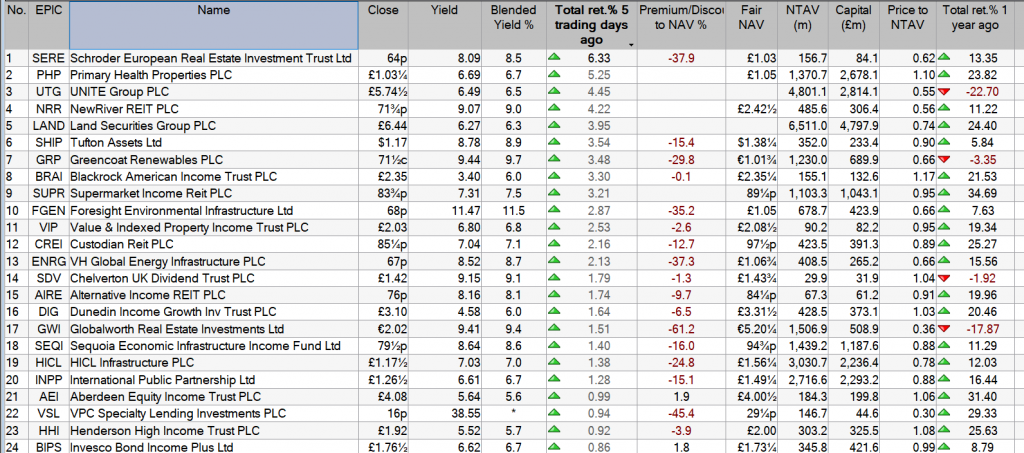
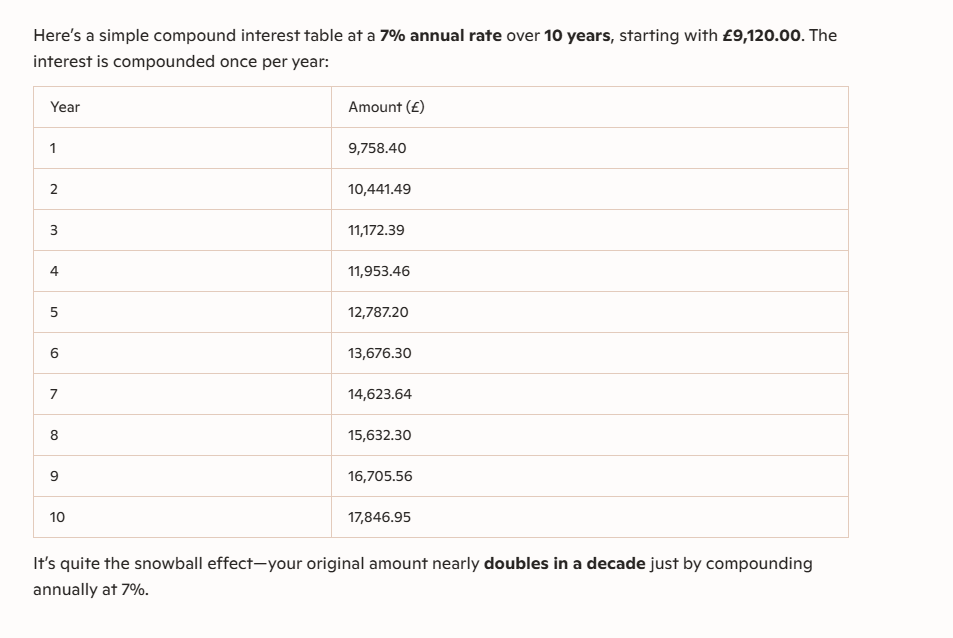
Reduced returns from “risk-free” deposits are likely to increase the relative attraction, and share prices, of investment trusts that yield a high and rising income. So here are six of mine:
Tufton Assets
This ship leasing specialist’s dividends currently equal an eye-stretching 8% of its share price. Better still, investors’ income has risen by a buoyant annual average of 7.4% over the last five years, according to the Association of Investment Companies (AIC).
It is important to be aware that dividends are not guaranteed and can be cut without notice. But if that rate of ascent could be sustained it would double the value of Tufton Assets Ord SHIP dividends in less than a decade
Here and now, the price of high income has been relatively low total returns of 73% over five years and just 3.4% over the last year – it lacks a decade-long record, having been launched in September 2016 – but the shares are priced 16% below their net asset value (NAV), so do not look expensive.
This is the biggest holding in my ISA, plotting a course to make the most of tax-free income.
Greencoat UK Wind
Renewable energy infrastructure funds have fallen out of fashion, taking share prices with them.
Delivered total returns of 66% over the last decade and just 2.3% over five years, followed by a loss of 15% over the last year.
That decline pushed up the yield to a somewhat dubious 10.5%, rising by 7.6% per year over a five-year period.
I say “somewhat dubious” because a double-digit yield might be a warning of further capital destruction to come.
For example, offshore wind farms might not last as long as expected in the very hostile environment of the North Sea.
I have no idea but note that UKW has increased dividends in line with the Retail Prices Index (RPI) every year since its flotation in 2013 and have no intention of selling shares while they trade 30% below their NAV.
It’s another ISA holding to whistle up tax-free income.
International Public Partnerships
Funding infrastructure can produce inflation-linked income, such as this trust’s 7% yield, rising by 3.1% a year over a five-year period.
Once again, the price of high yield was relatively low total returns of 52% over the last decade, followed by a loss of 3.7% over five years and a positive 13% over the last year.
Maybe it’s because I’m a Londoner but I like the fact that
main underlying holding is Thames Tideway Tunnel, the 15-mile long super-sewer which claims to have kept 12.9 million tonnes of sewage out of the river since opening in 2024.
Despite doing well by doing good, these shares – another ISA holding – trade at a 15.5% discount to NAV.
BlackRock Frontiers
With more than 24% of assets invested in Saudi Arabia and the United Arab Emirates (UAE), it might seem surprising that this fund yields 4.1% income, rising by an annualised 7.2% over the last five years.
Poland, Turkey and Egypt are the other exotic markets in its top five geographical areas. BlackRock Frontiers Ord BRFI
is held in my self-invested personal pension (SIPP), where its lower yield is justified by higher total returns than any of the three shares mentioned earlier.
It delivered 181%, 88% and 22% over the last decade, five years and one-year periods and is priced 2% below NAV.
Its 3.6% yield might seem relatively modest but total returns of 44% over five years and 31% over the last year have helped make Ecofin Global Utilities & Infra Ord EGL
the seventh-most valuable share in my life savings. It trades 9% below NAV.
Schroder Japan
Until recently, funds focused on the Land of the Rising Sun rarely paid much income and this share’s 3.5% yield might seem nothing to write home about.
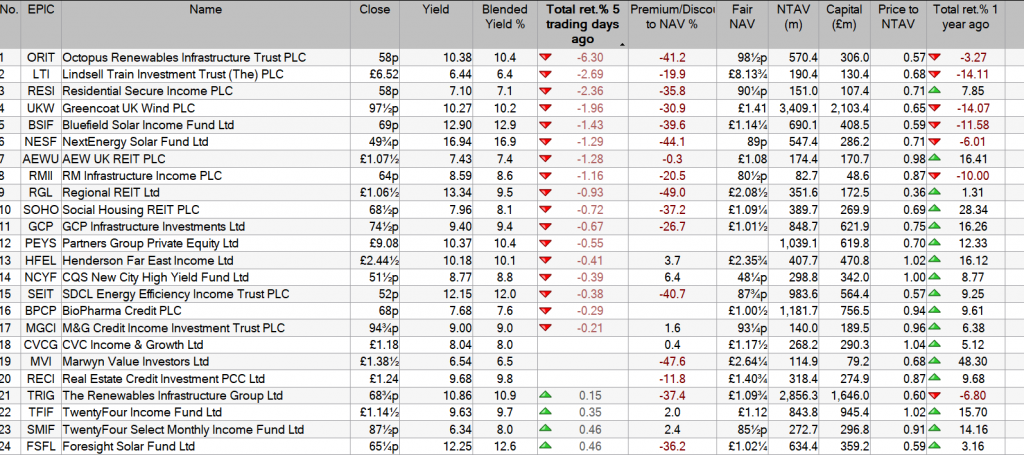
NESF’s yield isn’t high because the dividend is unusually generous — it’s high because the share price has been hammered far below the value of the underlying assets. That discount mechanically inflates the yield. A clearer breakdown makes the whole picture snap into place.
🌞 Why NESF’s Yield Looks So High
The share price has collapsed far more than the fundamentals NESF trades at a very deep discount to NAV — around 49p vs. an estimated NAV of ~89p. That’s roughly a 45% discount. When the price falls but the dividend stays the same, the yield spikes. This is exactly what’s happening.
The entire renewable energy sector has been hit by higher interest rates Higher rates reduce the attractiveness of income‑producing assets like solar funds. According to sector commentary, this macro pressure has driven a broad derating across renewables, including NESF.
NESF’s discount is unusually large — even compared to peers QuotedData notes that NESF has one of the highest yields in the FTSE 350 because the discount is “hefty and irrational” relative to the underlying cash generation.
The dividend is actually well covered NESF’s dividend was 1.3× cash-covered in FY2024, with a target of 1.1×–1.3× for FY2025. This means the payout isn’t being propped up by financial engineering — the assets are generating the cash.
Market sentiment is disconnected from fundamentals Investors are pricing in:
interest-rate risk
regulatory uncertainty (e.g., ROC/FiT consultations mentioned in announcements)
general pessimism toward UK-listed renewables But the underlying solar assets continue to produce stable, inflation-linked revenue.
📊 Putting it all together
🎯 The real reason the yield is high It’s not that NESF is paying an unusually large dividend — it’s that the market is unusually pessimistic. The yield is a symptom of the discount, not a sign of reckless payouts.
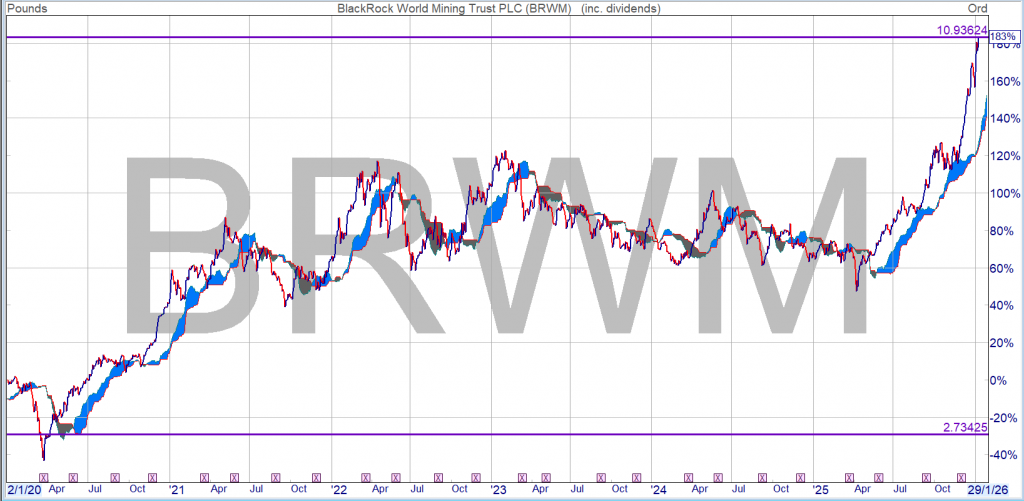
BRWM is a share I have traded but not in the Snowball also not recently so I missed the latest out performance. You can’t own all the shares.
In general you want to buy and hold above the cloud.
In the cloud watch as the share could go up or down.
Beneath the cloud the share is raining on your parade and you should consider selling and wait to buy back.
As you can see from the chart, you have to kiss a few frogs before it turns into your prince/princess.
If you bought as part of a dividend re-investment plan not only have you earned dividends which could have been re-invested back into BRWM, you could also then have re-invested the dividends back into your Snowball as the price rose and the yield fell, you would also have all the outperformance.
Whilst nothing works all the time with charting, the obvious is, if you buy a share paying a dividend just in case your analysis is wrong, and buy and hold for the long term, the odds are on your side.
You would have achieved the holy grail of investing, where you can take out your stake, re-invest it in another share and continue to receive income on a share that costs you nothing, zero zilch.
If you bought after the covid crash around 250p the dividend was 22p, a yield just under 9%.
The current dividend is 23p, so you would still receive the buying yield but the current yield is 2.5% so the incentive would be to sell some and invest the money back into a higher yielder.
This is not substantive investment research or a research recommendation, as it does not constitute substantive research or analysis. This material should be considered as general market commentary.
Without looking, what would be your best guess for the returns of the Latin American index in 2025? Well, as of 19/12/2025, it was up 43.6% in sterling terms. Nvidia, on the other hand, was up around half this, at 26.4%. Great returns for the year, and well ahead of the 10.4% the S&P 500 delivered, but UK investors aren’t benchmarked to the S&P. In fact, lots of investment trusts did significantly better than the world’s largest graphics card creator in 2025, which we think has some lessons for 2026.
Monotonous monoculture
Nvidia has dominated investment discourse over 2025. The most popular retail buys and sells tracked by our investment writing team show that it has dominated trades as well. Across four of the largest retail platforms it was the most bought stock in five of the first 11 months of 2025, and in the top three most bought in nine of those months. The chart below shows some signs of a wobble in conviction in the three months following Liberation Day, but it was back at the top again by the end of the year. To interpret the chart below, note that a lower number means it is higher up the list of most bought stocks.
NVIDIA ON RETAIL PLATFORMS
Source: Hargreaves Lansdown, AJ Bell, Bestinvest and interactive investor
Any parent will be well aware that the American dominance of our culture is only growing. We think the US-centric nature of financial media and social media in general has contributed to Nvidia staying central to the conversation – in dollar terms it has returned around 33%, and, of course, outperformed the US investor’s benchmark, the S&P 500. But under the radar, lots of more prosaic investments have delivered much better returns
The growth themes that outperformed
By our count, 65 investment trusts outperformed an investment in Nvidia in 2025, and ten Morningstar sector averages did. The top performer was Golden Prospect Precious Metals (GPM), which delivered a stunning 147.9% share price return (to 19/12/2025). Gold the metal had a good year, and the miners finally caught up. The performance of gold miners also drove the generalist mining trusts: CQS Natural Resources Growth & Income (CYN)made 89.9% and BlackRock World Mining (BRWM)73.9%. Gold miners entered the year looking cheap and unloved, not having responded to gold’s strength in 2024. In fact, gold mining indices underperformed the metal in 2024, and investors who stuck with that trade rather than investing in thematically related equities, which had lagged, would have lost out.
Copper prices were also strong over 2025, and this contributed to good returns for the mining trusts. Copper benefits from demand for AI data centres and the expansion of the grid necessary to power them. Copper miners supported the returns of BlackRock Latin American (BRLA), up 52.9%, with the strength of demand for materials boosting domestic economies in its region, as well as Fidelity Emerging Markets (FEML) with the latter delivering a share price total return of 49.3%. FEML also had some very successful investments in technology stocks connected to the AI trade. This is another theme to come out of the table: investing in AI-related assets further down the chain than Nvidia’s GPUs. Rotating out of 2024’s leading stocks in this theme into related names yet to keep up would have been a winning strategy in 2025.
A recovery in China boosted a number of trusts to outperform Nvidia in 2025. Some optimism about the potential for AI may have contributed to good returns in the tech sector in the country, so there are some parallels with this trade. EVs and autonomous driving continues to deliver gains for related companies too, with there being some connections to AI. Dale Nicholls, manager ofFidelity China Special Situations (FCSS), has been taking some profits in these areas and rotating into consumer-related names, which he thinks could have catch-up potential. We think this might be a fruitful avenue to explore in 2026 in countries where AI-related earnings are strong enough to boost activity across the economy – Latin America could be one such area. FCSS made 42.3% over 2025, and Baillie Gifford China Growth (BGCG)37%.
MINING AND EM OUTPERFORMERS
Association of Investment Companies (AIC) Sector
SP Return (GBP, %)
Latest Discount (Cum Fair, %)
Golden Prospect Precious Metals
Commodities & Natural Resources
147.9
-21.6
CQS Natural Resources G&I
Commodities & Natural Resources
89.9
-2.2
BlackRock World Mining Trust
Commodities & Natural Resources
73.9
-4.4
BlackRock Latin American
Latin America
52.9
-5.4
Fidelity Emerging Markets
Global Emerging Markets
49.3
-8.5
Templeton Emerging Mkts Invmt Tr TEMIT
Global Emerging Markets
42.6
-8.2
Fidelity China Special Situations
China / Greater China
42.3
-9.8
Baillie Gifford China Growth Trust
China / Greater China
37
-9.1
BlackRock Energy and Resources Inc
Commodities & Natural Resources
35.6
-8.3
JPMorgan China Growth & Income
China / Greater China
35.5
-6.7
Pacific Horizon
Asia Pacific
32.4
-8.2
Utilico Emerging Markets
Global Emerging Markets
30.8
-9.2
Invesco Asia Dragon Trust
Asia Pacific Equity Income
30.4
-6.2
Barings Emerging EMEA Opportunities
Global Emerging Markets
30.3
-12.7
JPMorgan Global Emerg Mkts Inc
Global Emerging Markets
29.3
-8.6
JPMorgan Emerging Markets Growth & Inc
Global Emerging Markets
27.5
-7.6
Baker Steel Resources
Commodities & Natural Resources
27.4
-37.7
Aberdeen Asia Focus
Asia Pacific Smaller Companies
27.4
-11.7
Nvidia Corp
26.4
Source: Morningstar, 01/01/2025 – 19/12/2025 Past performance is not a reliable indicator of future results
Biotech is another success story of 2025, and here there is no AI-related angle. It is historically a high-growth sector that does well in lower interest rate environments. We entered the year with political risk hanging over the sector, but this has lifted, and as rates have come down and, we suggest, as institutional investors look to rotate away from AI to other growth themes, biotech has come back into business. RTW Biotech Opportunities (RTW) +48.5%, International Biotechnology (IBT) +46.1%, and Biotech Growth (BIOG) +39.8%, have all prospered, with these returns coming since August. Macro factors have worked for biotech, but so did value: biotechnology was looking cheap entering the year, and despite the fundamentals of the sector – the science, the need for larger companies to buy out the owners of new drugs, the strength of balance sheets – looking good.
The value themes that outperformed
Perhaps so far the trusts and themes to have outperformed Nvidia are, if not expected, then unsurprising. Mining, data centres, the AI supply chain and biotech are all well-known growth themes. Spotting growth themes that had yet to respond to an improving backdrop would have seen investors fishing in these areas and benefitting. We think it is much more surprising that many of the plain vanilla UK investment trusts outperformed the sexiest stock in the world.
Temple Bar (TMPL) has delivered a share price total return of 44.8%, ahead of Fidelity Special Values (FSV) and its 35.5%. Lowland, Schroder Income Growth, Shires, Aberdeen Equity Income, CT UK High Income, City of London and JPM Claverhouse all outperformed Nvidia too. The income trusts outperformed the growth trusts and the large-cap trusts outperformed the small- and mid-caps. We think this is a good example of how recoveries in out-of-favour sectors tend to fly under the radar at first. There isn’t really anything driving the UK large-caps beyond them being extremely cheap and having incorporated a huge amount of negativity in the price. In that regard, and looking at how the AI trade broadened over 2025, we think UK small- and mid-caps are somewhere to watch. We think they could be to UK large-caps in 2026 what the miners were to gold or the data centre materials were to GPUs in 2025.
Most trusts in the Europe sectors underperformed Nvidia, but there were a couple of exceptions: JPMorgan European Growth & Income (JEGI), which was up 45.3%. JEGI aims to be a core holding, with a portfolio that mixes style exposure and delivers incremental outperformance of the benchmark. In 2025, it benefitted as its managers tilted the portfolio away from the global growth leaders and towards more domestically oriented stocks, which included building up its exposure to small- and mid-caps. JPMorgan European Discovery, run by the same house’s small-cap team also outperformed Nvidia with returns of 35.5%.
UK AND EUROPEAN OUTPERFORMERS
Association of Investment Companies (AIC) Sector
SP Return (GBP, %)
Latest Discount (Cum Fair, %)
Marwyn Value Investors
UK Smaller Companies
61.1
-47.4
JPMorgan European Growth & Income
Europe
45.3
-0.92
Temple Bar
UK Equity Income
44.8
1.1
SVM UK Emerging
UK Smaller Companies
37
-4
Fidelity Special Values
UK All Companies
35.5
-0.8
JPMorgan European Discovery Ord
European Smaller Companies
35.5
-7.67
Lowland
UK Equity Income
33.9
-9.4
Schroder Income Growth
UK Equity Income
33
-5.1
Shires Income
UK Equity Income
32.7
-3.2
Aberdeen Equity Income Trust
UK Equity Income
31.5
1.3
CT UK High Income B Share
UK Equity Income
29.3
-0.5
City of London
UK Equity Income
28.6
1.9
JPMorgan Claverhouse
UK Equity Income
28
-5.2
CT UK High Income
UK Equity Income
26.7
3.2
Nvidia Corp
26.4
Source: Morningstar, 01/01/2025 – 19/12/2025 Past performance is not a reliable indicator of future results
Another area of value to have delivered greater share price returns than Nvidia is to be found in deeply discounted trusts in the alternative assets sectors. In some cases, share price returns reflect positive operational developments and improving sentiment. Seraphim Space (SSIT) more than doubled in share price terms as the discount narrowed form over 40% to c. 5%. A lot of these gains came in December after it was announced that its largest holding, ICEYE, had signed a £1.5bn contract with German defence manufacturer Rheinmetall. ICEYE made up 34.7% of SSIT’s NAV prior to the contract win, so there is scope for a significant uplift to the NAV. Molten Ventures (GROW) has seen a re-rating as asset sales have validated the NAV, with the write-up of largest holding Revolut ahead of an IPO acting as a reminder of the potential in venture capital. Gresham House Energy Storage’s (GRID) 71% returns reflect some positive NAV progression, new projects being funded and refinancing at lower rates, as well as the resumption of dividends for the first time since Q4 2023.
In GRID’s case, the takeover of Harmony Energy Income in the summer may have raised hopes of a similar value-unlocking resolution too. In some cases, it is takeovers that have delivered the returns, with Urban Logistics REIT and Warehouse REIT both bought out at large premiums to the share price, delivering returns of 56.7% and 48.1% to shareholders respectively. Harmony Energy Income itself delivered 41.5%. There are still plenty of exceptionally wide discounts in the alternative asset space and we think it likely that consolidation and takeovers will feature again next year. This is a hard theme for the individual investor to play, and perhaps one best left to the professionals who can invest at size and engage. MIGO Opportunities Trust (MIGO) is set up precisely to find opportunities to engage to unlock value in the alternatives space, and could be one to watch in 2026.
ALTERNATIVE ASSETS OUTPERFORMERS
Association of Investment Companies (AIC) Sector
SP Return (GBP, %)
Latest Discount (Cum Fair, %)
Seraphim Space Investment Trust
Growth Capital
108.6
-5.1
Gresham House Energy Storage
Renewable Energy Infrastructure
71.1
-32.9
Urban Logistics REIT
Property – UK Logistics
56.7
-0.4
Molten Ventures
Growth Capital
55.4
-31.5
Warehouse REIT
Property – UK Logistics
48.1
-12.9
JPEL Private Equity
Private Equity
41.5
-10.2
Harmony Energy Income Trust
Renewable Energy Infrastructure
41.5
-0.3
Ecofin Global Utilities & Infra
Infrastructure Securities
41.2
-6
Schroders Capital Global Innov Trust
Growth Capital
40.9
-27.6
Petershill Partners
Growth Capital
38.6
-11.1
Downing Renewables & Infrastructure
Renewable Energy Infrastructure
37.9
-9.5
Care REIT
Property – UK Healthcare
35.3
-13.1
Premier Miton Glb Renewables Trust
Infrastructure Securities
35
-0.1
VPC Specialty Lending Investments
Debt – Direct Lending
34.5
-45.9
NB Distressed Debt New Glb
Debt – Loans & Bonds
31.5
-14.1
Chenavari Toro Income Fund
Debt – Structured Finance
31.3
-2.7
Volta Finance
Debt – Structured Finance
30.3
-7.1
Aquila Energy Efficiency Trust
Renewable Energy Infrastructure
29.1
-43.7
Nvidia Corp
26.4
Source: Morningstar, 01/01/2025 – 19/12/2025 Past performance is not a reliable indicator of future results
Conclusion
Nvidia has dominated the headlines this year. It is the largest company in the world and intimately involved in the strategic rivalry between the US and China, but we think a common trend in markets is for an aura of ‘winning’ to hang around long after market leadership has passed on, and that is the case with Nvidia. Better returns have been delivered by trusts playing themes connected to the AI trade, further down the chain. Looking for areas connected to the leading themes that had lagged in price and valuation would have led investors there. Other areas that have been deeply depressed for years also outperformed, sometimes simply because all the negativity was in the price (the UK) and sometimes because there was also a new growth factor to consider (Europe and the stimulus of defence spending). In the alternative assets space, it was a mixture of both, with corporate activity or the expectation of it another key driver.
Looking ahead to 2026, we think countries and sectors that will benefit as AI spend flows through could do better than the expensive hardware manufacturers – consumer related areas in Latin America and China could be such areas. We think the most obvious deeply depressed area due a re-rating is the FTSE 250, one of history’s great growth markets, recently trading on lower valuations than large-caps; we expect UK mid- and small-caps to do well. Meanwhile, the alternative assets space looks like it should see another year of corporate activity, while falling interest rates should be a positive. Biotechs flourished in 2025 as interest rates fell and political worries lifted. We expect rates to continue to fall, providing an impetus to many growth sectors that have been left behind as Nvidia and some connected large-caps have risen to unattractive valuations.
Sorry boys and girls it’s much more boring than Naval gazing.
The first attempt at forecasting the first quarter dividends
£3,607.00.
Do not scale to reach a year end figure as the figure includes some dividends harvested in January but it should mean the Snowball is on target to earn 10k plus in dividends, all to be re-invested.
Last year will go down as a golden 12 months for investors in listed commodities funds, but shareholders in a variety of emerging market, technology and recovery plays also have cause to celebrate.
As precious metals and copper soared to all-time highs in 2025, data from the Association of Investment Companies (AIC) shows that the seven London-listed funds in the Commodities and Natural Resources sector generated an average 61.5% share price return in 2025.
That put the group way ahead of the next best investment trust sectors of China, Global Emerging Markets, Growth Capital and Technology which returned between 30% and 39% on average.
“It’s always good to understand which sectors and trusts have done best over the short term but investment is all about the long term. Building a diversified portfolio which meets your investment needs is the priority,” AIC communications director Annabel Brodie-Smith reminded investors.
Stellar year for Watson and Crayfourd
Top of the commodities sector was Golden Prospect Precious Metals (GPM), a £93m investment company run by Keith Watson and Robert Crayfourd at Manulife Investment Management. Its shares soared 165% on the back of a huge rebound in the shares of gold miners as bullion advanced 65% in response to the geopolitical and economic uncertainty exacerbated by US tariffs.
That made GPM easily the top-performing investment company in the UK last year (see table below), 38 percentage points ahead of the next best performer with a return that was 13 times greater than the average 12% made by investment trusts in 2025.
It was a stellar year for Watson and Crayfourd as the £129m CQS Natural Resources Growth & Income (CYN) they also run more than doubled. It achieved a 102% total return to shareholders from a broader portfolio of miners to rank it fourth in our list of top 10 risers. As a result, the company is broadly the same size it was before it had to buy back nearly 46% of its shares in July as part of a tender offer to get activist hedge fund Saba Capital off its back.
Shareholders in £1.6bn BlackRock World Mining (BRWM), the UK’s largest listed commodities fund, won’t be complaining either after it recorded an impressive 74% return. As with CYN, this was fuelled by gold and an intense demand for raw materials required to support the global roll-out of infrastructure, renewable energy and artificial intelligence.
Best performers
Investment companies
Total shareholder return %
Net asset value (NAV) total return %
Premium (- discount) %
Golden Prospect Precious Metals
165
165
-18
DP Aircraft I
127
NA
-30
Seraphim Space
121
27
-0.4
CQS Natural Resources Growth & Income
102
91
2
BlackRock World Mining
74
74
-6
Gresham House Energy Storage
72
6
-32
Marwyn Value Investors
63
37
-47
Molten Ventures
58
7**
-30
Fidelity Emerging Markets
56
51
-8
RTW Biotech Opportunities
55
42
-16
Source: Association of Investment Companies and Winterflood. ** Gross portfolio return 12 months to 30 September.
Emerging recoveries
A recovery in China’s stock market and a dollar deliberately weakened by President Trump’s trade policy swung momentum back towards emerging markets. Fidelity Emerging Markets (FEML)led the rebound in its sector with a 56% shareholder return. Most of this was generated by the 51% underlying growth in its investments, with a slight narrowing in the gap between its share price and net asset value (NAV) also helping. The shares ended the year at an 8% discount below NAV.
Elsewhere, a range of funds made decisive bids for the sunny uplands after a tough few years.
Second-placed DP Aircraft 1 (DPA) flew 127% higher after re-leasing its two Boeing 787-8 planes from Thai Airways to LOT Polish Airlines. However, that marks only a partial recovery for the specialist dollar-based investment company. At 14 cents today, the shares are a fifth of their value before the 2020 Covid pandemic sent the aviation sector into a tailspin.
Seraphim Space (SSIT) provides a better view in third place. The world’s first listed space technology fund made 121% for shareholders last year. With the shares yesterday rallying with other defence-related stocks following the US overthrow of Venezuela’s president at the weekend, SSIT has now surpassed the early peak it reached shortly after launch in 2021 with shares up 37% since flotation.
It’s a similar story for RTW Biotech Opportunities (RTW) which is closing in on its 2021 peak after advancing 55% last year as shares in drug developers rallied from record lows in response to falling interest rates and an upsurge in bids and takeovers.
Gresham House Energy Storage (GRID) has more to do to recoup shareholder losses from 2023 and 2024 but the 72% share price recovery last year represents a good start for the battery fund’s three-year turnaround plan.