Investment Trust Dividends

Month: January 2026 (Page 13 of 15)

Trust Laggards 2025

Worst performers

Investment companiesTotal shareholder return %Net asset value (NAV) total return %Premium (- discount) %
Lindsell Train-14-12-21
Augmentum Fintech-15-3-43
JPMorgan US Smaller Companies-15-11-7
Greencoat UK Wind-160-30
Bluefield Solar Income-19-3-40
Ecofin US Renewables Infra ($)-34-9-50
Hydrogen Capital Growth-37-60-60
ICG-Longbow Senior Secured UK Property Debt -39-37-37-29
Aquila Euro Renewables (€)-41-27-38
Digital 9 Infrastructure-69-5-82

Source: Association of Investment Companies and Winterflood.

Turning to the 10 worst-performing investment companies last year, it’s worth noting that the bottom five are all in managed wind-down. Tired of poor, or disappointing, returns exacerbated by wide discounts, shareholders in DGI9, AERI, LBOW, HGEN and RNEW have voted for their assets to be sold and the companies liquidated.

The pressure on renewables funds is evident with half of our list of big fallers investing in forms of clean energy. High-yielding Bluefield Solar Income (BSIF) slid 19% last year and looks likely to exit the stock market with a strategic review launched in November after shareholders objected to a proposed merger with its fund manager.

Will big fallers turn the tide?

I wonder if the top three in our list of fallers could do better this year? Lindsell Train (LTI), the top decliner, fell 14% with the dividend included. Even including pay-outs, the shares are down 43% over five years which reflects the trust’s exposure to fund manager Nick Train’s previously successful, but out-of-favour investment approach, and its large stake in the fund firm he runs with Michael Lindsell that has suffered outflows and falls in assets under management. But is the doom and gloom priced in with the shares stuck on 21% discount? Certainly the stock has significantly derated from the 100% premium it stood on in 2021.

Poor sentiment continues to undermine Augmentum Fintech (AUGMwith the shares off 15% last year despite Winterflood data showing its portfolio of unquoted financial services companies proved stable, if unexciting, in 2025. Having avoided the big write-downs that have afflicted some other early-stage investors, AUGM has delivered a 34% underlying return in the past five years and yet its shares have dropped by a third to languish on a 43% discount. That valuation gap looks unsustainable. Something could happen to close it. Perhaps it’s already happening as the shares have rallied since early December when the company said £125m of its investments were effectively valued at nil by its share price.

Lastly, will JPMorgan US Smaller Companies (JUSCcatch a break in 2026 after its 15% decline last year? Donald Trump’s re-election in late 2024 prompted a value-style rally that left this former top-performing small-cap growth investor out in the cold, and badly lagging the market’s rebound since “Liberation Day” last April. With the company actively buying back shares, the discount has stayed relatively narrow at 7% so there isn’t a valuation gap to exploit as such, just a hunch that the market could swing back in its direction.

Across the pond


Contrarian Outlook


My Plan for 7.9% Dividends From the AI Boom (Hint: It Began in 1854)

by Michael Foster, Investment Strategist

The run that AI poster child NVIDIA (NVDA) has been on these last few years is truly incredible. That’s not news, of course. But what matters now is whether investors are overpaying for that growth – in both NVIDIA and AI as a whole.

NVIDIA’s Monstrous Run 
Once a chipmaker known for appealing mainly to gamers, NVIDIA started to climb in 2023, thanks to a new technology only a few people really understood at the time: generative AI.

Then, as AI spread in 2024, hopes – and NVIDIA’s stock – soared. That was followed by more fears of a bubble in AI. As with NVIDIA’s share price, a chart is the best way to do these worries justice:

The Bubble in Worries About an AI Bubble 
There’s so much discussion of an AI bubble now that we seem to be in a bubble of talking about bubbles! That’s why some advisors are saying that this AI bubble talk is a distraction. I’d agree, as we can’t even be sure this is a bubble – and I’d argue it’s not.

To see why I’m saying this, we need to look no further than NVIDIA shares. Consider this table of their performance in the last four years.


Here I’ve broken out NVDA’s per-year returns since 2022, a year in which the stock plunged alongside all of tech. Note how its biggest year was in 2023, and that its gains have been moderating since?

If this were really a bubble, you’d expect yearly gains to keep building and building until they hit a wall. That’s not the case here. In fact, I’d argue that we’re seeing a massively undervalued company becoming a fairly valued one.

To really unpack this, let’s look at how much investors are paying for NVIDIA’s earnings. We’ll do that by looking at the stock’s price-to-earnings (P/E) ratio (in purple below). As you can see, it roughly matches that of “boring” big-box retailer Costco (COST)!

Is NVIDIA Really Worth as Much as …Costco? 
I think you’ll agree that Costco, with its membership-driven revenue, is a pretty reliable revenue generator. This shows that investors are starting to see NVIDIA the same way.

Note also that NVIDIA’s P/E ratio trailed that of Costco for most of 2025.

In other words, this is not a bubbly valuation. And in fact, none of the “Magnificent 7” stocks sport higher valuations than Costco right now. That is, except for Tesla (TSLA), which in many ways lives in its own little world.

To be sure, some aspects of the AI space do look bubbly, like the 700 seed-stage rounds that attracted $10 million or more in 2025. This shows that venture capitalists are indeed making some outrageous bets here.

But that’s not a sign of a bubble. In fact, I heard the same worries about VC over investment in the early 2010s (if you don’t remember Juicero, it was a great example of VC silliness), when I worked on Wall Street. The market powered higher anyway.

But what about all the infrastructure investments we hear about, especially around data centers? One report says we saw about a 30% growth rate in data-center spending in the middle of 2025, to about $40 billion on an annualized basis, and the Fed estimates about $41.2 billion. But both sources also cite rapid growth in building back in 2023 and 2024, so the 2025 rate actually moderated compared to 2024.

If we look at total private construction of non-residential properties, as provided by the Census Bureau, a similar story appears.

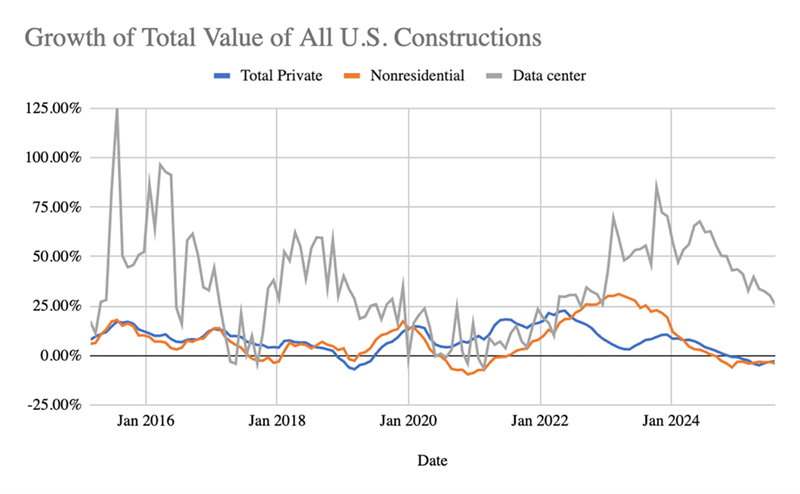
 Source: US Census Bureau, CEF Insider
Here we can see spending growth on data-center construction (gray line) far outpacing all non residential spending (orange line) and overall private-sector spending (blue) in late 2023 and 2024. That was actually the case in the late 2010s, as well.

In fact, data-center spending looks like it’s simply going back to where it was pre-pandemic. It’s also worth noting that the growth rate has been slowing since peaking in late 2023, much like NVIDIA’s stock-price growth has been moderating since then, too. In other words, this is clearly not a bubble – if anything, the bubbly numbers looked most alarming in late 2023.

How I’m Playing the AI “Non-Bubble”

So what’s the best approach for us here?

For one, the data says this market is not acting irrationally. On the contrary, valuations suggest a mature market, and our best play is to remain fully invested and diversified.

Most people would go with an index fund like the SPDR S&P 500 ETF (SPY) in a situation like this. But we want dividends, and SPY’s sad 1% yield just won’t cut it.

In this market, while we wait for AI to continue its spread through the US economy, getting a big slice of our return in cash dividends is key. That’s why we prefer a closed-end fund (CEF) like the Adams Diversified Equity Fund (ADX), a long-time holding of my CEF Insider service.

ADX is a proven long-term wealth generator, both in the form of dividends and capital gains. Since we bought the 7.9%-yielding fund in July 2017, it’s returned 243% in gains and dividends, as of this writing, soundly beating the S&P 500.

“Dividend-Powered” ADX Beats the Market in the Long Term … 
That’s thanks to management’s stock-picking skills (ADX holds NVIDIA, along with many other top S&P 500 stocks). Their acumen stems from ADX’s long institutional memory: The fund traces its roots back to 1854 – yes, the mid-nineteenth century.

And then there’s that income stream, responsible for a big slice of the fund’s total return: ADX’s 7.9% yield is roughly seven times that of the typical S&P 500 stock (note that ADX’s payouts do flex somewhat, based on its portfolio performance).

The odd thing about CEFs like ADX is that when investors judge their performance, they tend to only look at price returns, not total returns (including dividends), as we discussed last week. And on a price basis, ADX returned 15.5% in 2025, just less than the 16.4% of an S&P 500 index fund. But add reinvested dividends and you’ll see that ADX (in purple below) easily beat the market.

… And the Short Term, Too 
CEFs like ADX are nicely set to keep outrunning a rising stock market. Anyone who’s letting bubble fears keep them out of the market (and this great fund) are missing out – on both the income and the capital gains side.

The Snowball

The portfolio is called the Snowball because as a snowball rolls down a hill it gathers more and more snow and grows bigger until it stops rolling.

Or your Snowball, which should be different to the blog portfolio, the yield will grow as you buy more shares with the earned dividends, until you want to spend the same dividends, either when you retire or if you need to boost your income.

2026 Income £943.00

Watch List

The Boards of Aberdeen Equity Income Trust plc (“AEI“) and Shires Income PLC (“SHRS)”) are pleased to announce that heads of terms have been agreed for a combination of AEI and SHRS (the “Combination“), bringing together two successful in

The combined yield will most probably fall and the Trust will leave the Watch List.

SUPR

SUPERMARKET INCOME REIT PLC

DIVIDEND DECLARATION


Supermarket Income REIT plc (LSE: SUPR, JSE: SRI) has today declared an interim dividend in respect of the period from 1 October 2025 to 31 December 2025 of 1.545 pence per ordinary share (the “Second Quarterly Dividend”).

The Second Quarterly Dividend will be paid on or around 27 February 2026 as a Property Income Distribution (“PID”) in respect of the Company’s tax-exempt property rental business to shareholders on the register as at 30 January 2026. The ex-dividend date will be 29 January 2026.

Please note that there is no scrip dividend alternative available for the Second Quarterly Dividend and it will be paid in full as cash. The Board will keep under consideration the offer of a scrip dividend alternative in respect of future quarterly dividends.

Compound Interest

The National Fund itself dates back to 1927, when an anonymous donor gave around £500,000 in cash and investments.

The Debt Management Office has confirmed it will cancel £607.4 million of government debt on January 9, 2026, using money from the National Fund.

The debt being cancelled takes the form of a government bond, known as a gilt, which pays an interest rate of four per cent and was originally due to mature on January 29, 2027.

Unlike most government bonds, this gilt is not held by private investors.

Instead, it sits in the Donations and Bequests Account, a state-run account that holds money donated specifically to help reduce the national debt.

That account is overseen by the Commissioners for the Reduction of the National Debt, a long-standing institution responsible for managing such funds.

SUPR Belt and Braces

If your view is that UK unemployment is to continue to rise, the bank rate will be further reduced.

SUPR is no longer an Investment Trust but is still a

Real Estate Investment Trust
REIT stands for Real Estate Investment Trust. It is a company that owns, operates, or finances income-producing real estate across various property types, providing investors with regular income streams and diversification.

Confusing yes ? They still have to pay out 90% of taxable income as a dividend but no longer have to publish a NAV.

The current published Fair Nav is 89.25p and the share price is currently 82p, which has proved to be resistance and the yield is 7.5%.

If your view is that interest rates will fall and therefore the return on money market accounts etc., will also fall the gap between the two will widen.

This might be the incentive for people to buy one of the safest yields in the market, although no yield is 100% secure and the gap between the price and the Fair Nav will close.

It could close if the NAV falls but that is the glory of investing.

Remember SUPR have never ever failed to collect their rent on the due date.

SUPRdividendisfantasticthesharpriceisatrocious.

If you buy a 10k position with a share yielding 7% and re-invest those dividends at 7%, in ten years time you will be receiving a yield of around 14% on your position, not dependant on Mr. Market.
If the price of the share rises and the yield falls, you may have to take your profit and switch horses.

SUPR

Your starting position
– 13,000 shares cost 10k
– Purchase date: 20 July 2023
Initial yield 7.5%
The price fell after the starting position which meant you bought more shares for your money and therefore more dividends.

🟩 FINAL RESULT — Your total SUPR shares today

🎯 Summary

– Starting shares: 13,000
– Dividends received: £1,779.3
– Reinvested at actual prices on xd date
– New shares added: ≈2,327
– Total today: ≈15,327 shares

15327 shares x fcast dividend 6.12p = £938.01 a yield on seed capital of 9.38%

All figures subjective to the price you could have dealt at on the xd date.

If you were lucky with you timing, the share including dividends is up 27% over a year, so not so shabby.

This 13.4% Dividend Pays the Bills in Any Market

Brett Owens, Chief Investment Strategist

Here’s one thing I can say for sure about 2026: This year, we’ll be grateful we’re NOT sitting on “America’s ticker”—my name for the SPDR S&P 500 ETF Trust (SPY).

I call SPY that because pretty well everyone owns it. But its 1% yield makes it more likely that holders will be forced to sell low in the next pullback, if they’re leaning on it to pay the bills.

Not us! We’ll be pocketing the 8%+ cash payouts from the portfolio of my Contrarian Income Report service. So while SPY holders face the next pullback with dread, we’ll be chugging along with our usual “dividends and chill” approach.

When a storm hits, we simply wait for our next big dividend payment to roll in. (And we don’t have to wait long—many of our divvies are paid monthly.)

Today I want to zero in on one attractive 13.4% (!) payer from our portfolio. Then I’ll show you a smart, simple way to forecast that massive dividend (and indeed any payout) with ease.

This 13.4% Payer Loves This “Bearish” Bull Market 

We love FS Credit Opportunities (FSCO) for a lot of reasons, but its sky-high—and growing—dividend is right up there. FSCO yields a mammoth 13.4% today (more on that in a second).

Small businesses—the main drivers of US economic growth—love BDCs, too, because they loan money to these firms. BDCs are a godsend for these mom-and-pop shops, who often struggle to get the capital they need from stingy banks.

Most BDC managers sit in their cozy offices, wait for a private-equity sponsor to call, then write a check for a safe but low-paying loan.

Not FSCO. Portfolio manager Andrew Beckman buys distressed loans for dimes—even pennies—on the dollar. His chops in this arena drive the stock’s growing 13.4% payout.

FSCO: A True Dividend “Unicorn”


Source: Income Calendar

Beckman is the industry’s “credit surgeon.” Forget the safe loan! He wants the patient who’s bleeding out on the table because he can stitch them up—and charge a fortune for doing so.

Before FSCO, he spent the core of his career at Goldman Sachs (GS), in their legendary Special Situations Group. These “credit commandos” thrived buying depressed assets in the 2008/2009 crisis.

FSCO is a BDC in a closed-end fund (CEF) wrapper. As a CEF, it can (and does!) trade at different levels in relation to its value. Today, it trades at a 14.7% discount to NAV because slower jobs numbers are sparking recession worries. That means we’re getting FSCO’s expertly run loan portfolio for just 85 cents on the dollar.

Yes, hiring is slow, but that’s because companies are implementing AI to boost efficiency. And small businesses are the No. 1 users of this tech.

Meantime, the Atlanta Fed’s GDPNow estimate shows that the US economy is still solidly in growth mode: a strong 3.5% rate, to be exact.

The disconnect between investors’ mood and strong growth is our opening to grab FSCO, and its 13.4% payout, at a bargain.

Buy FSCO, Then Do This to Forecast Your Dividends for Years

High, and rising, dividends like this one really are unicorns, and I see a diversified portfolio of them as a far better option than ETFs like SPY.

But the key to getting peace of mind (and dodging the urge to sell when markets fall out of bed) is knowing exactly when your next payout is coming. Truth is, there aren’t many tools out there that do this. And even fewer that do it well.

« Older posts Newer posts »

© 2026 Passive Income Live

Theme by Anders NorenUp ↑