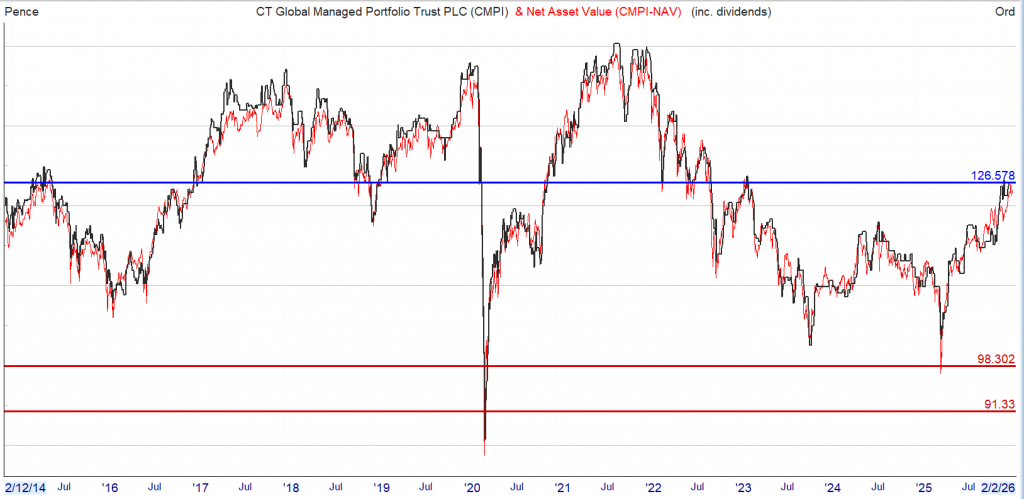
As you can see from the chart, there is a risk to capital but as the intention is never to sell as you need the dividend to pay your bills, it matters not, to you anyway.
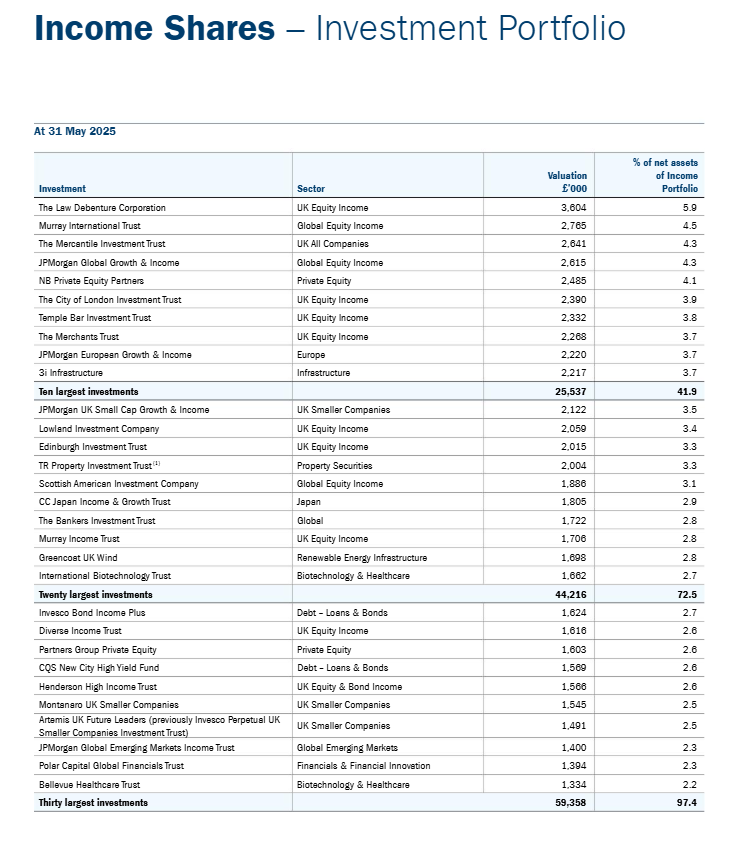
The risk is spread over most of the IT income generating shares so the dividend is fairly ‘secure’.
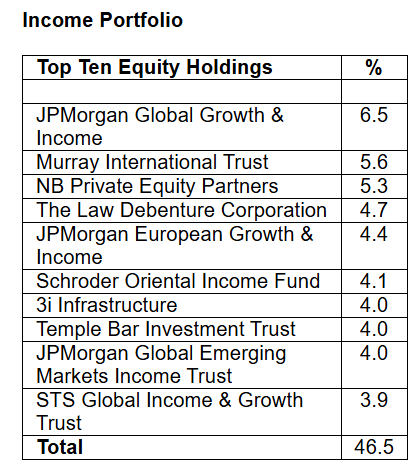
Latest top ten holdings.
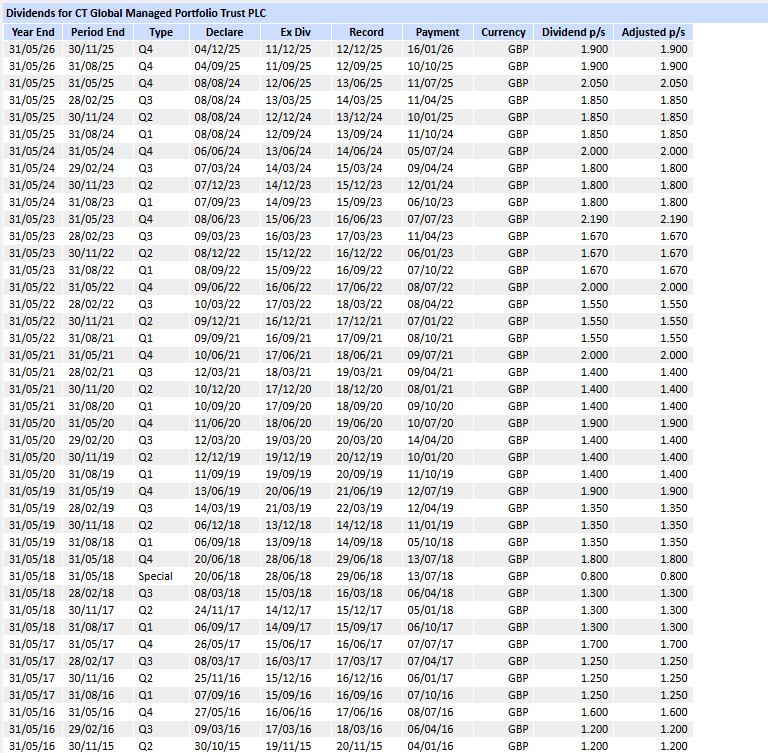
The dividend fcast is 7.6p
CT Global Managed Portfolio Trust PLC (the “Company”) announces a second interim dividend in respect of the financial year to 31 May 2026 of 1.90 pence per Income share.
This dividend is payable on 16 January 2026 to shareholders on the register on 12 December 2025, with an ex-dividend date of 11 December 2025.
The normal pattern for the Company is to pay four quarterly interim dividends per financial year.
As previously announced, in the absence of unforeseen circumstances, it is the Board’s intention to pay four quarterly interim dividends, each of at least 1.90 pence per Income share, so that the aggregate dividends for the financial year to 31 May 2026 will be at least 7.60 pence per Income share (2025: 7.60 pence per Income share).
Anyone who bought at 100p are now receiving a yield of 7.6%
Investor Presentation via Investor Meet Company
CT Global Managed Portfolio Trust PLC (the ‘Company’) is pleased to announce that Adam Norris and Paul Green, Fund Managers, will provide a live presentation which will look back on 2025 and then update investors on both the Income Portfolio and Growth Portfolio going into 2026 via the Investor Meet Company platform on Wednesday 4 February 2026 at 10:00 am GMT.
The presentation is open to all existing and potential shareholders. Questions can be submitted pre-event via your Investor Meet Company dashboard up until 9:00 am GMT on Tuesday 3 February 2026 or at any time during the live presentation.
Investors can sign up to Investor Meet Company for free and add to meet CT Global Managed Portfolio Trust PLC via:
Five Reasons Why Investors are Rediscovering Dividend Stocks
15 January 2026
Martijn Rozemuller CEO – Europe
Amid all of the attention given to AI and the big US tech stocks, the fact that some investors have been quietly rediscovering high dividend stocks is less appreciated. They’re going back to basics, favoring big companies that pay high dividends year after year, providing investors with income that can be reinvested for capital gains.
The question, though, is why did investors flock to high dividend stocks during the year and what does it say about their views on equity markets in 2026 ? In my opinion, dividend stock investing has five main attractions.
Performance History – VanEck Morningstar Developed Markets Dividend Leaders UCITS ETF
2021
2022
2023
2024
2025
ETF
26.94
15.77
11.76
16.00
23.78
MSDMDLGE (Index)
27.24
16.58
12.56
16.71
24.72
Source: VanEck. Past performance does not predict future results. Calendar year as of December 31st, 2025.
1. Dividend Payers Tend to Be More Resilient In uncertain times, the solidity of big companies paying high dividends is more appealing than ever. They have profits backed by strong cash-flows that underpin dividends, even through moderate economic downturns. Their commitment to maintaining, or even growing, annual dividend payments makes them disciplined about the internal projects they spend capital on. These strong fundamentals help explain why dividend strategies can perform comparatively well in both rising and volatile markets, although this is not assured. 2025 illustrated this well, with the TDIV ETF proving less volatile than world markets, represented by the MSCI World Index, following the announcement of US tariffs in April 2025 (see chart). It is worth noting that every situation is unique and past performance does not predict future returns.
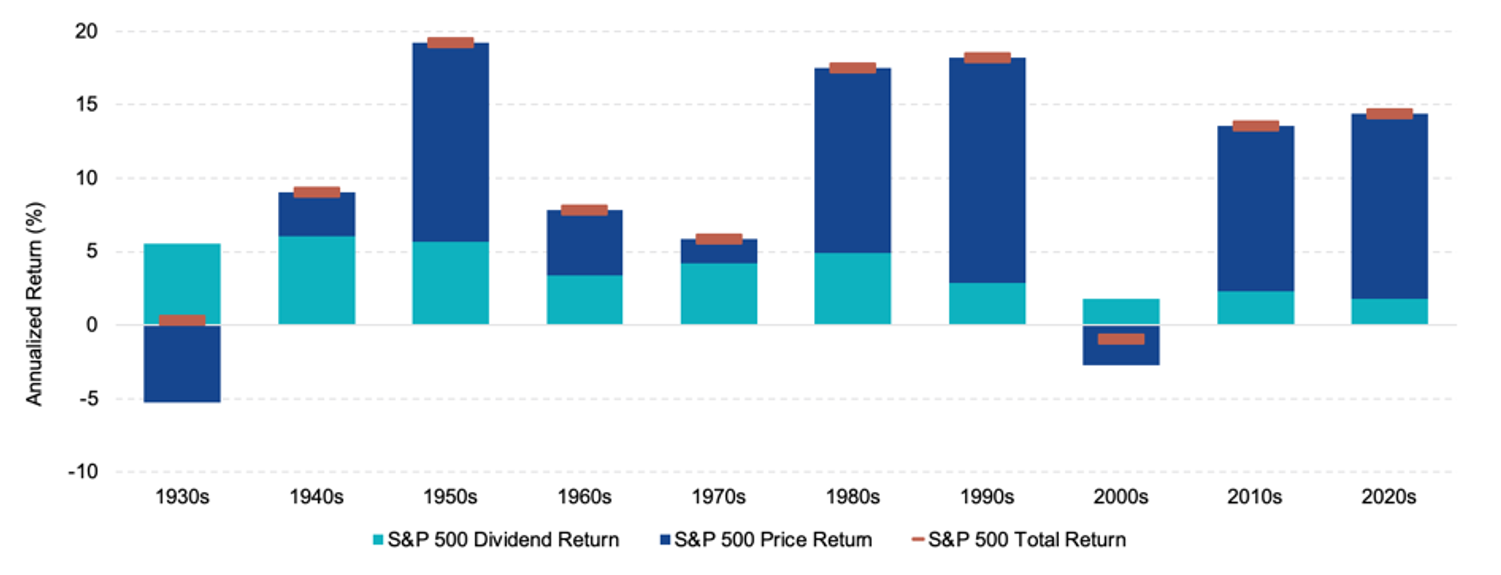
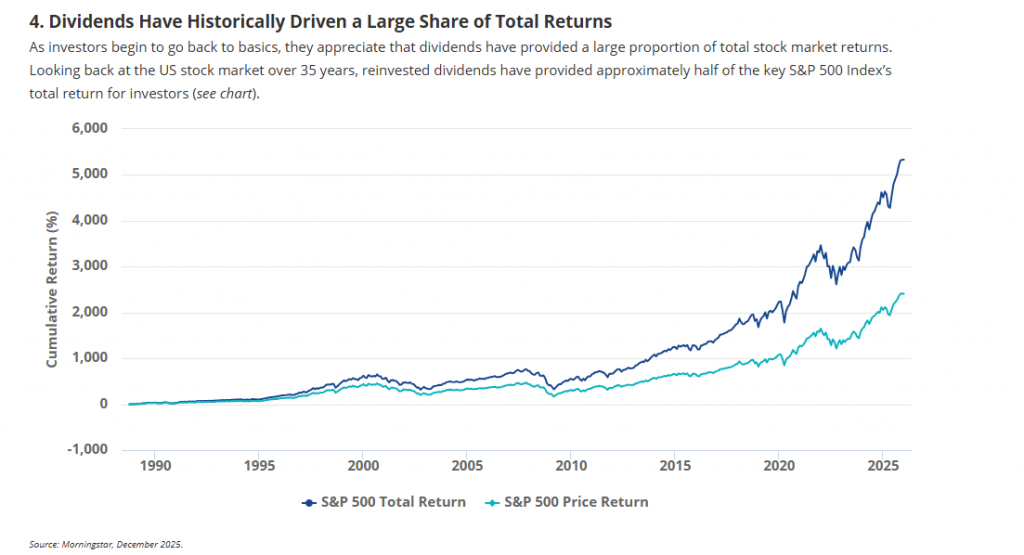
2. Dividends Help Manage Volatility Without Leaving Equities For investors who are nervous about the outlook but do not want to sell, dividend stocks may be the answer. As 2025 shows, they can provide resilience in volatile markets. Our research indicates that dividends have underpinned stock returns over the past 80 years, especially when inflation has spiked higher as it did in the 1940s and 1970s (see chart).
Dividends Are Key In Periods of Muted Returns | Dividend Contribution to S&P 500 Total Return / 1/1/1930 – 30/06/2025
Source: Morningstar, June 2025.
3. Higher-for-Longer Rates Have Changed Investor Priorities After years of low interest rates when investors prized ‘growth at any price’, they once again value cash returns. In the 2010s, exceptionally low rates around zero encouraged investors to put a premium on growth companies in sectors like technology that offered the prospect of high future earnings growth. But with European Central Bank short-term interest rates around 2%, some investors now prefer the tangible returns of high dividends. Even if rates do fall somewhat from here, it appears that investor expectations have shifted.
5. Stability in an AI-Driven Market Lastly, dividend stocks offer the likelihood of greater stability at a time when some investors are nervous that AI stocks might be in a bubble. If for any reason that bubble should burst, the type of well-known stocks in a high dividend ETF are backed by well known, solid companies that have stood the test of time. For instance, the top 10 holdings in our TDIV ETF are large well-known companies from a variety of sectors such as Exxon Mobil, Nestle and Roche (see below).
Top 10 Holdings (%) as of 31 Dec 2025
Total Holdings : 100
HOLDING NAME
Ticker
Shares
Market Value (EUR)
% of Net Assets
EXXON MOBIL CORP
XOM US
2,344,575
240,236,730
5.03
VERIZON COMMUNICATIONS INC
VZ US
6,008,577
208,377,734
4.36
NESTLE SA
NESN SW
2,175,450
184,097,351
3.85
PFIZER INC
PFE US
8,176,829
173,360,253
3.63
ROCHE HOLDING AG
ROG SW
458,275
161,647,043
3.38
SHELL PLC
SHEL LN
4,850,408
152,206,223
3.18
TOTALENERGIES SE
TTE FP
2,503,659
139,178,404
2.91
PEPSICO INC
PEP US
1,128,960
137,960,974
2.89
ALLIANZ SE
ALV GR
347,254
135,602,687
2.84
NOVO NORDISK A/S
NOVOB DC
2,670,969
116,311,223
2.43
Top 10 Total (%)
34.49
These are not recommendations to buy or to sell any security. Securities and holdings may vary.Due to certain corporate actions, the holdings may contain shares with a very small weighting. In addition, more shares may be included in the portfolio than in the normal composition. During the review, these shares normally fall from the index.
Source: VanEck, December 2025.
Key risks to consider alongside these five attractions:
Although dividend stocks may appear attractive for their perceived resilience and income potential, dividends are never assured and can be reduced or suspended, while share prices can still decline significantly. A high-dividend approach may also underperform broader equity markets – particularly during growth-led rallies – and may entail greater exposure to certain sectors or countries, which can amplify the impact of sector- or region-specific setbacks. Returns can be further influenced by currency fluctuations and changes in interest rates. As with any ETF, investors should also take into account product-specific risks, including tracking difference.
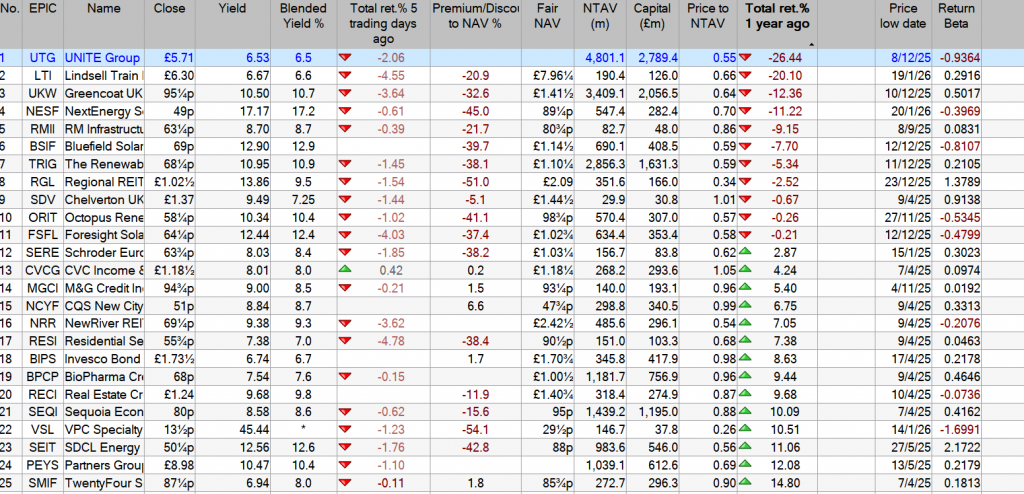
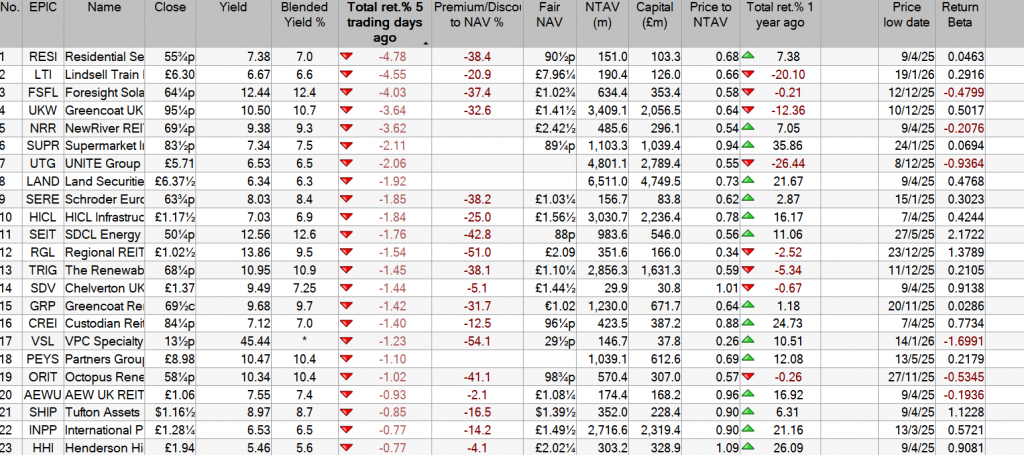
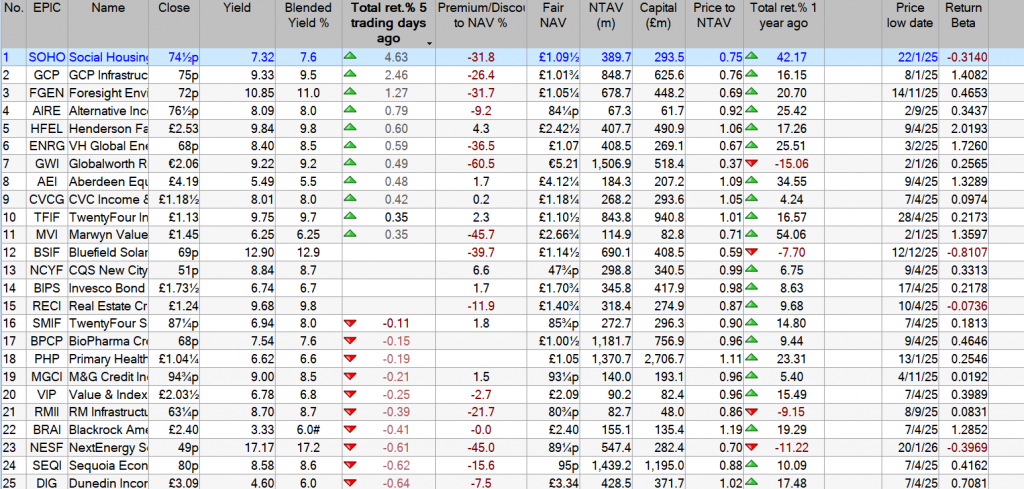
The above are the underperformers from the Watch List, so there may be a higher risk/reward if you trade any of them. Of course there may be some clunkers hiding in the Watch List, so care needed.
The shares trading at a premium, haven’t underperformed but traded exactly how you hoped they would, if they were in your Snowball.
Remember if any of the losers are in your Snowball, you have still earned income to be re-invested back into your Snowball.
Remember, it’s your duty to check the dividend announcements for the share in your Snowball.
You’re reading a free article with opinions that may differ from The Motley Fool’s Premium Investing Services.
What’s the best passive income idea ? Depending on who you ask, you may well get a lot of different answers. Personally, one of the passive income ideas I like (and use) is investing in the stock market. Specifically, that involves buying shares in proven blue-chip businesses I hope can pay me dividends.
That can earn a lot of passive income, or just a little. It can also require a lot of cash for investing, or just a little. In other words, this flexible approach that can be tailor made for someone’s financial situation and passive income goals.
How shares generate passive income
Not all shares pay dividends and they can be cancelled at any time. So it is important to understand the mechanics of how this approach works.
The amount an investor earns depends on how much they put into shares and at what average dividend yield. Yield is basically the amount of dividends they should earn in a year, expressed as a percentage of what they pay for the shares.
So for example, a yield of 5% means an investor putting £100 into the stock market ought to earn £5 of dividends a year.
Where does the money for dividends come from? A company needs to generate enough spare cash and then can decide whether to pay dividends, or use such cash for something else.
So when on the hunt for shares to buy, I look at a company’s business model and balance sheet. I then try to assess how likely it is to pay dividends in the years to come.
Targeting a specific income
I explained dividend yield above. Say someone wants to target £50 a day of passive income from dividends. That is £18,250 a year.
To keep things simple for explanation, imagine a 10% yield. That would require investing £182,500 in the stock market to hit that target.
However, I do not see 10% as a realistic target for blue-chip shares in today’s market, when the FTSE 100 yields 2.9%. But I do think a 6% goal is credible. That would require investing around £304k in the market. That could be done in one fell swoop (which is unlikely for most of us) or through regular contributions — even small ones — building up over time.
With less money, the same plan could still work, but it would generate less passive income.
One income share I think investors should consider at the moment is asset manager M&G (LSE: MNG), with a 6.6% dividend yield. The company aims to grow its dividend per share each year (something known as a progressive dividend policy) and in recent years it has done that.
Demand for asset management is high and likely to stay so over the long term. I reckon that with its strong brand, international reach and customer base in the millions, M&G has some serious ongoing cash generation potential.
One risk is that choppy markets could lead policyholders to pull out funds. In recent years, the firm has sometimes struggled with the challenge of clients pulling more money out than they put in to its funds.
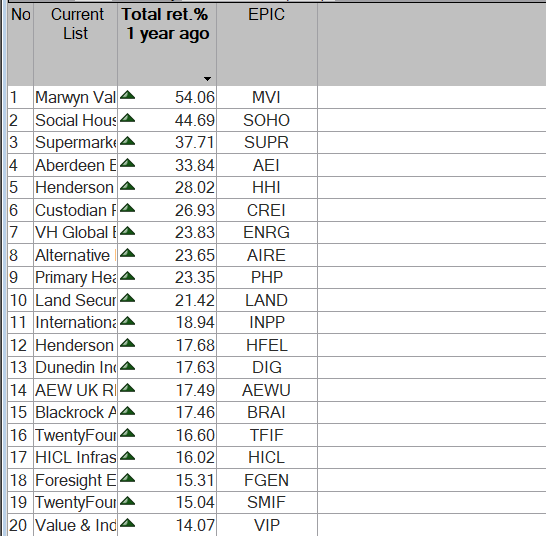
I hope you had one or two. Past performance is no indication of future performance. One thing is certain that for e.g. SUPR will not make 37% this year and it could be challenging to make 10%.
Bluefield Solar (LON: BSIF), the London listed UK income fund focused primarily on acquiring and managing solar energy assets, is pleased to confirm that following the first stage of National Energy System Operator’s (‘NESO’) grid reform process, the Company received Gate 2, Phase 1 offers on c. 660MW of its development pipeline.
NESO’s grid reform process is a major overhaul of how energy projects connect to Britain’s electricity grid, designed to clear a huge backlog, prioritise ‘ready to go’ projects, and align the system with the UK’s Clean Power 2030 goals. It replaces the old first come – first served queue with a readiness and strategic alignment based system, removes stalled projects, and introduces a new process to accelerate delivery.
Receipt of a Gate 2, Phase 1 offer means that projects have had their connection date confirmed as being between 2026-2030 and so have attained a highly protected status in the queue of projects to be connected to the grid. The technology split across the Gate 2, Phase 1 offers for the Company’s development pipeline is c. 540MW solar PV and c.120MW BESS.
Bluefield Solar is also pleased to confirm that it has received Gate 2, Phase 2 offers on c. 560MW of its development pipeline, split between c. 185MW PV and c. 370MW BESS. Receipt of a Phase 2 offer means projects have been allocated a grid connection date between 2031-2035.
This means of the Company’s c. 1.34GW pipeline, over 90% has received Gate 2 offers. The remaining 9% of the pipeline that was allocated Gate 1 offers corresponds to 125MW BESS. Projects allocated Gate 1 offers will need to re-apply for new grid offers to re-enter the grid queue, upon which connection dates offered will depend on application of NESO’s strategic alignment criteria. The Company is also able to confirm that projects which have been allocated Gate 1 offers have not been allocated any value within the Company’s NAV to date.
The success of the grid reform process is testament to the strategy designed and implemented by the Investment Adviser in 2020 and has resulted in the Company having a highly valuable pipeline.
Update on Formal Sale Process
The Strategic Review and Formal Sale Process announced by the Company on 5 November 2025 continues in line with the Board’s expectations. The Company will provide a further update when it issues its interim results in early March 2026 unless there are any material developments in the meantime.
My Market Forecast for 2026 (and a “17%-Off” Dividend to Play It)
by Michael Foster, Investment Strategist
I’m a contrarian at heart – but sometimes even contrarians have to go along with the mainstream opinion.
This (as much as it pains me!) is one of those times. You see, like most of the pundits out there, I expect another strong year for stocks in 2026. I see a roughly 12% gain for the S&P 500 this year, to be exact.
That bothers me. A lot.
I know that four strong years in a row is rare, indeed. But that’s what the data is telling me, and I’m not going to argue with it.
Still Plenty of Cheap CEF Dividends Out There – Even in This “Pricey” Market
Now this doesn’t mean there’s a lack of bargains waiting for us in our favorite income plays: 8%+ closed-end funds (CEFs). Far from it!
The beauty of CEFs is that there are always some of these funds trading at unjustified discounts to net asset value (NAV, or the value of their underlying portfolios).
At times like this, I look for CEFs with deep discounts and strong returns. We love “disconnects” like that because they give us a clear way to ride the stock market’s momentum without buying in at nosebleed levels.
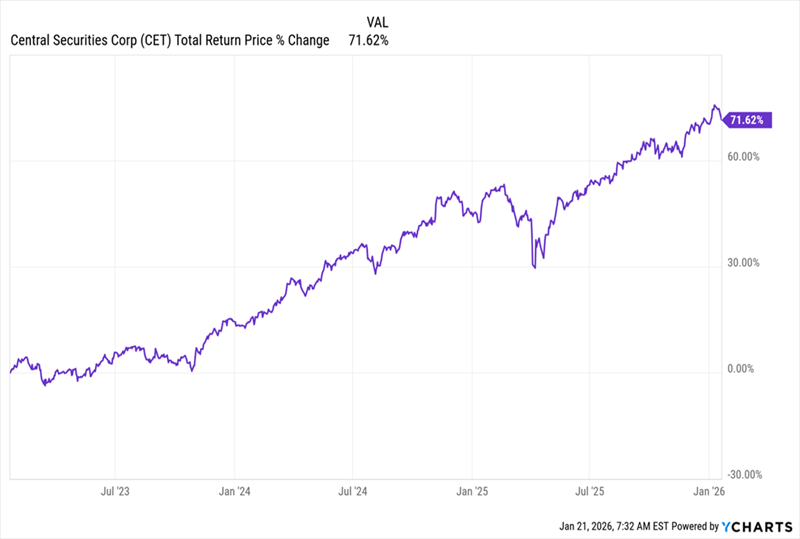
A CEF like the Central Securities Corporation (CET) is a good example. It trades at a 17% discount (so for 83 cents on the dollar, in other words!) while focusing on high-quality public firms with big margins and strong cash flows: Alphabet (GOOGL), Progressive Corp. (PGR) and Amazon (AMZN) are its top stock positions.
That makes it a great way to ride another strong market year while gleaning a 5.3% dividend that grows with the fund’s portfolio returns, as management pledges to pay “substantially all net investment income and realized capital gains” as dividends.
But let’s back up for a second, because we need to talk about the data behind my bullish call here, before we get too far into this smartly run fund.
Real-Time Indicator Says Something Shocking
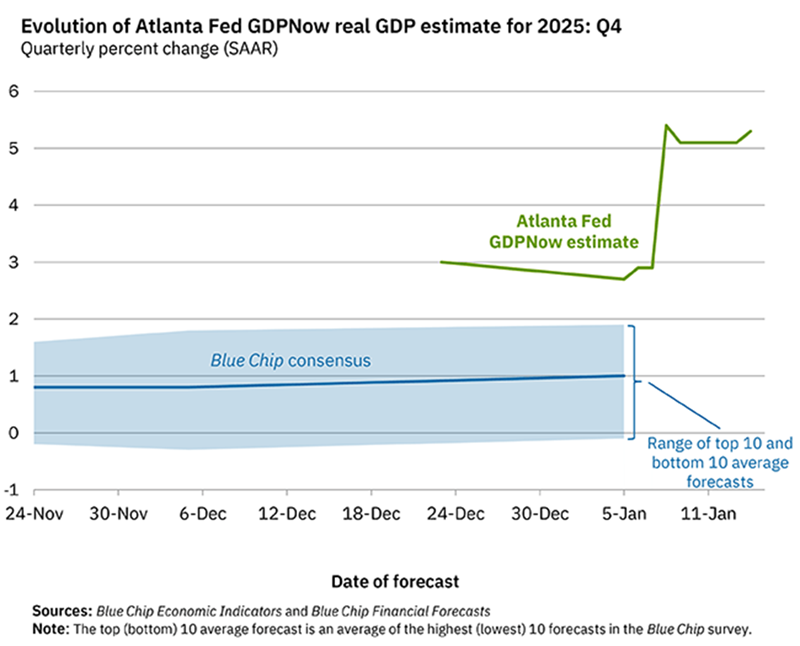
One of the most eye-catching things I’ve seen lately is the Atlanta Fed’s GDPNow indicator, the most up-to-date measure of economic growth we have.
As of now, it’s pointing to an incredible 5% gain in GDP in the last quarter of 2025. That’s far ahead of the roughly 1% growth most economists are calling for.
Now, that 5% call may end up being way too bullish (and, indeed, I expect it to). But the key point is that expectations for growth are strong, driven mainly by big companies investing for the future (yes, AI investment is playing a role here).
More spending on big projects means more money going to other firms and to workers, who then spend in the economy. This, in fact, might explain why our worst economic indicator is suddenly turning around.
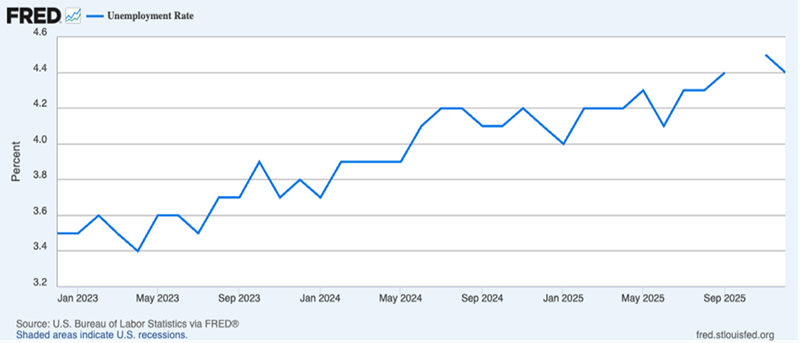
The labor market is the economy’s weak spot now, with unemployment rising since the start of 2023. Note, however, that stocks have soared since, with about a 78% gain in just three years. So this by itself isn’t necessarily bad for the market.
Moreover, as you can see above, the unemployment rate, which peaked at the end of 2025, looks like it’s beginning to fall (the gap in the chart above is due to a lack of jobs data during the government shutdown).
A small move like that does not signify a trend, so let’s look at a couple other labor measures to see if we can get a more complete picture.
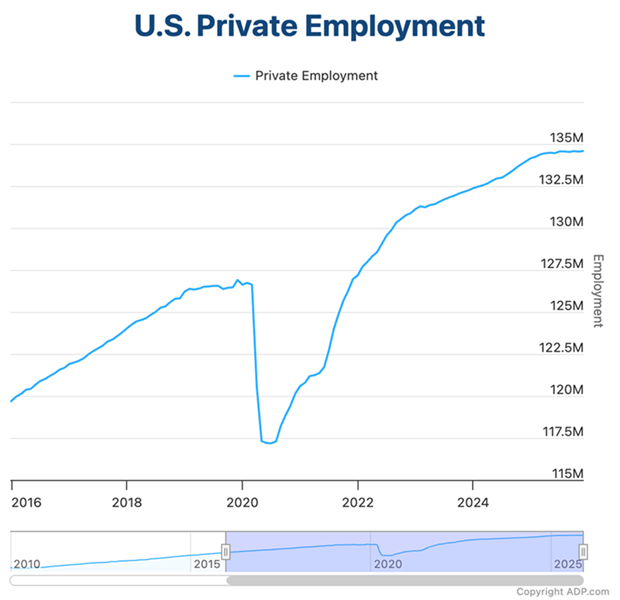
Here we see the total number of people in private employment in the US, according to ADP. Before the pandemic, that was about 126.6 million people, or 38.2% of the population. Afterward, that rose to 134.6 million, or 39.6% of the population.
This data is also a bit noisy, though, and it doesn’t show government-employee numbers. Fortunately, we do have more reliable data on that front.
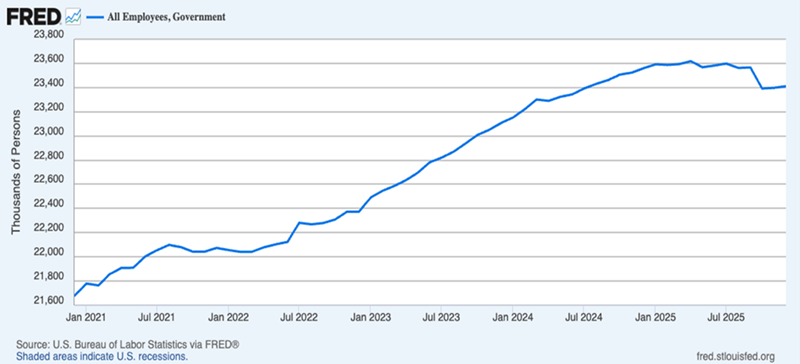
It’s true that the total number of government employees peaked in mid 2025, but the decline since has been small and had fully transpired by October 2025, when the shutdown and DOGE layoffs took effect. Since then, Uncle Sam’s workforce has started to grow again.
Put together, we see that both public and private labor markets are showing no alarming signs – and these are the biggest risks to the economy in 2026.
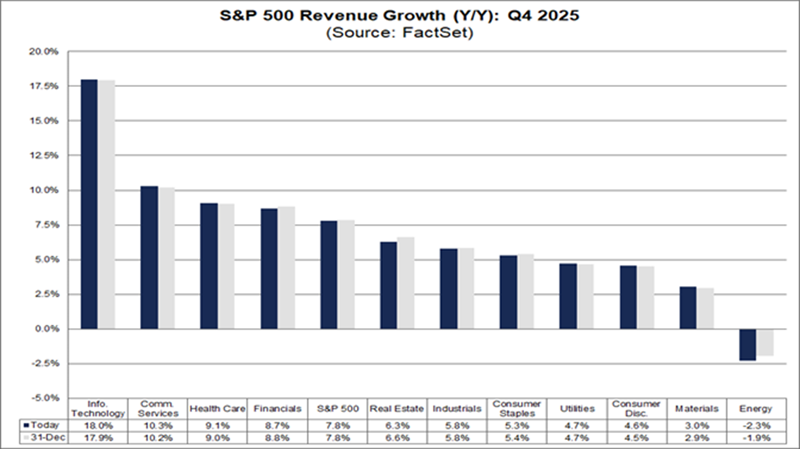
To be sure, things could (and likely will at some points) get upset by unpredictable shocks. But there is one predictable shock that could upset stocks: earnings.
So far, earnings have been okay, but what’s really key is sales, which rose 7.8% across S&P 500 companies in the fourth quarter. That, again, is a sign the economy is doing well.
This brings me back to CET, which has delivered a solid return over the last three years, as markets moved away from the aftereffects of the pandemic and looked more toward the future, including productivity gains from AI.
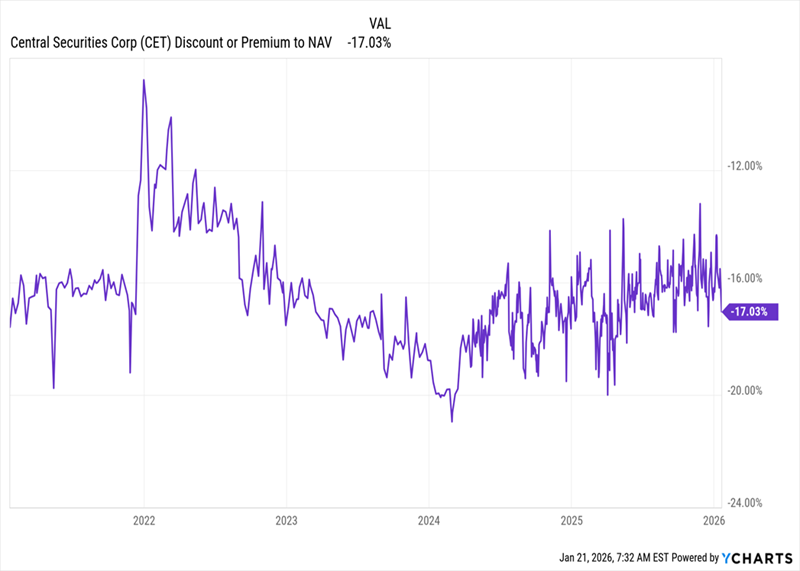
CET’s Solid Gains At the same time, CET’s discount to NAV has been unusually generous, although that discount has been fading (in its usual up-and-down fashion) since bottoming out at over 20% about two years ago.
CET’s Big Discount Begins to Evaporate That’s the discount setup I hinted at off the top: a markdown that’s wide now, and has momentum as it moves back toward par.
That sets up the fund to rise with the market in 2026, and to grab an extra bounce from its closing discount. Moreover, we can look forward to dividend growth as management “translates” its portfolio gains into payouts (those payouts typically come as a smaller dividend paid in June and a larger one in December).
And with all signs pointing to another strong market year in 2026, that’s a very sweet setup for anyone looking for income and growth.