Feb. 11, 2026
High Yield Investor
Investing Group Leader
Summary
- Three historically reliable signals are flashing at the same time – and that rarely ends well.
- The bullish narrative may be masking deeper structural cracks beneath the surface.
- Here’s how I’m positioning before the next potential market reset unfolds.
- Looking for a portfolio of ideas like this one? Members of High Yield Investor get exclusive access to our subscriber-only portfolios. Learn More »
While the S&P 500 (SPY) and NASDAQ (QQQ) have been on tremendous bull runs since 2023, there are three historically reliable warning signs emerging simultaneously that indicate that the market could be due for a significant correction in the near future. While I am not a market timer and I’m not predicting a correction in the near term, I do think it is important that investors, especially more risk-averse ones, keep these risks in mind and monitor them closely as they build their portfolios today. In this article, I will detail these and share how I am positioning my portfolio in the current environment.
The S&P 500’s Most Dangerous Valuation Setup In Decades
The first warning sign is that valuations and equity exposure are at stretched levels. In fact, the S&P 500 has gotten so overvalued that Howard Marks recently pointed out that J.P. Morgan research reveals that whenever the S&P 500 has reached its current valuation level, the next decade has always yielded real annualized total returns of around 0%. Additionally, there are numerous other metrics that indicate the S&P 500 is significantly overvalued right now.
Margin Debt At Extreme Levels: A Classic Late-Cycle Warning
Not only that, but the positioning of market participants is also indicating a very bullish, if not complacent, market sentiment. For example, household allocation to equities has reached near-record levels, and this has typically indicated that the market is late in a bull-run cycle. This makes sense simply because, from a mechanical perspective, the more people in the market, the greater the number that could be pulling out, or at the very least withdrawing their positions relative to new entrants and new additions being made. Not only that, but margin debt is at elevated levels. This typically indicates that investors are feeling too optimistic about the market and, should sentiment turn, could lead to an outsized downturn as investors flee to safety by closing margin positions, leading to outsized selling.
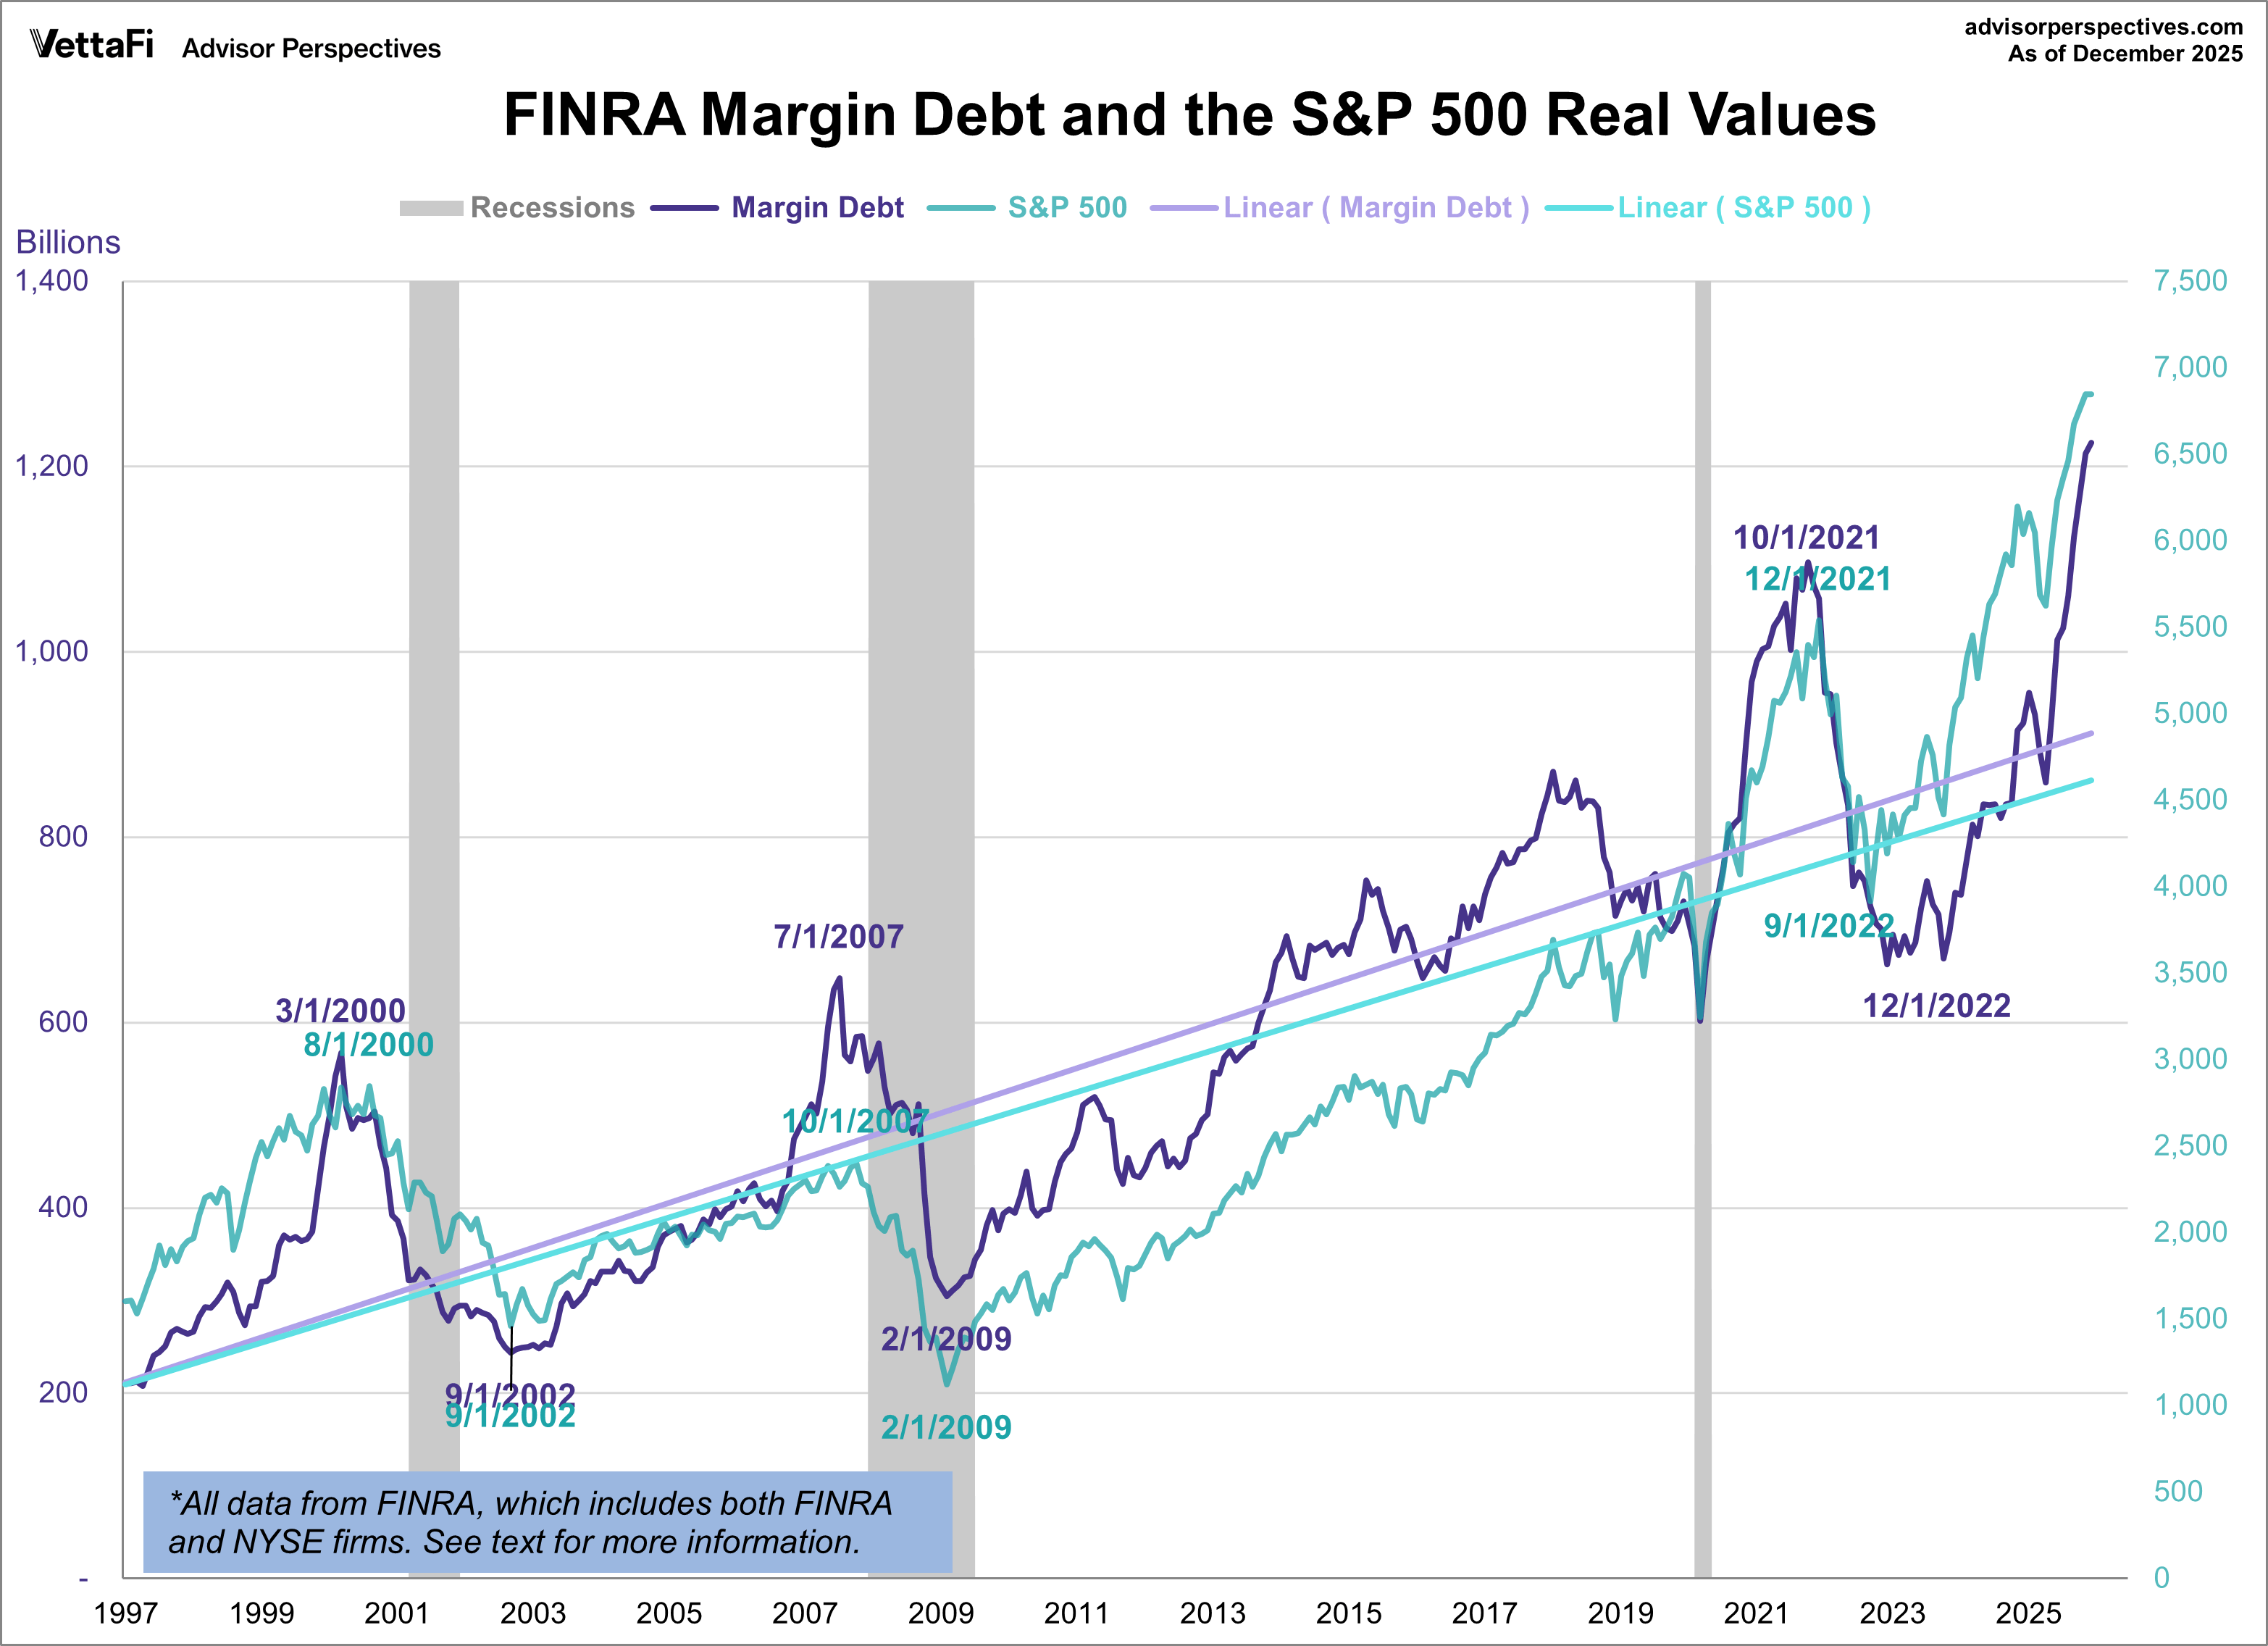
Additionally, studies have shown that when margin debt reaches levels similar to where it is today, it can help. It is often an early indicator that a sharp market pullback is ahead, which again makes sense given that falling prices can result in margin calls, which lead to forced selling, which then leads to deeper drawdowns in the market than would otherwise be seen. Not only that, but buying stocks on margin tends to lead to elevated valuations relative to what would otherwise be seen, therefore requiring a further pullback in stocks simply to achieve a proper valuation.
The One Yield Curve Signal Investors Ignore At Their Own Risk
The third warning sign is an inverted yield curve. This is an important indicator because, while an inverted yield curve does not mean that a recession is guaranteed to happen, historically, yield curve inversion has been a very reliable indicator of an upcoming economic recession, as the chart below illustrates.
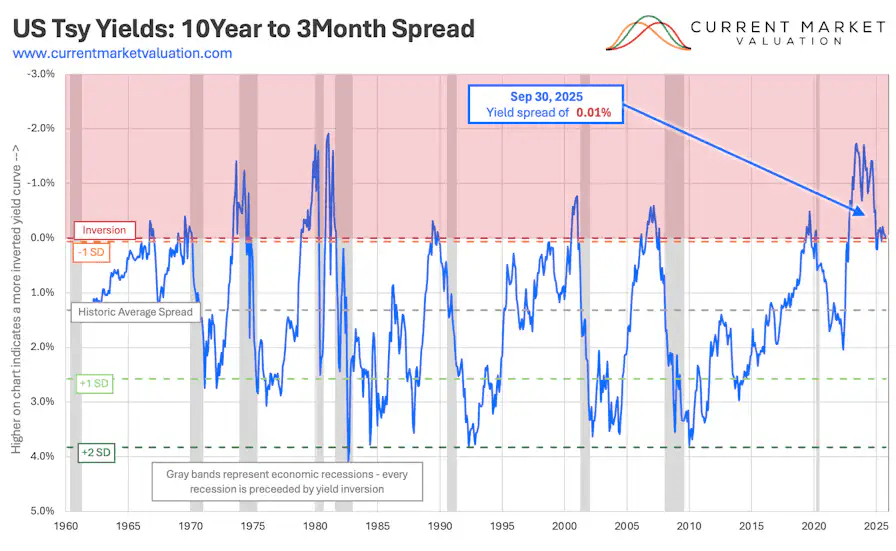
Given that the yield curve recently inverted quite sharply, that means that we may well be in store for a recession. This is because yield curve inversion tends to signal that monetary policy is too tight and, therefore, credit creation slows. This, in turn, can lead to both a stock market correction and a contracting economic environment. It also signals a risk-off environment because it means that investors are fleeing to longer-term bonds (TLT), which are traditionally a safe haven, as a way of hedging against a sharp economic downturn.
While the yield curve has since uninverted, this too is typical before a recession hits, as the chart above illustrates, indicating that the recession could be imminent.
AI Boom Or False Comfort? Why The Bull Case May Be Misleading
Sure, there is a bullish case for the market today, namely that we are on the cusp of an AI productivity boom as well as a manufacturing renaissance in the United States, both of which, if successful, could lead to enormous gains in economic activity, and where manufacturing-related job increases could help to offset some of the lost jobs due to AI. Additionally, the one big beautiful bill act from last year implemented tax and regulation changes that are overwhelmingly pro-business in nature.
However, as these indicators show, there is a strong case to be made for a sharp stock market correction, whether it be due to a recession, as the recent inversion of the yield curve seems to point to, or simply due to the fact that markets are overvalued and overleveraged. At the very least, with valuations and leverage at the levels they are at, any sort of speed bump, the AI boom, and/or material disappointment in economic activity in the United States could send markets substantially lower.
On top of that, there are significant geopolitical risks that could trigger a drawdown, including a major war involving the United States and Iran, an escalation of the war in Europe, which at the moment is relatively confined to Russia and Ukraine, but could conceivably expand beyond that, and/or a conflict involving Taiwan in the Far East, especially if the U.S. were to be drawn into that conflict in a major way.
How I’m Structuring My Portfolio For What Could Be A Major Reset
Given this outlook, how am I positioning my portfolio?
First of all, I am avoiding the major indexes because of the significant drawdown risk. That being said, I’m not completely running for the hills and going all in on cash and cash equivalents (SGOV).
Instead, I’m remaining well diversified with a significant allocation to gold bullion (GLD) leases that provide the safe haven hedge that gold tends to provide in uncertain environments, while still generating attractive income for my portfolio. Additionally, I’m investing aggressively in durable and defensive real asset businesses that pay out attractive yields and trade at deeply undervalued valuations. These include several leading blue-chip midstream infrastructure companies (AMLP), as well as several mission-critical, deeply undervalued REITs (VNQ) with attractive dividends and strong balance sheets, as well as senior secured debt from high-quality underwriters and several other highly attractive infrastructure investments (UTG).
This approach has served me well, especially when combined with an opportunistic capital recycling strategy that has enabled me to achieve total return outperformance over the past five years since launching High Yield Investor, along with a 7% to 8% dividend yield and below-market beta.
Editor’s Note: This article covers one or more microcap stocks. Please be aware of the risks associated with these stocks.

The current bull run continues, until ‘Buy the Dips’ fail
Leave a Reply