The Rate Cut May Produce A ‘Sell The News’ Event
Dec. 07, 2025
David H. Lerner
Investing Group Leader
Summary
- The anticipated 0.25% Fed rate cut is likely already priced in, setting up potential for a ‘sell the news’ event.
- I expect institutional money managers are aggressively buying into the year-end rally, especially in large-cap stocks, to catch up on benchmarks.
- A brief, sharp sell-off of up to -5% may occur post-rate cut, triggered by a potential breakout in the 10-year Treasury yield above recent ranges.
- I plan to trim expensive positions, hold 5-7% cash, and buy discounted quality names, like NFLX, SNOW, and DDOG, if the sell-off materializes.

The Rate Cut May Produce a “Sell the news” Event
The FOMC meeting this week could move the market
This week, on December 10th, it should be no surprise to anyone interested in the stock market that another rate cut of .25% will be announced (cite). The speculation lies in whether this is a hawkish cut (as in “one and down”), or a dovish cut. My take is that the Fed chair will try to couch the announcement as neutral as possible, but during the Q&A, he will appear dovish as he, in my opinion, almost always does. So what’s my problem? Chairman Powell will cut rates, and in all likelihood leave the door open for more cuts next year. Boom!. We are off to the races, we hear the jingling of bells, and the “Santa Claus Rally” gets on to a strong start. We will finish going into January over 7000! We could even see 7200 before the end of January. Most of that move will be in recognition of profit growth, and not a rise in price/earnings multiples.
So if I am taking such a bullish stance, what’s my problem?
As most of my loyal readers know by now, nearly every week, I publish an analysis where I share my thoughts memoir-style. This means that I am sharing my mindset and featuring what the most important undercurrents of the market are. Sometimes I write about individual stocks that intrigue me, but if I see a more macro-view change in the overall market, I am sharing that with all of you. My approach to generating returns is to actively manage my investments and be very mindful of where the market might be taking us. It is very difficult to be exactly right week-in and week-out, but I do believe that it is important to create a picture, and if the market deviates from that picture, then adjust tactics as the week progresses. I think that market participants have already discounted a dovish Fed.
I know that correlation is not causation, but allow me to aver that the recent strength in the market could be (in my opinion, and probably many others) attributed to the excited anticipation of this rate cut. Yes, this is the year-end period, which is widely believed to be the best time of the year, the “Santa Claus Rally”. Not only because it is Christmas or the New Year’s celebrations just up ahead, but because… well, actually, no one really knows why. To be precise, according to our friends at Investopedia.com, the rally, when it occurs, officially starts the week before December 24th (cite). The article goes on to state that some believe it lasts into the first 2 days of January.
This rally starts next week, not this week
I know the likelihood of predicting what the market will do over such a short period is a fool’s errand. I am not doing that, I am pointing out risks, and in fact, this article is a continuation of last week’s article (cite), where I did say we are likely to rally upward and that the closer we get to the old high, the more fragile this rally gets. I also opined that quite often when the price of an equity or index reaches an old high, the first attempt is not usually successful.
Money Managers/Institutions, I believe, are now part of the buying
As you’ll see on the graph below, shows the performance of the “buy side”, are meeting their benchmarks, and they are likely buying into this year-end rally, as you’ll see from the charts below it would be logical for them to push more cash into equities, possibly directly to the biggest, most liquid stocks out there – the magnificent 7. I don’t see a way that I can prove this, but if I were a money manager, that is what I would do, especially since so many of them are underperforming right now.
There are explanations for this phenomenon that do make sense in normal times, such as “window dressing,” where money managers go and buy the best-performing stocks, so their clients can see that their managers were right on top of the winners (cite). There is also a cohort of managers who did not beat their benchmarks, or even meet them. As a result, they pour all the cash that they had set aside into equities. in the hope that the market has a big finish to the year, so they can catch up. My opinion of this motivation to buy from professional money management is my opinion, but formed by years of observing the markets. Here is a very insightful chart from our friends at Bloomberg.com
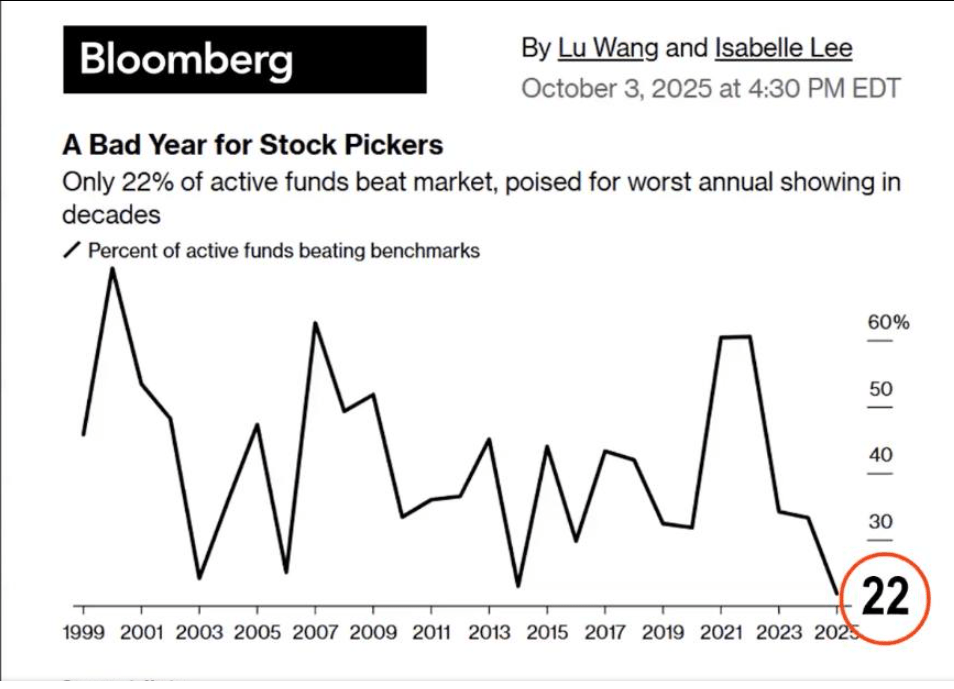
The above chart might buttress the notion that money managers might be more aggressive buyers than usual.
What do I mean by sell the news?
It is half of an old Wall Street saying, “Buy the rumor, and sell the News (or Fact).” It is simply the observation that the market is forward-looking and tries to anticipate what is going to happen in the future. So, as expectations of rate cuts grew in the last several weeks, even before the November cut, it was already the accepted wisdom that there would be another cut, a .25% cut on December 10th, as I had cited in the first paragraph. The stock market index is rallying strongly in anticipation, and by the time the cut is announced, most of those anticipating this news have already put their money to work. I would say this in normal times, but with many professionals behind on their benchmarks, I believe many are piling in.
What makes me think so ? This is my opinion borne of experience. The rally this week has been very strong. This past Friday at 10:30 am, the S&P 500 reached all the way to 6895, just 25 points from the all-time high; the previous day, the market closed at 6856. That was a nice pop, but then the index started to slide almost the entire day, reaching a low of 5662 at 3:45 pm, and with only 15 minutes left, and as it was a Friday, I assumed we would end in the minus column. By assuming that Friday would be a down day, market participants tend to take some profits at the end of the week, especially when there is no particularly bullish news that day. The spike at 10 am was due to the lower PCE data, which was not super relevant since it was from September. So at that 3:45 pm mark, instead of falling further and ending in the red, buyers came in to elevate the index to 5670, and a new high end the week. What happened here? I think there were a lot of “market-on-close orders” coming in. Who normally uses market-on-close orders? Most institutional investors use market-on-close orders; typically, these orders begin to be executed about 15 minutes before the actual close. Look at this daily chart. (cite)
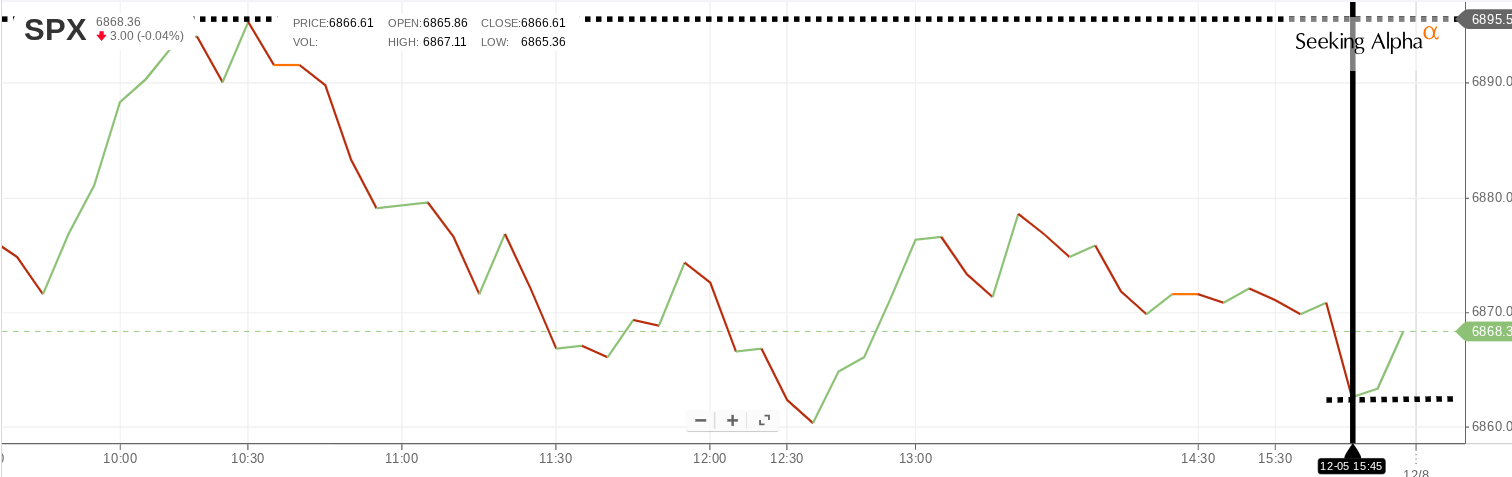
That jump to 5870 started at exactly 15 minutes before the close. I believe this price action buttresses the argument that Institutions are buying this rally. I was closely watching the close as I always do, and fully expected that the downtrend that started at 10.30 this morning would just continue into the close. I was pleasantly surprised by the change in direction in the last few minutes of the day. Only in the course of this writing did this occur to me. I think there will be more buying on Monday and Tuesday, and once everyone is on the bullish side of the boat, the risk on Wednesday is that selling will begin.
But wait, there’s more!
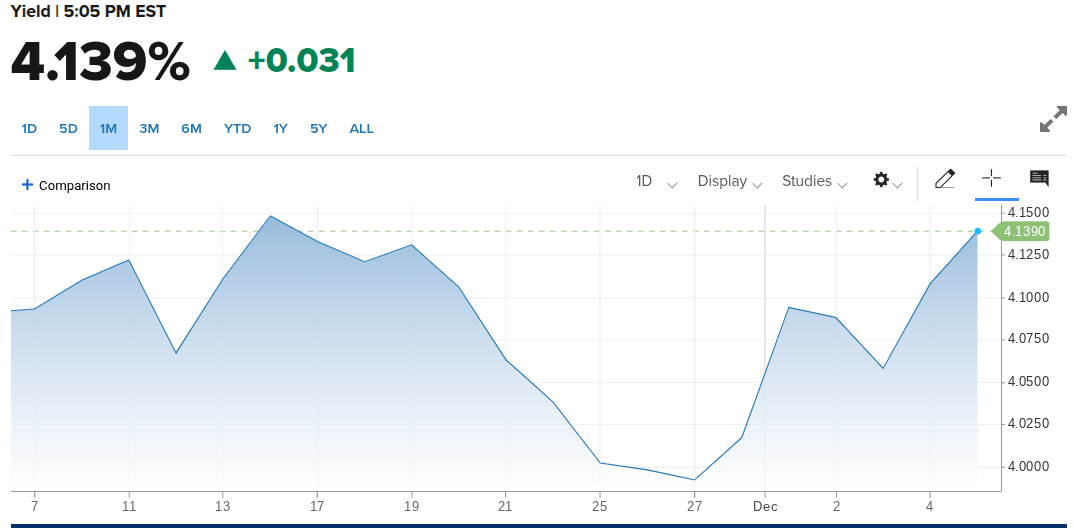
If it is just about selling the news, I doubt that it will be a very big sell-off, and may not even be sustained for a full day the following Thursday. No, there is one more macro issue that I believe will crop up and give several days of selling. Below is the 10-year US Treasury bond. Check out this chart from our friends at CNBC.com. This is a one-month chart, but I want you to look at that drop on November 27. It was on that day that the rate for the 10-year fell below 4%. Ever since that time, alongside the growing confidence that another cut was coming, the rate has climbed, reaching nearly 4.14% at the end of Friday’s close at 4.139%.
I believe the 10-Y breaks above its recent range and in proximity to the aftermath of the rate cut it will be the catalyst to give us a sharp sell-off, perhaps as much as -5%. I am going to buy that sale off. I don’t expect the rate to break above 4.25%, and after the rate settles down, the tally should continue, hitting 7,000 by year-end. If you are a buy-and-hold type, then make sure you have the resolve to stay the course if there is sharp selling. The media is going to love this unexpected news and will amplify the drama. As I am a more active type, I will trim some positions by selling my most expensive shares of those positions, and just have 5% to 7% cash set aside to redeploy. I might choose to buy the same names at a lower price, or pick up something new. I still believe that with patience, even the best names can give you a -20% discount or more, look at Netflix (NFLX)!
Leave a Reply