What might we learn from the ‘dot com’ era that we can apply to today’s markets ?
Alan Ray
Disclaimer
This is not substantive investment research or a research recommendation, as it does not constitute substantive research or analysis. This material should be considered as general market commentary.
One of the profound differences between today’s investor and the investor of 25 years ago is that it is much easier today for us to imagine that a very large company can grow at extremely high rates than it was at the turn of the century. That statement may contradict many investors’ recollection, lived or otherwise, of what happened 25 years ago. After all, didn’t everyone’s imagination run wild, inventing new financial ratios to justify valuations that were absurd then and absurd today? Well, yes, if one focuses on the very narrow period of 1999 to 2000. But in the aftermath of the bubble bursting, perhaps embarrassed by our irrational exuberance, it took many of us years to get comfortable with the idea that a few very large companies could grow at a rate that had only been thought possible for a small business. The old ‘elephants don’t run’ adage was often recited, and for a sustained period after the bubble burst, investors in what came to be called ‘old economy’ businesses did much better than their ‘new economy’ counterparts. In the end though, investors grudgingly accepted that it was possible that a handful of large companies were ‘special’. And over time, it became increasingly meaningless to identify ‘old’ and ‘new’ economy companies as technology became ordinary and ubiquitous.
Indeed, long-time investors in the investment trust sector may recall that the transformation of Scottish Mortgage (SMT) to its status as a leading investor in high growth businesses took several years to complete. Whereas the manager at the time had arrived at the above conclusion early on, the process of persuading shareholders of what was a relatively traditional global equity trust took some time. What we have no trouble imagining today was, for many, a huge leap of faith.
Back in 1999, bankers were run ragged by dozens of new IPOs of increasingly outlandish businesses with no obvious route to profitability. These were eagerly bought by investors who wanted to own anything and everything that embraced the new technology of the day. This approach missed the vital point that many established businesses were transforming to embrace the internet but doing so at a measured pace and using their traditional brands and customer bases to anchor them while they made the transformation. For example, retail has been changed out of all recognition by the internet, but some ‘pre-internet’ brands have made a successful transition, learning from the mistakes of startup rivals. It’s taken the best part of a quarter of a century for the logistics and infrastructure that supports that transformation to catch up, and having existing ‘bricks and mortar’ has proved, for smart management teams, a bigger advantage than having the slickest website. For example, the resulting transformation of the property market is, today, a key theme in the portfolios of REITs such as Picton Property Income (PCTN) or Schroder Real Estate (SREI).
Today, bankers are less focused on IPOs and more on funding rounds for large private companies that are at the heart of the next wave of AI-related technology. We no longer have difficulty imagining that the eye-watering valuations of those companies will eventually be justified because we have all witnessed it happening before. It would be wrong to say that this is the sole focus of investors looking for AI ‘angles’, with businesses involved in the infrastructure behind power and data networks being a popular theme in many equity trusts, as one example. But in contrast to 1999, there are few high-profile IPOs presenting investors with absurd business models. At least, not yet.
So, while it is tempting, and quite sensible, to draw parallels to 1999/2000, there are some significant differences in what we know now compared to then. But once again we seem to have trouble imagining that the products and services that the same very large companies are developing might, if they are to succeed, transform the rest of the corporate world. The chart below shows how this lack of imagination is manifesting itself in stock market terms. This is the S&P 500 Index we are all familiar with plotted against the ‘equal weighed’ S&P 500 Index. For readers not familiar with the difference, while the S&P 500 Index weights each company according to its market cap, the ‘equal weight’ applies the same weight to every company. When a few very large companies perform well, the regular S&P 500 Index will perform well too, but the equal weighted version will perform less well. Which is exactly what has happened recently. As ever, we represent those indices in the charts using ETFs that track them, since those are real-world instruments that any investor can buy.
S&P 500 and S&P 500 EQUAL WEIGHTED
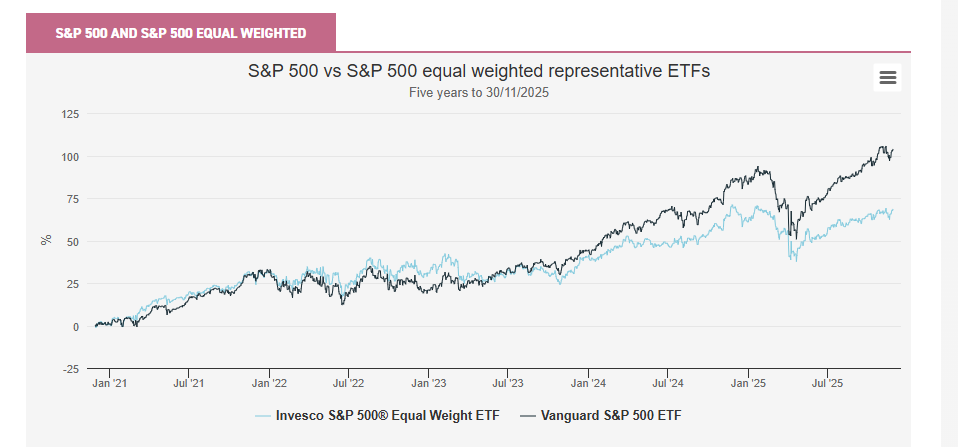
Source: Morningstar
Past performance is not a reliable indicator of future results
What this means is that we have a pattern where our ‘version 2.0’ imagination has no problem with future success for a handful of businesses, but this seems to be entirely at the expense of the rest of the market. For investors with a contrary nature or who are interested in the ‘only free lunch’ of diversification, this has the potential to be a very interesting opportunity. Again, we have no problem imagining that some of these large companies will get larger, but to do so they will need to provide products and services that others want to buy. Will all the other companies left behind in the index buy their products if they aren’t helpful to their business?
Speaking of diversification, to conclude the point on the two versions of the index, the next two charts show the sector exposure for the S&P 500 Index and its equal weighted neighbour. The largest ten constituents of the S&P 500 Index are about 40% of the overall index, which puts it right up there with active ‘focus’ funds in terms of its ‘conviction’. Technically, the equal weighted version doesn’t have ten largest constituents given the nature of its construction, although it’s likely one will find slight variations in position sizes for ETFs tracking the index. But one should expect any ten holdings to add up to 3% or less of the total. It’s also worth noting that US equities are over 70% of world indices, so even those investors who prefer global over US-specific trusts will likely find they are experiencing a similar concentration risk.
The first of the two charts shows the sector exposure for the equal weight index and is, perhaps, a good representation of what, in our imagination, the US equity market looks like.
S&P 500 EQUAL WEIGHTED SECTOR EXPOSURE
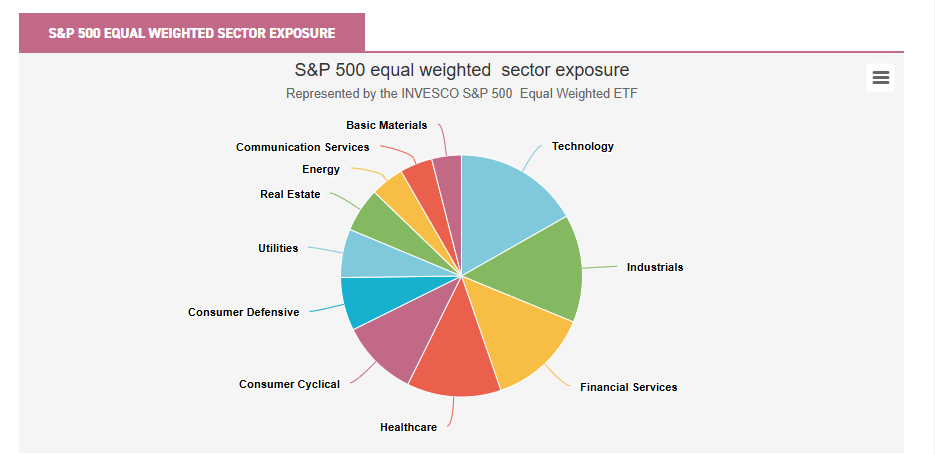
Source: Morningstar
The second chart, the market cap weighted index we are all familiar with, shows in sector terms just how concentrated things have become in the US market. And again, global indices will be subject to the same influence.
S&P 500 SECTOR EXPOSURE
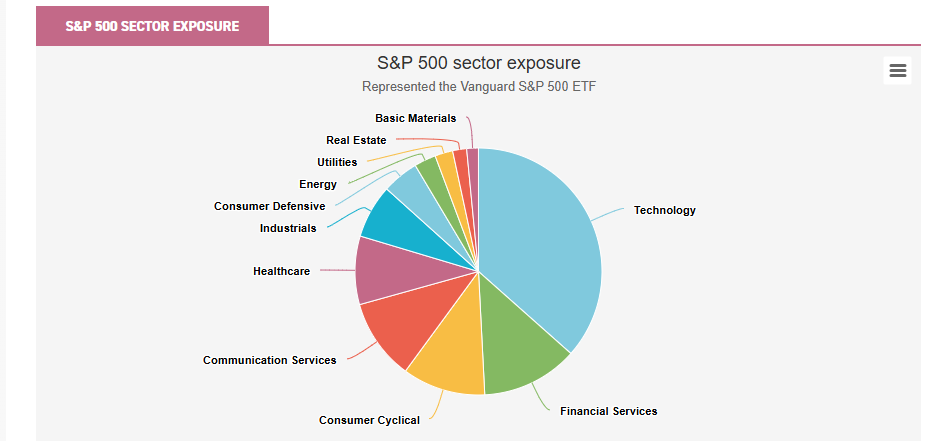
Source: Morningstar
In the investment trust world, there are a couple of good mainstream ways to alleviate concentration risks in respect of US equities. First, JPMorgan American (JAM) deservedly holds the status as the leading ‘core’ US equity trust, combining elements of large-cap growth and value, together with a smaller (<10%) combination of small-cap growth and value, to achieve a more balanced mix of the US’s leading companies, including some of those mega-cap names. By dint of its equity income mandate, North American Income (NAIT) provides a very different set of exposures. Whereas its mandate is by no means akin to the ‘equal weight’ index, it’s very interesting that, as the chart below shows, an active mandate that is naturally underweight those mega-cap growth companies has performed very similarly to that index. In a scenario where investors decided to dust down the ‘old economy’ vs ‘new economy’ idea, one could imagine NAIT being very well positioned to benefit.
S&P 500 AND NAIT
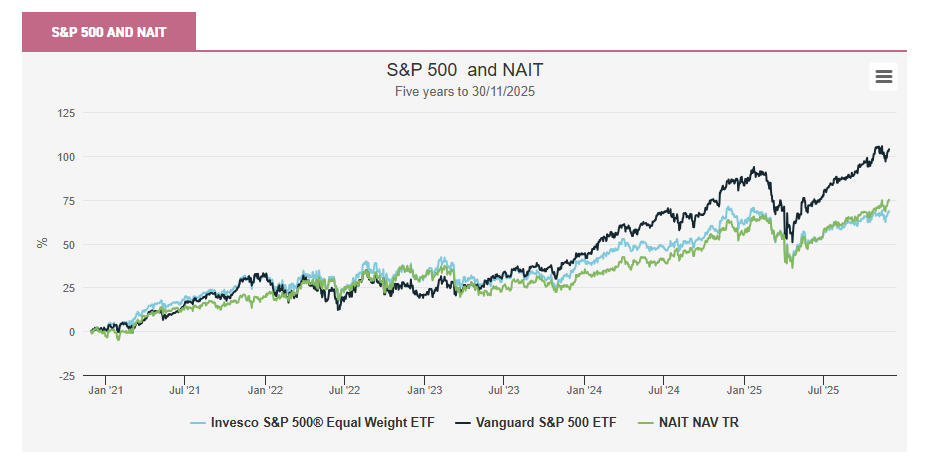
Source: Morningstar
Past performance is not a reliable indicator of future results
At our recent online event, Real Dividend Heroes and Growth Giants, a range of fund managers gave their own views on this topic, and all the presentations are available to watch back, and the accompanying presentations are available to download. One particularly interesting slide can be found in the presentation given by the manager of the global growth trust Brunner (BUT), which has been reducing exposure to the most highly valued companies in the US in favour of first or second derivative beneficiaries. If one downloads and views slide 17 of the presentation one will see a couple of eye-watering statistics that bring the issue of valuations to life. First, South Korean auto manufacture Kia has similar net income to Tesla, but the latter company has an enterprise value 87x (not a typo) that of the former. Second, US AI defence stock Palantir’s market cap is c. $430bn on revenues of $3bn. Whereas, the next five largest defence stocks in the US have a combined market cap of $550m on revenues of $262bn. Once again, our 2025 version of imagination probably feels quite casual about that and can easily fill in the growth case for the difference. But can we really be so confident that we aren’t missing out on the other side of these trades?
One of the toughest places to be a fund manager in the last couple of years has been US small caps. Both the specialist investment trusts in this space, Brown Advisory US Smaller Companies (BASC) and JPMorgan US Smaller Companies (JUSC) identify as ‘quality growth’ investors and this has been a very difficult place to be. Earlier we noted that there isn’t the same mania for IPOs of companies with only very sketchy business models, but in US small-cap land there certainly has been a more recent mirror of the S&P 500 Index’s experience, where a handful of stocks attached to the AI theme have dominated small-cap indices. Many of these businesses are unprofitable and therefore don’t meet the ‘quality growth’ threshold. This has been a major contributor to both of these trusts’ underperformance, but again, can we really be so confident that there aren’t opportunities on the other side of this trade?
Conclusion
Stock markets are more complicated than we’ve portrayed above, of course and the US and other markets are influenced by other big factors of the day. While the so-called ‘hyper scalers’, or mega caps, or whatever we choose to call them, are proceeding at pace with their capital expenditure plans to build the infrastructure required to power AI, much of the rest of corporate America has delayed its own spending and investment while it ponders the implications of trade tariffs. The UK has just been through its own arguably unnecessary period of uncertainty around the budget, with similar results for corporate spending. No doubt this very distinctive contrast is skewing earnings reports, and as we note above, has led to a very polarised smaller-companies market in the US. But uncertainty is waning as the US administration moves on to other matters. With greater certainty we may see a more balanced cycle of expenditure across other businesses.
It’s very difficult for many of us to imagine, and perhaps confront, the transformative effect AI will have on our lives and on businesses. It’s far less difficult for us to imagine that a few large companies will end up fully justifying the valuations we’ve placed upon them, and that belief has profoundly influenced the composition of US and global stock markets. But it seems far harder for us to imagine that, for that to happen, all the other companies need to have a reason to buy their products. In our imagination, that’s where the opportunity increasingly lies.
Leave a Reply