New Fed Chair, QE & Lower Rates
JD Henning
Investing Group Leader
Summary
- Fed policy shifts—lower rates and renewed balance sheet expansion—signal a bullish environment for value stocks and broader market participation in 2026.
- Historical patterns suggest lagging DJIA and value sectors are poised for recovery as monetary easing returns and fiscal stimulus increases.
- Sector rotations and algorithmic models highlight opportunities in consumer cyclical, energy, and basic materials, with proven winners likely to return next year.

Introduction
“Timing, perseverance, and 10 years of trying will eventually make you look like an overnight success.” ― Biz Stone, co-founder of Twitter.
Timing matters, and it matters greatly. I have spent the last 35 years trading, researching, and constructing algorithms to identify and leverage the value across fundamental, technical, and behavioral finance models. Of the ten portfolio models designed for optimal portfolio mixes for members to beat the market at Value & Momentum Breakouts, eight come from enhancing well-tested anomaly research in published financial journals. All of the models continue to outperform the S&P 500 in live forward testing here on Seeking Alpha, and again this year.

Finding Value in a Market Poised for New Leadership
This article builds on my prior 2026 outlook articles with a more focused look at one of our top models from published financial literature that I have found to consistently outperform in good and bad seasons.
I am a strong advocate for leveraging the strengths of different fields of financial analysis, from fundamental to technical to a wide variety of behavioral variables. These approaches each can deliver successful model portfolios, as documented through our live trading on Seeking Alpha the last 9 years.
The thing to consider is that we rarely ever see market leaders from the prior year be market leaders for the coming year. ~ JD Henning, January Podcast
Somewhere over the past decades of trading and researching the markets, I discarded the notion of being a pure buy-and-hold investor. People may do well in buy-and-hold approaches, but they invariably have to ride through some major downturns to arrive with good results in the end. Back in the days when I relied on well-known investment firms for advice, I often received more coaching about my patience than any valuable insight about market behavior. Like many of you, my cynicism and curiosity about the financial markets led me to test, experiment, and run studies across thousands of different trading approaches, algorithms, and models. The long-term development of my momentum gauge algorithms for market and sector trading signals is one of the key reasons I am no longer a “buy/hold and hope for the best” investor.
Here’s a 10-minute view of some key factors to consider for next year. Focus is on leveraging our value portfolio from a wide variety of top-performing models available in our Seeking Alpha Investment Group.
New Fed Chair, Lower rates, and a $40 billion ‘not’ QE
One of the most important factors for market direction is the monetary policy of the Federal Reserve. No forecast of a coming year is complete without consideration of both the fiscal and monetary goals of the key policy drivers. We already know that the Trump administration intends to significantly lower taxes across the board in a loosening of fiscal tax policies. Historically, lower taxes increase the savings rate and are stimulative for markets. We know that major deregulation across U.S. industries has already begun even as tariffs increase to the highest levels in many years.
What is new for 2026 is a heightened emphasis on changing the monetary policies of the Federal Reserve and even replacing Fed Chairman Jerome Powell. The betting markets see a 92% probability that Trump will announce his new Fed chairman before February 1st.
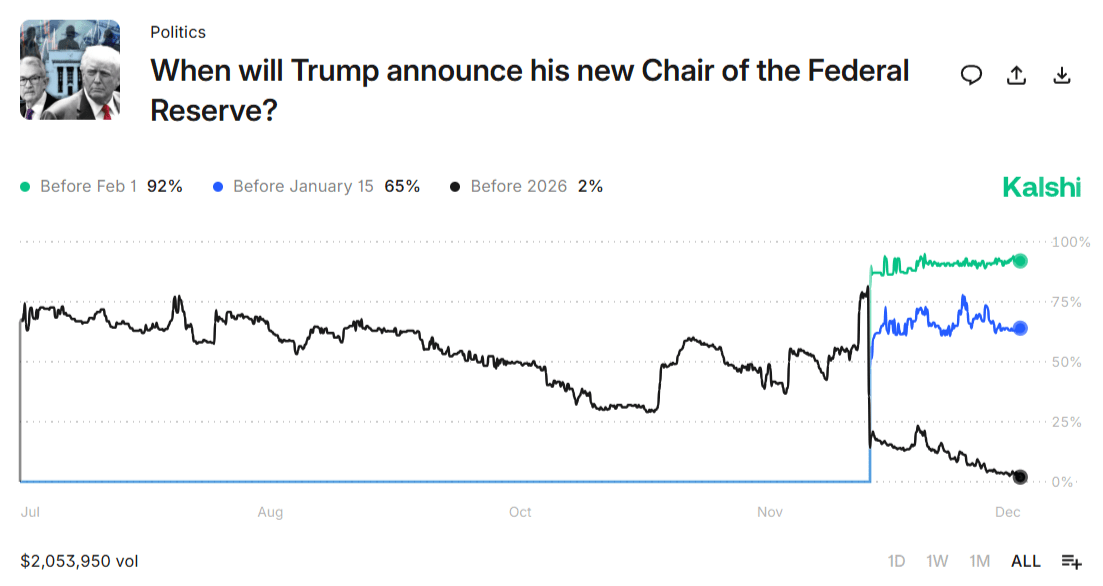
Chairman Powell’s term ends in May, and speculators currently see the most likely replacement is one of two Kevins. Odds place it at 77% that the new Fed Chair will be either Kevin Hassett or Kevin Warsh, with a 92% probability that we will know before February 1st.
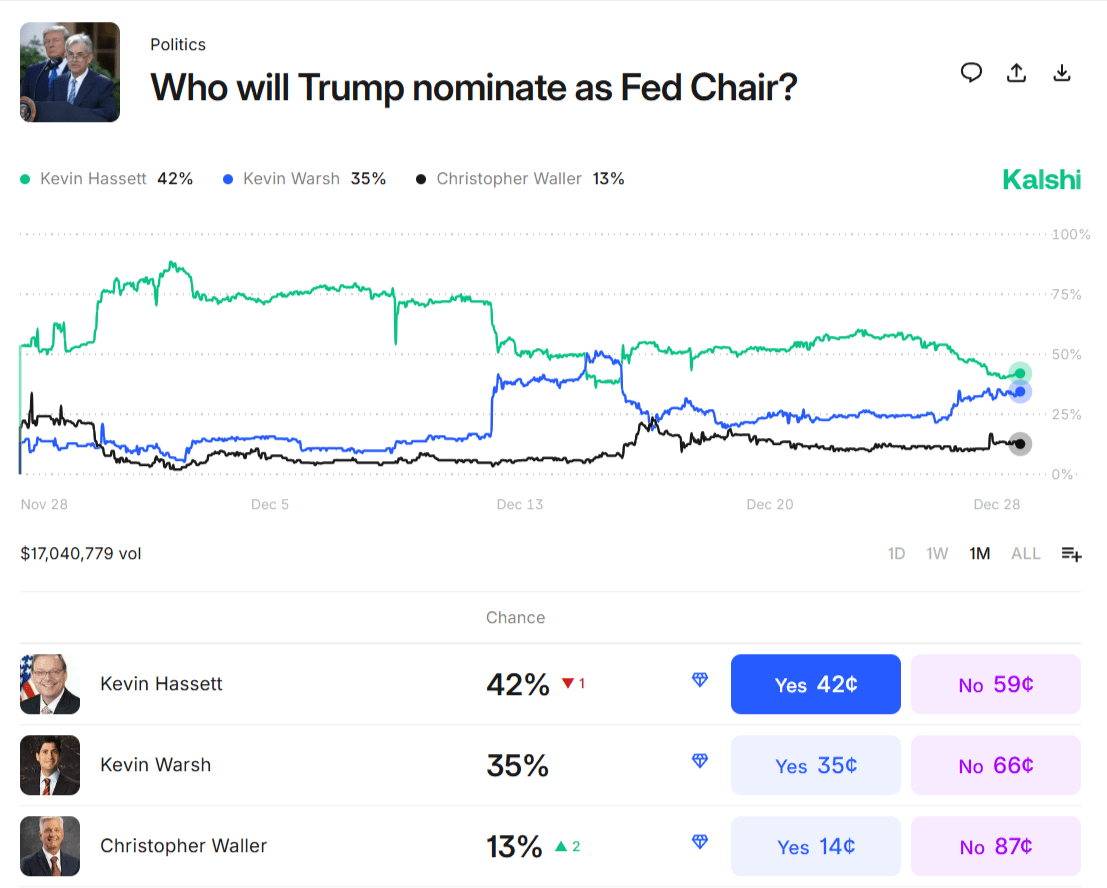
Regardless of which Kevin may be appointed Chairman, we know from Trump’s August appointment of Federal Reserve board member Stephen Miran that the new leadership will be enthusiastically for lower rates. Stephen Miran was the only board member voting for the largest -50 bps rate cut in the latest committee decision. Measurements from 1921 show that lower Fed fund rates are extremely bullish for markets, and the DJIA in particular, when there is no impending recession. The most recent GDP numbers of +4.3% in Q3 2025 certainly support a robust current economic condition far from a recession.
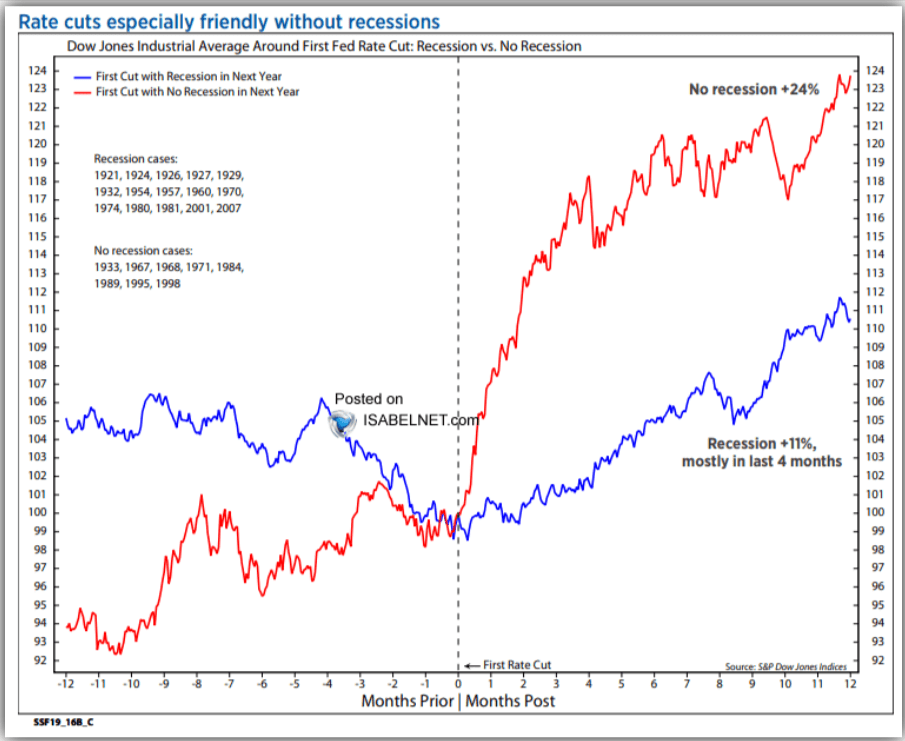
So the Fed fund rate chart above suggests we could experience a very positive DJIA average growth rate for the 12 months from the first rate cut. It may also be that the relatively slow rate of cuts from the highest Fed funds rates in 22 years has not had a meaningful impact yet on the DJIA pattern and a broad market boost beyond the biggest growth stocks.
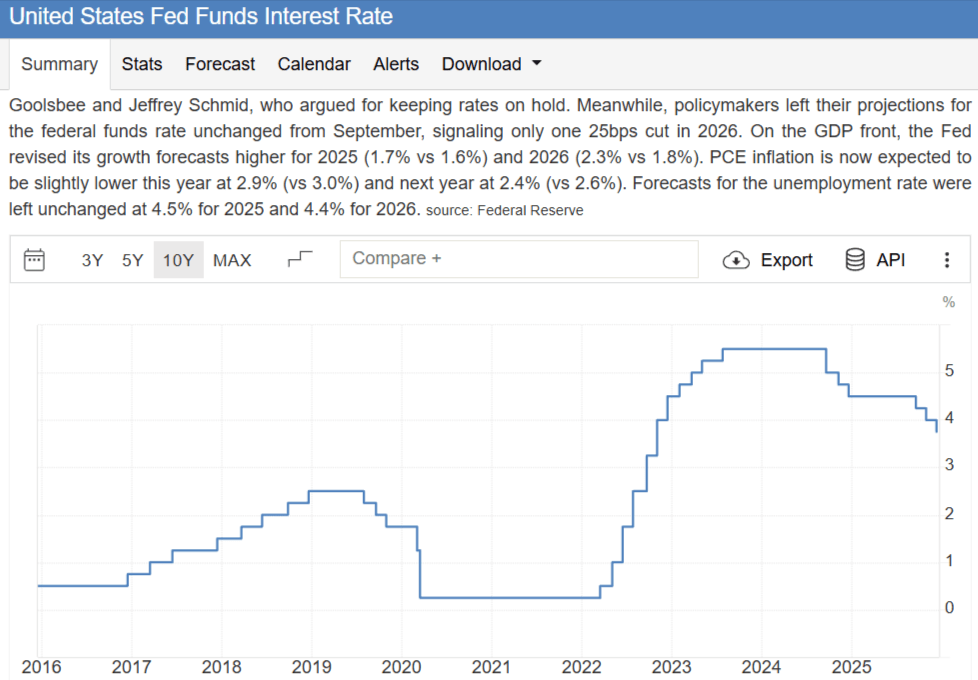
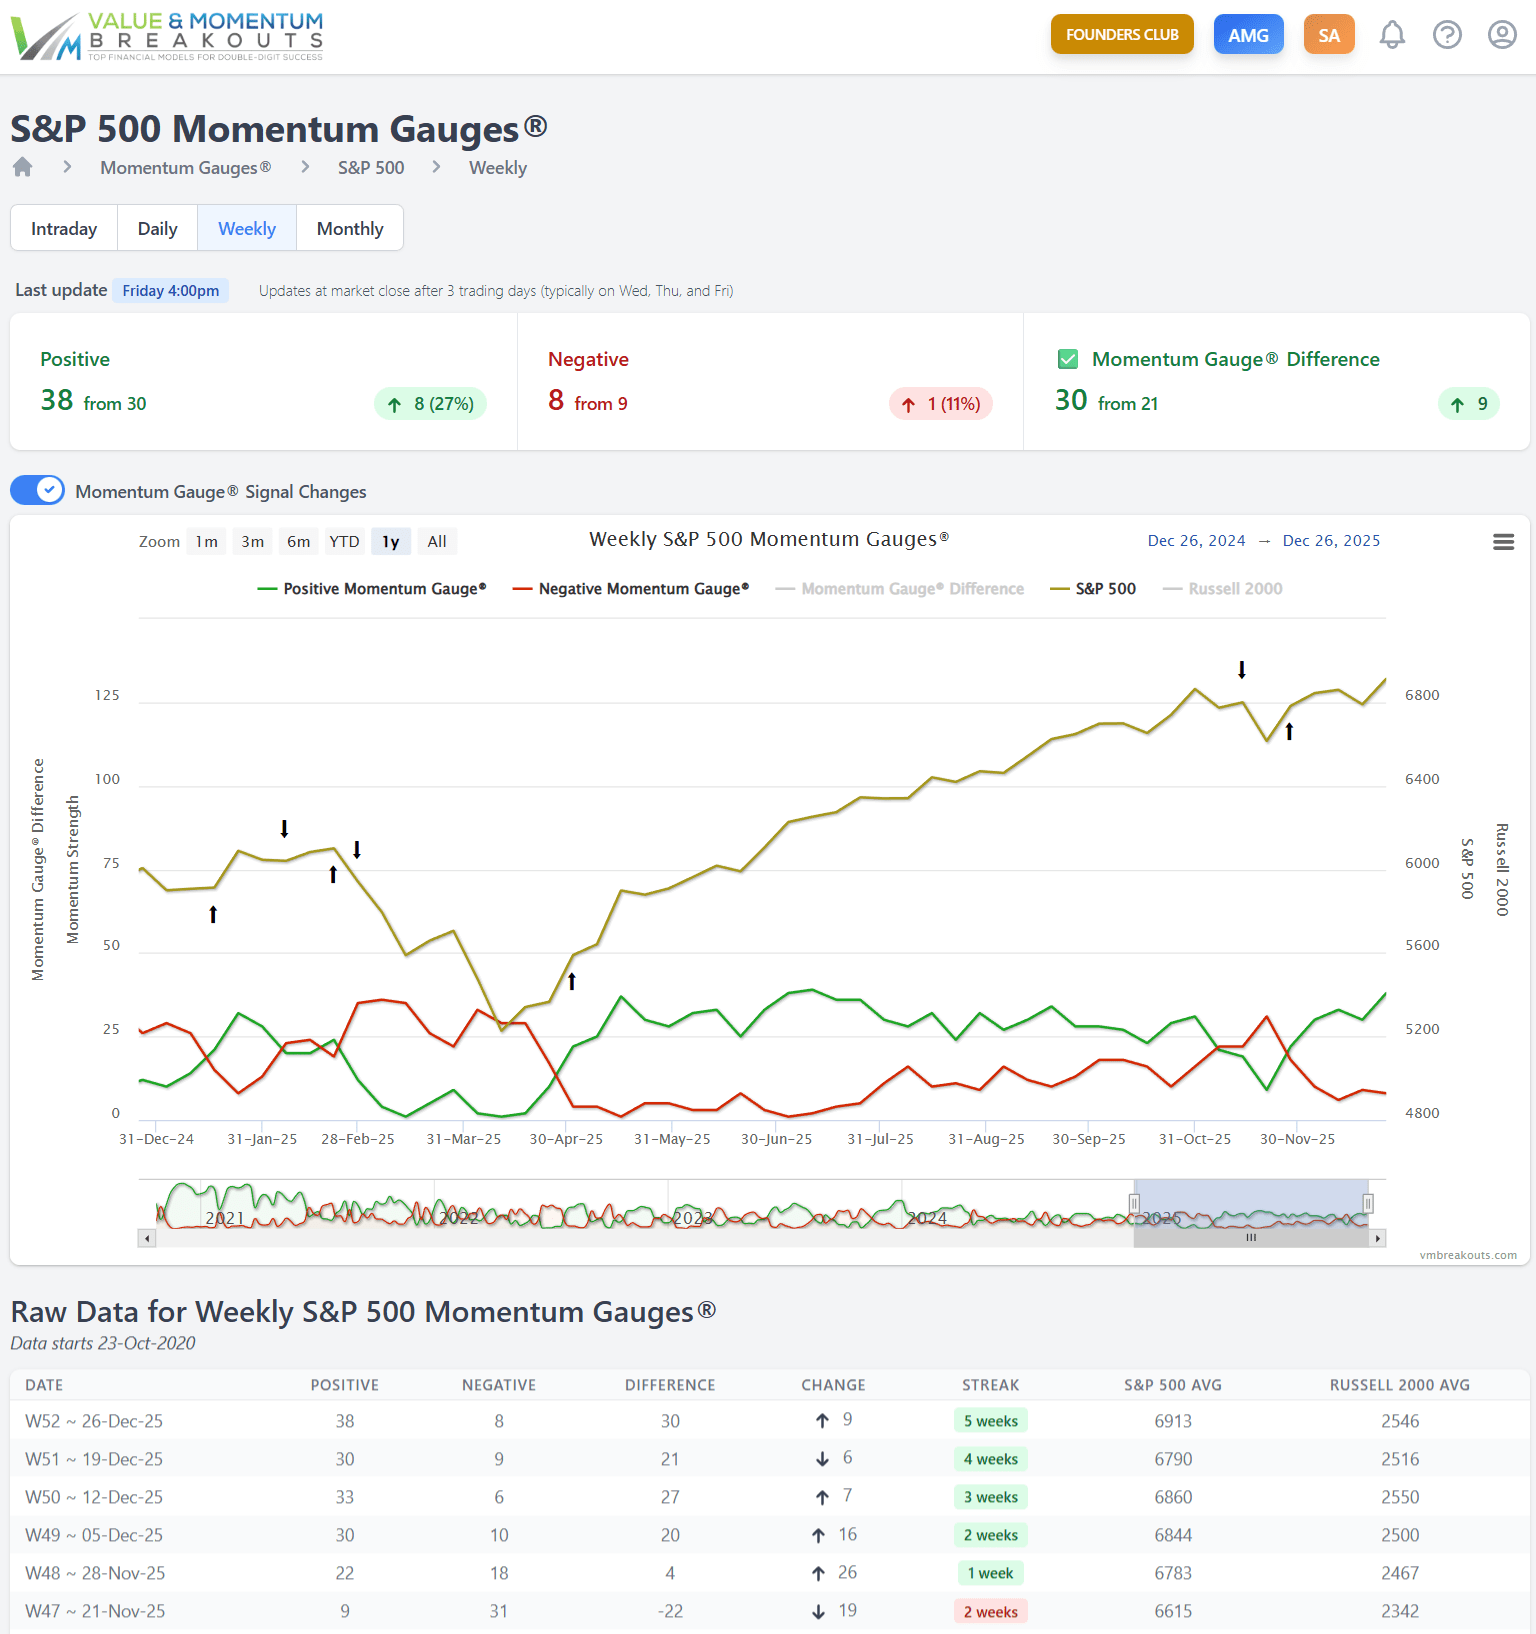
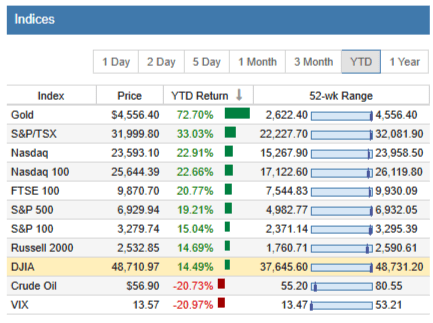
We can see for the past year that the Dow Industrials lagged all the other major indices during the first few rate cuts of 2025. Growth stocks have done very well in the past year, while value stocks and small caps have lagged the strong growth moves. This suggests that the impact of the rate cut pattern may still be well within the average 12-month growth window, with more gains to come.
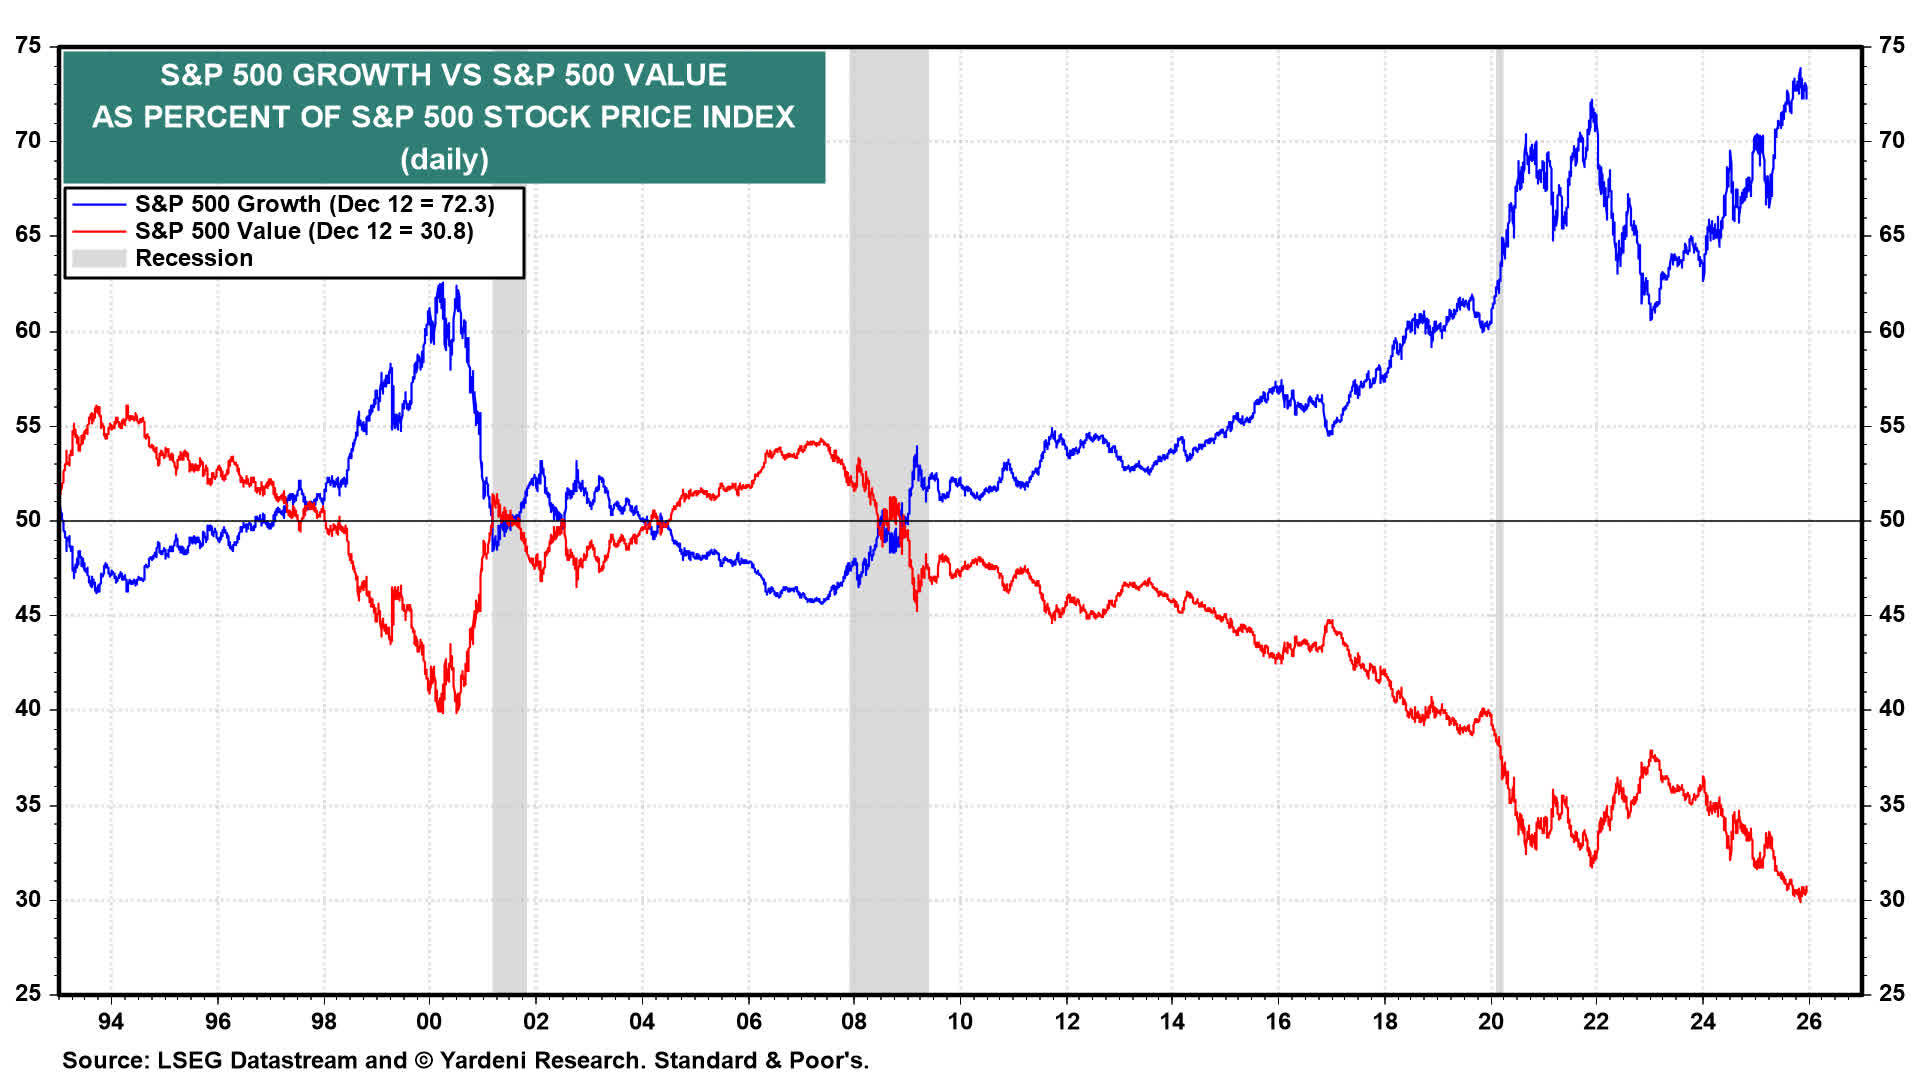
The reaction we have seen to the first few cuts of the Fed easing cycle is fully consistent with historical patterns documented from 1974. Growth typically beats value through the first few rate cuts — that we have seen. Small caps typically beat large caps, which we have not yet seen. Bonds lead stocks, which we have definitely not witnessed yet.
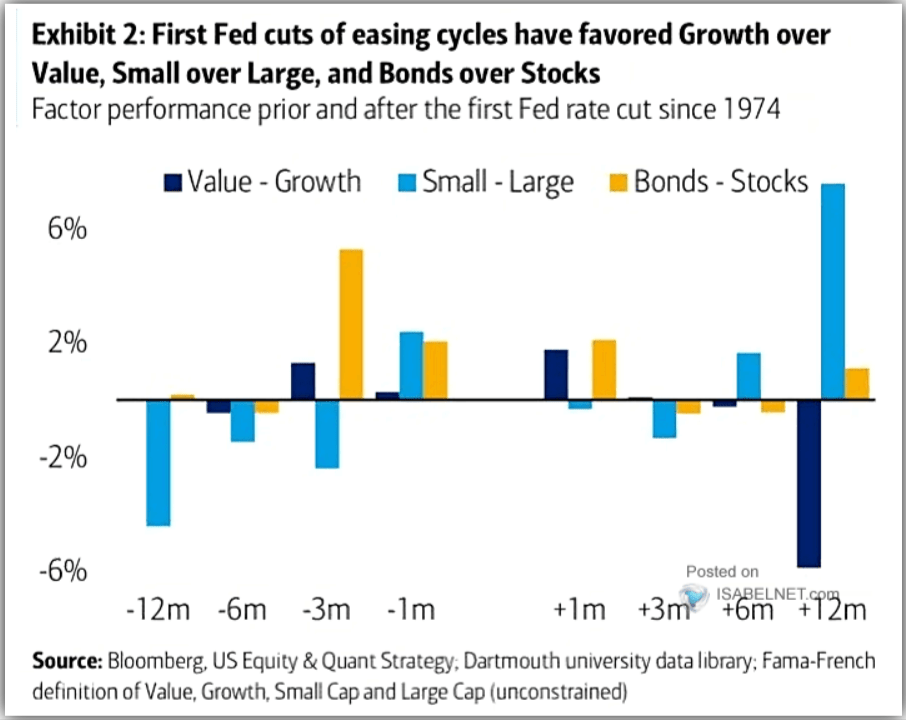
Based on these easing cycles and the current market indices, it seems probable that more value stocks are due for a recovery soon. Certainly more declines in rates may create the expected effects more clearly. I discuss this further in my recent article about market bubbles linked above. Further, the Fed has just shifted from a quantitative tightening program in the fight against inflation to an “unofficial” easing program that started December 1st.
What is the significance of tightening and easing the Fed balance sheet? Since the Global Financial Crisis, we have seen the Fed use quantitative easing to flood the market with liquidity and improve market conditions. The largest and most recent use of quantitative easing was back during the major Covid correction. The S&P 500 lost over -35% from its highs in February, and the Fed stepped in with a major easing program in March of 2020, shown on the chart below.
Fed Balance Sheet vs. S&P 500 during 2020 Covid correction
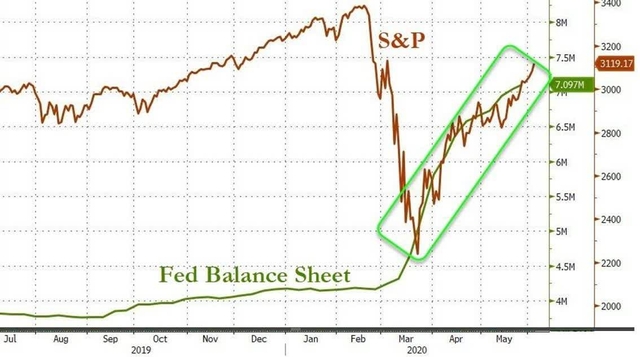
The context of that incredible QE intervention that rescued markets is also shown in 2020 on the Federal Reserve balance sheet chart below. The correlation between market performance and the Fed balance sheet is remarkably strong, but not the only factor of fund flows that benefit equities.
The most important takeaways, without getting into more details about the composition and impact of the Fed’s domestic security holdings, are two-fold:
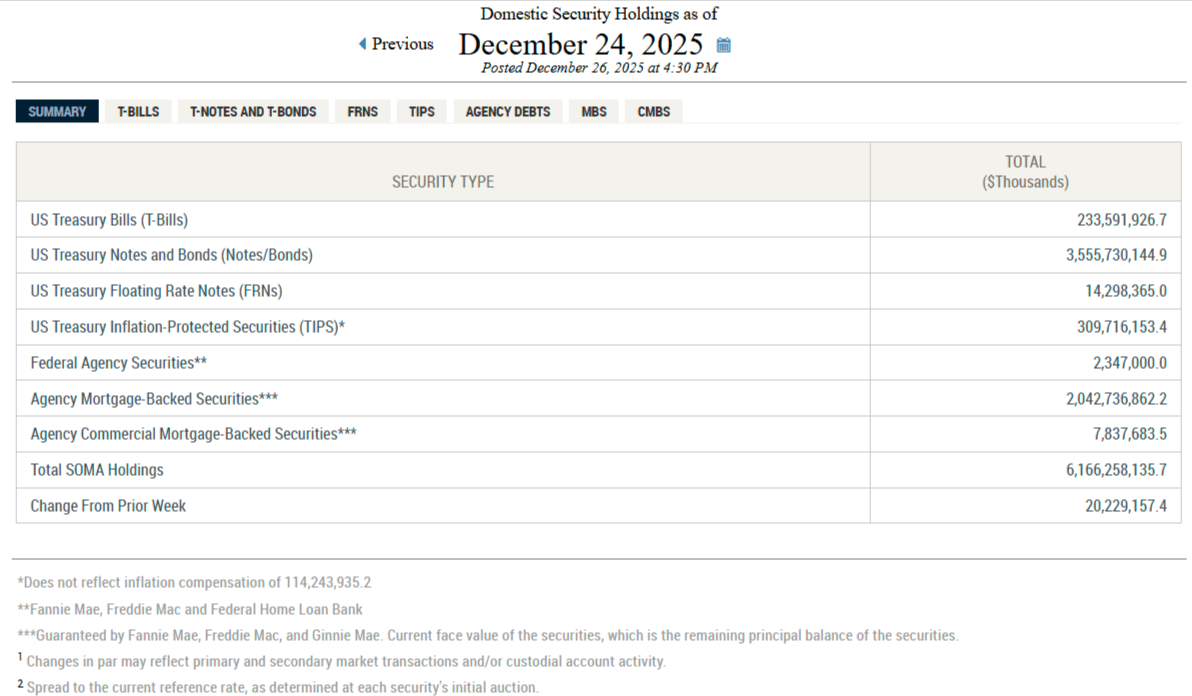
1. A change in the direction of the Fed balance sheet to more easing is more bullish for markets. The recent Fed promises of up to $40 billion per month added to the balance sheet into 2026 have already begun, as the December SOMA reports show. Last week saw an increase in the Fed’s domestic holdings of $20.2 billion and $14.7 billion in the prior week.
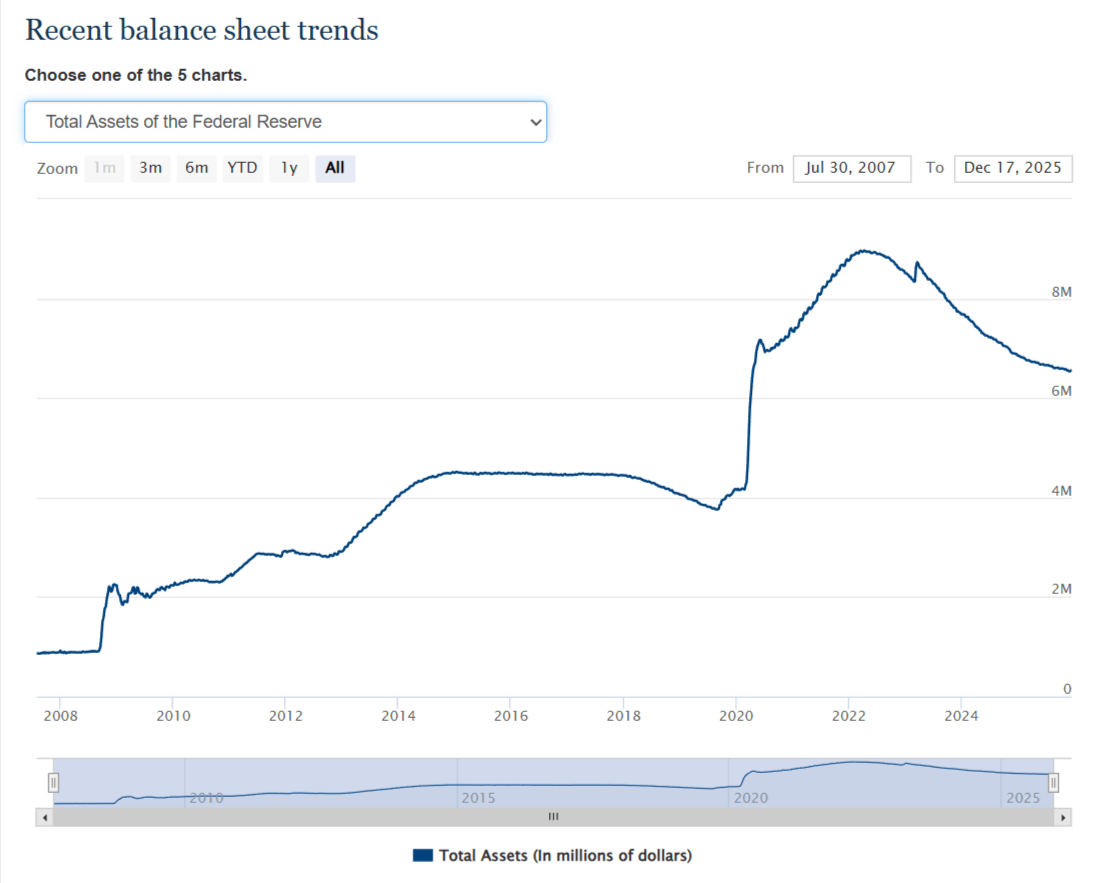
2. The magnitude of the Fed assets on their balance sheet is also of critical importance for overall liquidity. Fed assets peaked at $8.965 trillion in 2022 and have been rolling off steadily to the recent lows of $6.131 trillion this past November, when the tightening ended on December 1st. We can see from the Fed balance sheet chart that these levels rising back up to total SOMA holdings of $6.166 trillion near the end of December are still far above the pre-Covid levels used to stabilize markets through 2018 after the Global Financial Crisis. Many of my prior QE/QT articles suggest that there may be a threshold at which market liquidity gets low enough to shock markets like we saw in 2018.
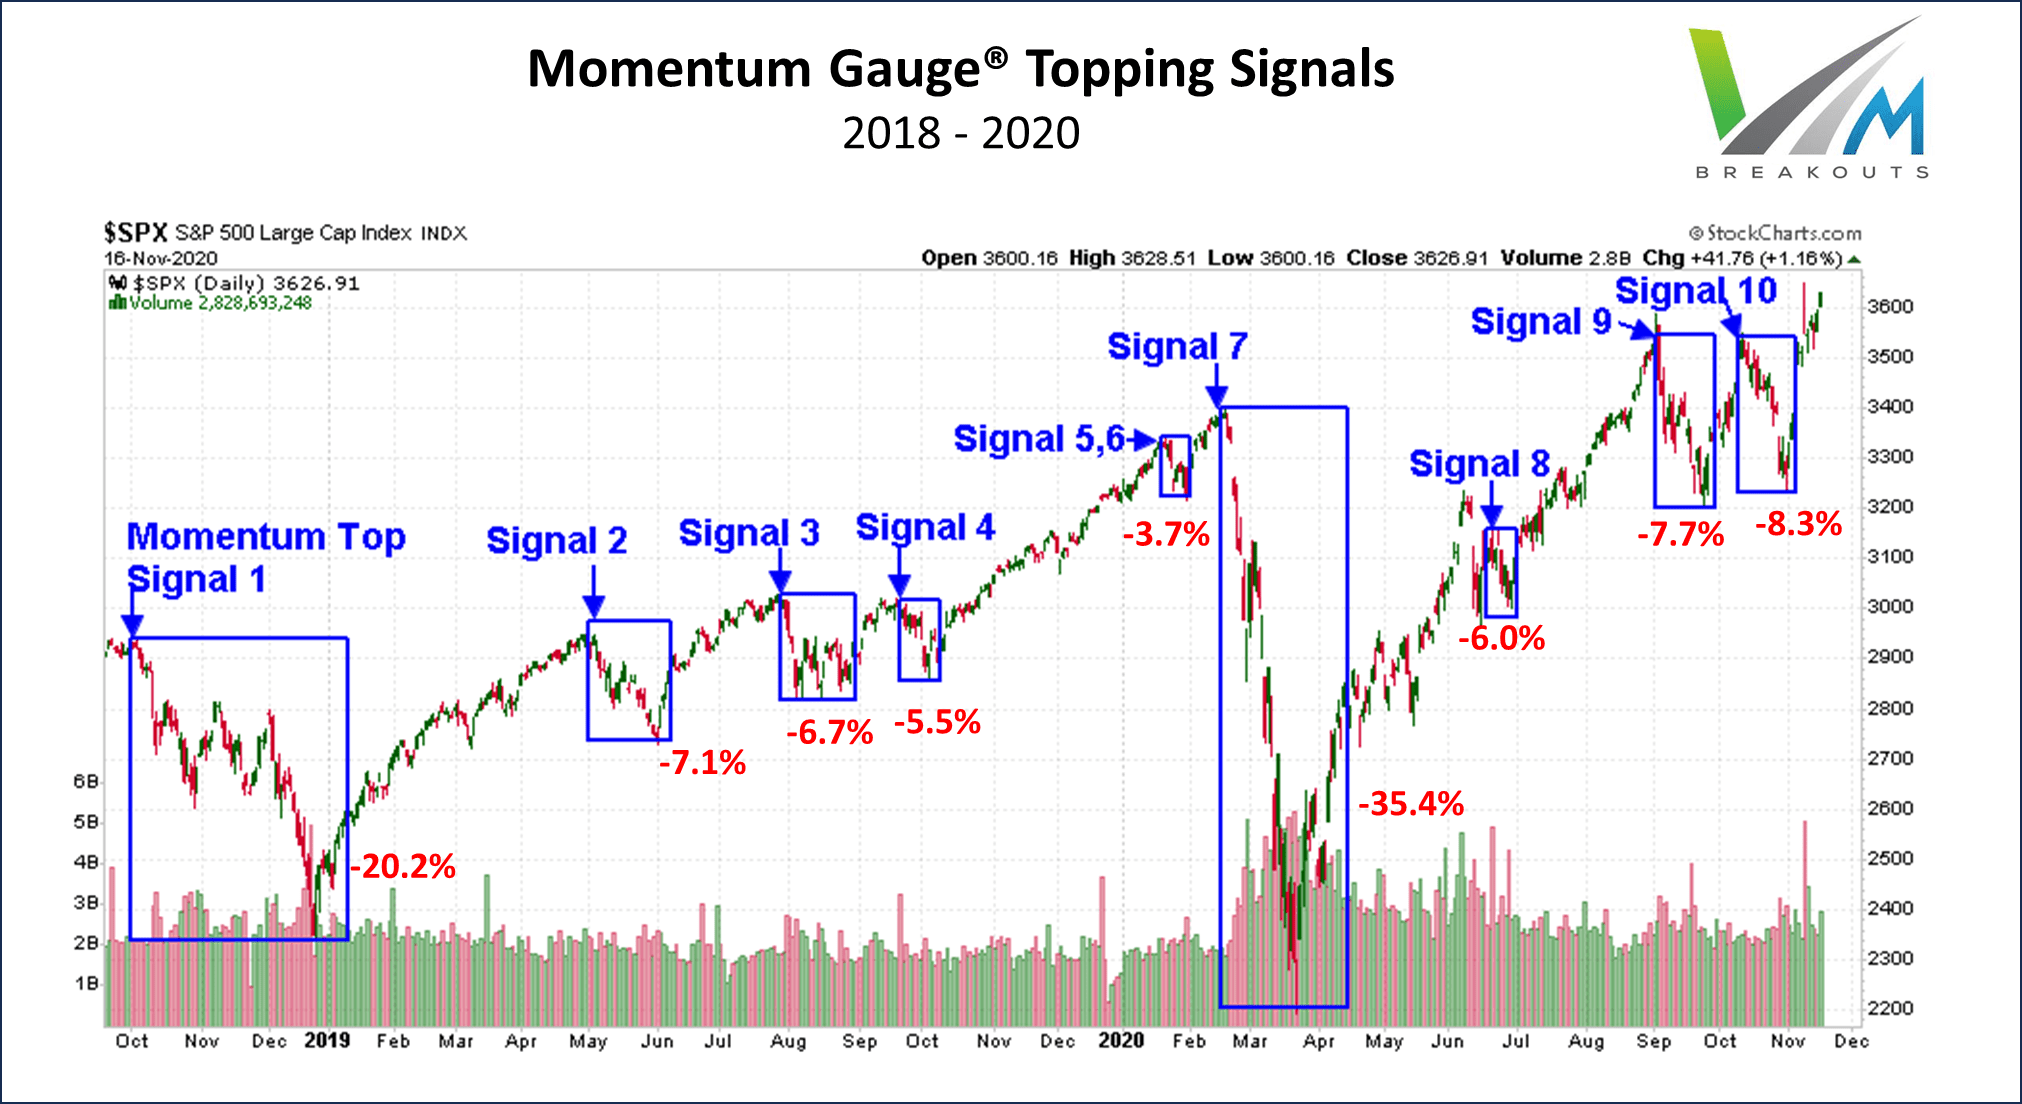
Both the 2018 QT shock and the 2020 Covid correction were significant negative signals on the Momentum Gauges. I believe that as long as the Fed balance sheet does not dip to 2018 levels, we are less likely to see a severe market liquidity reaction.
So in closing this economic-chartfest section of my article, I am led to believe some notable market shifts are coming that will benefit the broader market and value stocks in particular. These charts illustrate to me the potential for much looser monetary policy, not to mention more fiscal “stimulus” programs and deregulation embedded in the “Big Beautiful Bill” set for action starting in January.

I have been surfing on-line more than 3 hours these days, but I never discovered any fascinating article like yours. It is lovely price sufficient for me. In my opinion, if all website owners and bloggers made excellent content as you did, the internet will likely be a lot more useful than ever before.
you could have an incredible weblog here! would you prefer to make some invite posts on my blog?
smile
Hi there, I found your website via Google while looking for a related topic, your website came up, it looks great. I’ve bookmarked it in my google bookmarks.