Persistent REIT Mispricing Presents Opportunity: Gaining An Edge Assessing This Sector
Sep. 22, 2025 9:30 AM ETVanguard Real Estate Index Fund ETF Shares VNQ, SCHH
Dane Bowler

Summary
- REITs are prone to significant mispricing due to their complexity and small market caps, creating opportunities for skilled stock pickers.
- The sector’s complexity stems from diverse property types, varying locations, and inconsistent non-GAAP financial metrics like FFO and AFFO.
- Currently, REITs trade at notable discounts to NAV and earnings multiples, making them attractive compared to the broader market.
- While broad REIT ETFs like VNQ offer value, targeted stock selection within REITs can yield superior returns by exploiting market inefficiencies.
- Looking for a portfolio of ideas like this one?

The market is not fully efficient, with mispricing prevalent across equities. REITs have a particularly high degree of mispricing, with individual REITs both over- and undervalued.
More mispricing means more opportunity for enhanced returns through careful stock selection, but also a higher difficulty.
Let me begin by discussing the factors that have led to persistent mispricing in REITs and then move on to discuss the analytical concepts that can give one an edge in REIT investment.
Why REITs have more mispricing than the broader market
REITs have a high ratio of complexity to size.
Complexity refers to the quantum of knowledge/expertise/resources required to analyze something, while size refers to market cap.
Market cap dictates the quantity of resources that can be allocated to analysis. Massive financial institutions have the resources to fully and properly analyze anything. However, it’s not worth it for them to dedicate resources to small market cap areas because they would not be able to invest a significant portion of their capital there anyway.
These institutions often have many billions to invest, so any position under maybe $50-$100 million would potentially be an irrelevantly small percentage.
An institution cannot invest $100 million in a $1B market cap stock without dramatically altering market pricing. Therefore, they largely stay away from small caps.
REITs as a whole are not very big. On 5/9/25 we calculated the combined market cap of all equity REITs at both the common and preferred levels, and it summed to a grand total of $1.38 trillion.
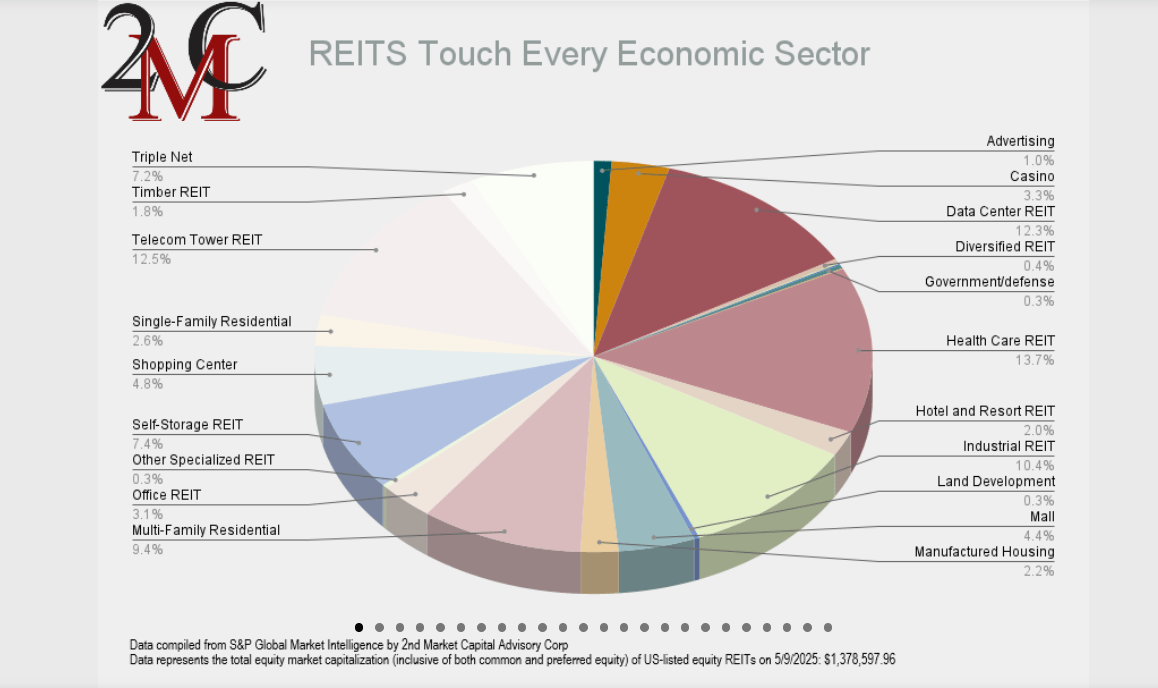
Source: REIT Sector Gallery
A substantial portion of that $1.38 trillion consists of a few very large companies. The top 10 are just about half of the entire market cap of REITs.
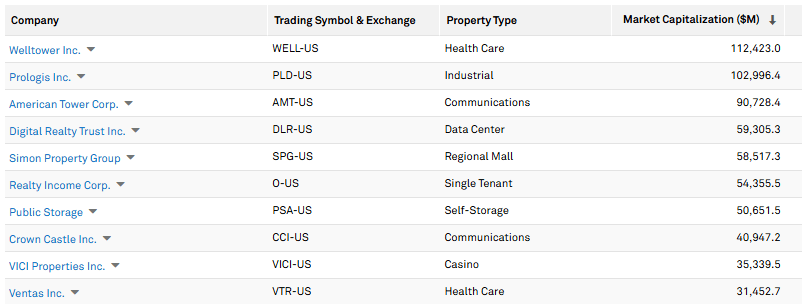
There’s arguably enough institutional attention among these large caps to have somewhat efficient pricing. Institutions can be wrong, and one can potentially still outperform in these names with a unique understanding or a differentiated thesis, but generally the pricing of these particular REITs makes sense.
It’s in the rest of the REIT market where mispricing is rampant. Less than $700B of market cap is split between over 250 common and preferred issues. That’s a tiny average issue size, which, as discussed above, limits the resources that can be spent studying each one.
That small size is made all the more challenging by the immense complexity of REITs.
Complexity factors
Specifically, REITs are challenging to analyze for the following reasons:
- Dozens of property types with distinctly different fundamentals.
- Properties located across 50 MSAs with individual supply and demand aspects
- Non-GAAP financial metrics like FFO and AFFO
- Definitions of non-GAAP financial metrics differ from company to company with minimal standardization
Property types and locations
In our analysis we note 20 distinct property types but it could be broken down much further. Healthcare, for example, actually has hospitals, medical office, assisted living, memory care, independent living, skilled nursing, and a few other smaller categories, but it’s often lumped together as the “healthcare” REIT subsector.
To glean the prospects of a given REIT, one must know not just the property types, but also the location specifics. For example, Houston has a massive amount of new apartments being constructed, while some of the midwestern markets remain undersupplied.
Since REITs often own assets in many different MSAs, there’s a significant knowledge barrier to estimating fundamental trajectory.
Non-GAAP metrics with differing definitions
The accounting rules on property depreciation make earnings and earnings per share almost useless metrics for REITs. GAAP accounting records a roughly 3% annual charge against property purchase price for depreciation, while in reality, the properties may be appreciating or depreciating at a very different pace.
As such, the REIT industry primarily uses non-GAAP metrics for earnings. NAREIT, the third-party governance organization, has defined FFO which is an adaptation to GAAP earnings that takes away gain on sale but adds back property depreciation. For decades, FFO was the dominant metric for valuing REITs.
In recent years, however, Adjusted Funds From Operations, AFFO, has taken over as the preferred metric. In many ways, AFFO is better because it accounts for costs such as recurring maintenance and things like amortization of tenant improvement costs. However, AFFO is not a defined metric, and each company will have their own calculation for AFFO.
Some companies like to sneak in various adjustments to AFFO that make their AFFO higher than what would properly be considered “true earnings.” Specifically, we have come across the following non-standard addbacks:
- Stock-based compensation
- Non-real estate depreciation
- Maintenance capex categorized as growth capex
- Strategic straight-lining (or not straight lining) of non-linear cash flow streams
These adjustments can be as much as 20% of AFFO, and if an analyst is not accounting for them on an individual company basis, it can throw off relative valuation. Many REITs screen as good values but are less appealing when accounting definitions are aligned.
Property level metrics are also industry specific and have differing definitions:
- Net Operating Income (NOI)
- Same-store pool
- Cap Rate (GAAP versus cash) (economic vs headline)
Each REIT has a different definition of what qualifies a property for being included in the same-store pool. Some REITs will start to include properties before they are fully stabilized (due to a loose definition of stabilized). This can artificially raise reported same-store NOI growth as stabilization is essentially being mischaracterized as organic growth.
Looking at the headline numbers, one REIT may report 7% same-store NOI growth while another reports 5%, but the 5% REIT may actually be growing faster. The only way to find out is to dig into each company’s same-store pool definition and also account for capex applied in the relevant period.
Cap rates are also a bit tricky to understand. Not only is the metric inverse, where a higher cap rate means the property is cheaper, but the actual calculation of a cap rate can be done in many different ways. Some REITs report headline or NOI-based cap rates while others use economic cap rates that factor in expected capex. There can also be as much as 200 basis points of difference between GAAP (straight line) and cash cap rates (cash on year 1).
Rampant mispricing in REITs
None of the above complexity factors are insurmountable. Teams of analysts with enough resources can dig through all these factors to obtain really clean cash flows and form legitimate projections from that.
The challenge is that there are very few institutions committing such resources to REITs because market caps are so small.
So, REITs are primarily left with an investor base that’s not equipped with enough time/expertise/resources to properly value them. As a result, market prices are often off by a considerable magnitude. In our experience watching REITs trade every day, market prices often move in groups with minimal differentiation for individual company fundamentals.
In the short term, a REIT’s price movement seems to fluctuate more based on the broad category in which it falls rather than the granular aspects of its individual business. This sort of environment lends itself to greater disparities between market price and fundamental value.
Some REITs are dramatically overvalued, while others can be bought at 60% of net asset value. It’s fruitful territory for stock pickers with the skills to navigate the difficult sector.
General cheapness of sector
Given the lack of granular focus discussed above, REITs have largely traded based on broad macro factors that tangentially affect them. The market broadly believes REITs are adversely affected by interest rates, so the sector has languished since Fed hikes started in 2022. This has left REITs quite cheap relative to the broader market.
Specifically, the median REIT is trading at
- 84.9% of NAV
- 13.5X forward FFO
- 15.3X forward AFFO
Discounted valuation at a time when the overall stock market is priced expensively makes REITs generally opportunistic. As such, I believe one could buy a broad REIT ETF like the Vanguard REIT ETF (NYSEARCA:VNQ) and outperform the market.
However, such an ETF would not take advantage of the rampant mispricing within REITs. ETFs own based on market cap, which makes them dominated by the more efficiently priced REITs. Even among the mid-cap holdings of ETFs, they would hold both the overvalued and the undervalued.
I see far greater opportunity in being a stock picker within REITs.
With enough experience and understanding of the nuances of REIT valuation/accounting, it’s quite discernible which REITs are trading below fundamental value. The future is uncertain, so not every discounted REIT will be a winner, but a portfolio consisting of specifically the underpriced portion of the mispriced REIT universe is well positioned to come out ahead.

I like how you presented both sides of the argument fairly.
You’re doing a fantastic job with this blog.
Your passion for the topic really shines through.
Thank you for offering such practical guidance.
This was very well laid out and easy to follow.