Value Rotation Is Here: How To Position Your Portfolio For Maximum Yield
Feb. 17, 2026
Rida Morwa
Investing Group Leader
Summary
- Hold Safety: We will continue to own “safe” assets like Agency MBS, municipal bonds, and preferred equities.
- We are buying the “fear” in the public market for credit-risk assets. Institutions are willing to pay near par; we can buy them at a discount.
- We are avoiding consumer-dependent dividends (like WEN) in favor of landlords who rent to them (like O).
- Valuation Matters: In a high-valuation market, we will realize gains in expensive stocks to fund purchases in bargain sectors.
- Looking for a helping hand in the market?
- Members of High Dividend Opportunities get exclusive ideas and guidance to navigate any climate.

Co-authored with Beyond Saving
Typically, we spend most of our time talking about individual picks in our public articles. Today, we are going to pull back the curtain and provide an article that is usually reserved for our members at High Dividend Opportunities, where we discuss our view of the macro environment and the trends in the market that are driving our decision-making about which sectors to look into for new opportunities and which positions we want to exit.
So, instead of focusing on exactly which picks to buy, let’s talk about where the market is headed and where we want to look for dividends in 2026.
The Rotation to Value
It is still early, but so far, 2026 has been a year of rotation.
The iShares Russell 1000 Value ETF (IWD) is up 6.3%, while the iShares Russell 1000 Growth ETF (IWF) is down 5.5%:
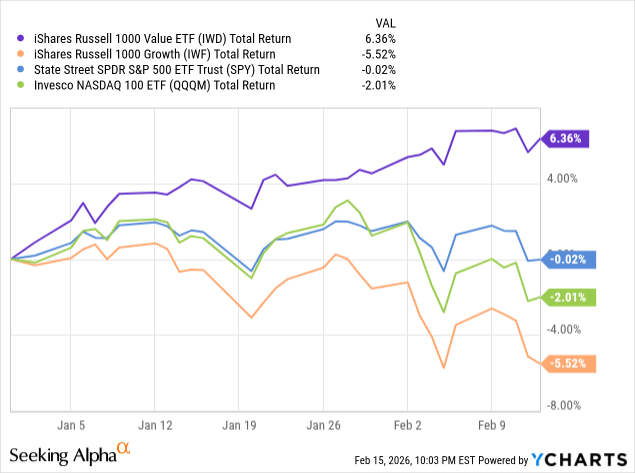
It’s a remarkable shift from last year, where Growth was surging while Value stocks lumbered along.
One month doesn’t make a trend, but there is a sense that the market is cooling on Growth and warming up to Value—but there are also some other notable movements in the market. Today, we want to take a look at the underlying drivers of the market and what that means for dividend investors.
An Emphasis on Safety
As we look at the strongest and weakest price action in our portfolio year-to-date, there appears to be a clear preference in the market for safety. Agency mREITs are up a lot to start out the year, even though they are trading at high premiums to book value.
Additionally, we’ve seen the discounts to NAV shrink for holdings like BNY Mellon Municipal Bond Infrastructure Fund, Inc. (DMB), which was trading at a 10% discount to NAV at the end of December and is now trading at just a 5% discount.
We see reliable dividend growers like Realty Income (O) and Enterprise Products Partners (EPD) seeing some positive momentum after a fairly flat 2025.
Essentially, the holdings in our portfolio that focus on safe credit assets or physical assets like commodities are performing the strongest.
On the other side of the coin, we are seeing credit risk holdings underperforming. In our portfolio, that primarily means BDCs and CLO funds have been flat to down.
While we continue to believe that credit losses are likely to remain relatively low, there is fear in the equity markets that is being reflected in the price action of businesses and funds that are exposed to credit risk.
This fear isn’t being shared among institutions.
Public vs. Private Credit Concerns
Among many assets, there is a huge discrepancy between what the publicly traded stock market is willing to pay for assets and what institutions are willing to pay.
We’ve seen this in several scenarios in our portfolio. For example, SoftBank (SOBKY) is buying DigitalBridge (DBRG) and taking it private for over a 50% premium to its trading price before the rumor. Apollo Commercial (ARI) announced a deal to sell its entire loan portfolio for 99.7% of its carrying value, while the market was pricing in a 20% discount because it feared the credit risk. Even Realty Income has observed that private capital was willing to pay more for real estate assets and is opening up a fund that the public company will manage.
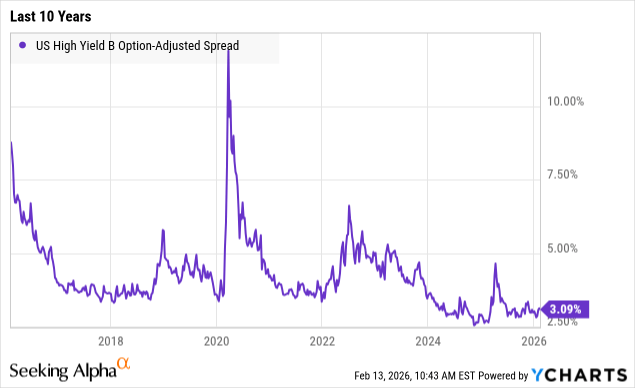
Here is a look at High Yield B Option-Adjusted Spreads. This is the spread that B-rated loans are getting over the benchmark; lower means that institutions are pricing in less default risk:
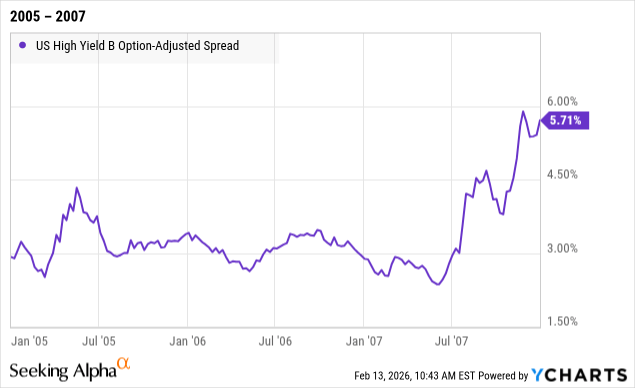
For some context, this is what this metric looked like going into 2008, before the S&P 500 started declining:
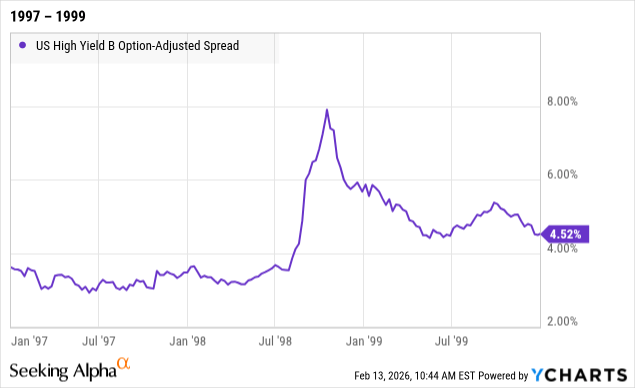
And here is what it looked like before the dot-com bust:
These spreads are primarily influenced by the supply and demand balance between lenders and borrowers. The B spreads are the most sensitive because it is a credit rating that implies higher risk, but it doesn’t imply that there is distress going on right now. If there are a lot of lenders looking to deploy capital relative to companies looking to borrow, spreads will be lower, and they will accept a lower yield. If there are few lenders relative to the number of companies looking to borrow, then the spreads get higher. This is often indicative of either lenders having a lack of liquidity or lenders deciding that lending money to B credits is too high of a risk.
As a result, it can often serve as the canary in the coal mine, with spreads often widening considerably before a recession starts and even before the stock market declines.
These markets are dominated by institutions, whereas in the stock market, there is significant participation among retail investors. In the stock market, we’re seeing many of our credit-risk-exposed holdings trading at steeper discounts or lower premiums than they have in the past.
Soft Fundamentals
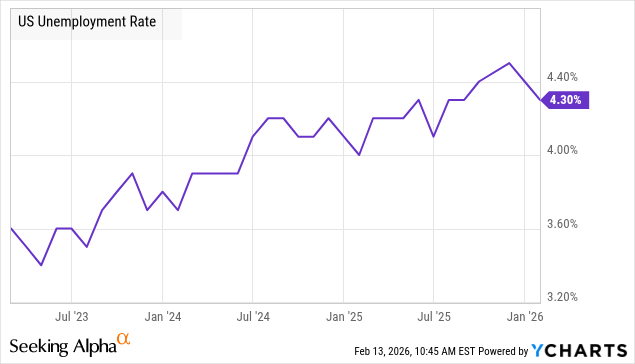
As we’ve been documenting over the past several years, the fundamentals of the U.S. economy have been getting weaker. Unemployment has been rising steadily for three years:
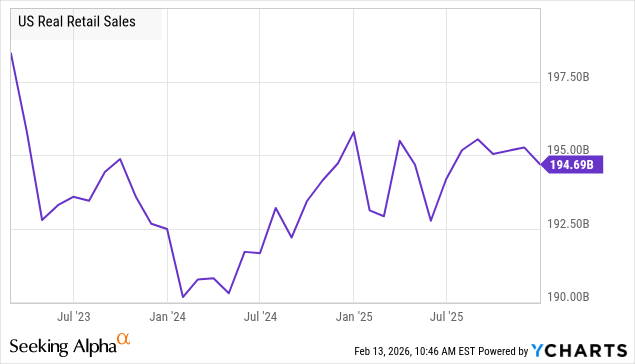
Real Retail Sales (adjusted for inflation) have been relatively flat:
Consumers are feeling the squeeze with Real Personal Disposable Income growth slowing down:
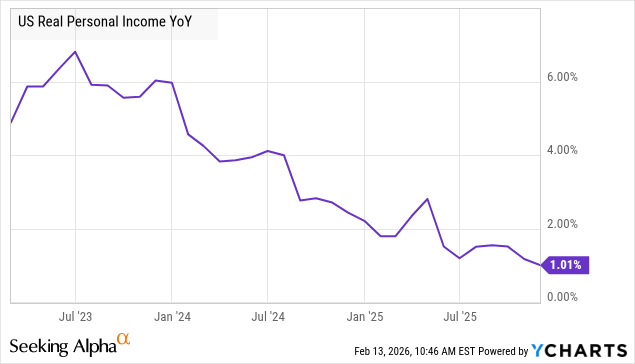
Historically, this metric has averaged over 3%.
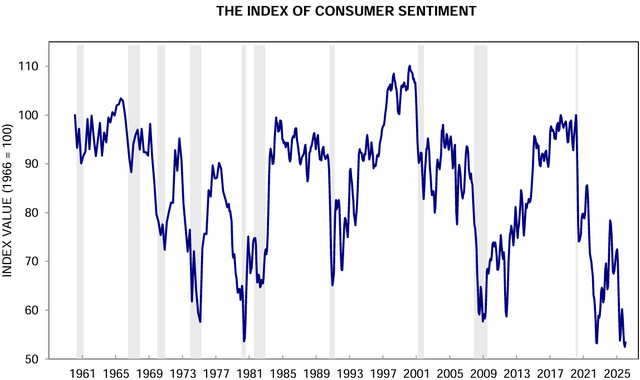
Consumer confidence continues to decline and, as measured by The Conference Board, is at COVID-era lows: Source
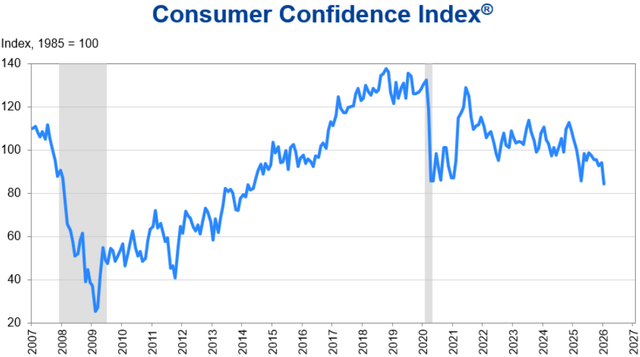
Where the Conference Board reported a sharp drop in January, a similar survey conducted by the UoM (University of Michigan) has a small uptick. However, the UoM survey was already far more bearish, with consumer sentiment near all-time lows: Source
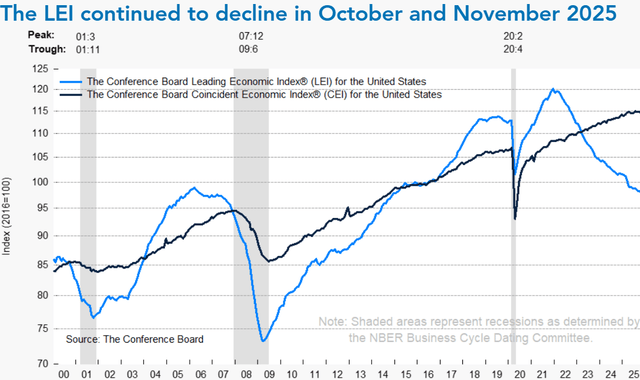
Leading economic indicators continue to decline: Source
While there are undeniably some hotspots in the economy, like the huge investment being made in data centers, it is one hot sector that is surrounded by a lot of weakness.

Leave a Reply