You did not have to take a big gamble with your hard earned, just to be in the right shares and do nothing.
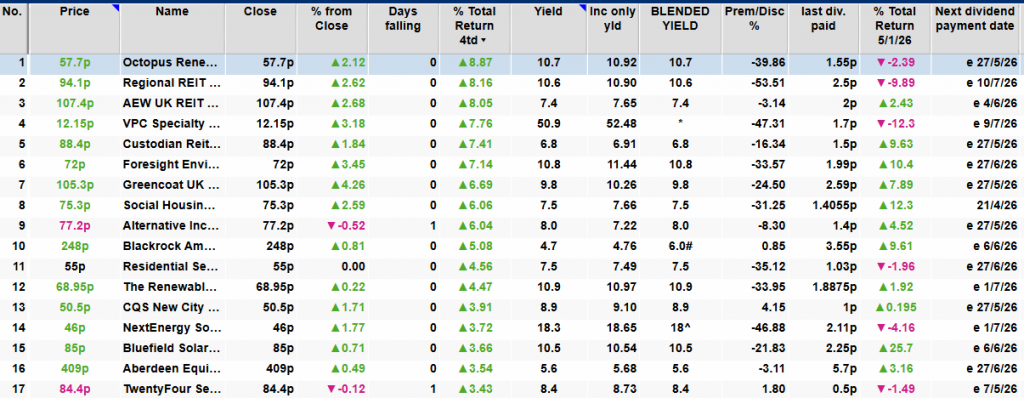
The current yields maybe too low to include in your Snowball, unless you pair trade it with a higher yielder and still earn a blended yield of around 7%
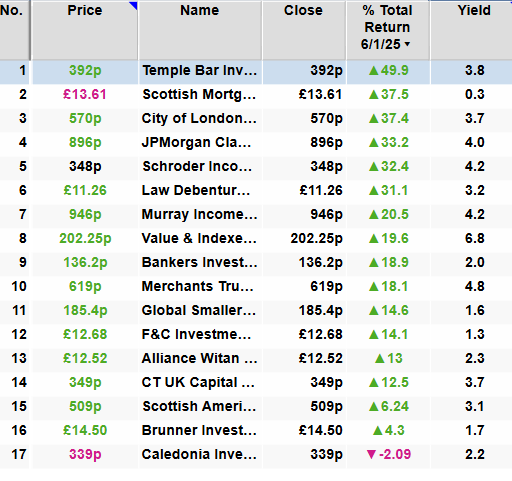
Before we go back to the future and look at CTY during the covid crash, looking at the return on capital, investing is going to get a lot more difficult, maybe that could explain the latest interest in buying shares that pay a dividend as that may make up most of any returns.
The dividend was 19p, so when the price was 440p the yield was 4.3%.
After the price fell to 300p the yield was 6.3%, without the benefit of hindsight you had no way of knowing if the price was going to continue to fall but you could have bought the yield, as the intention was to hold forever.
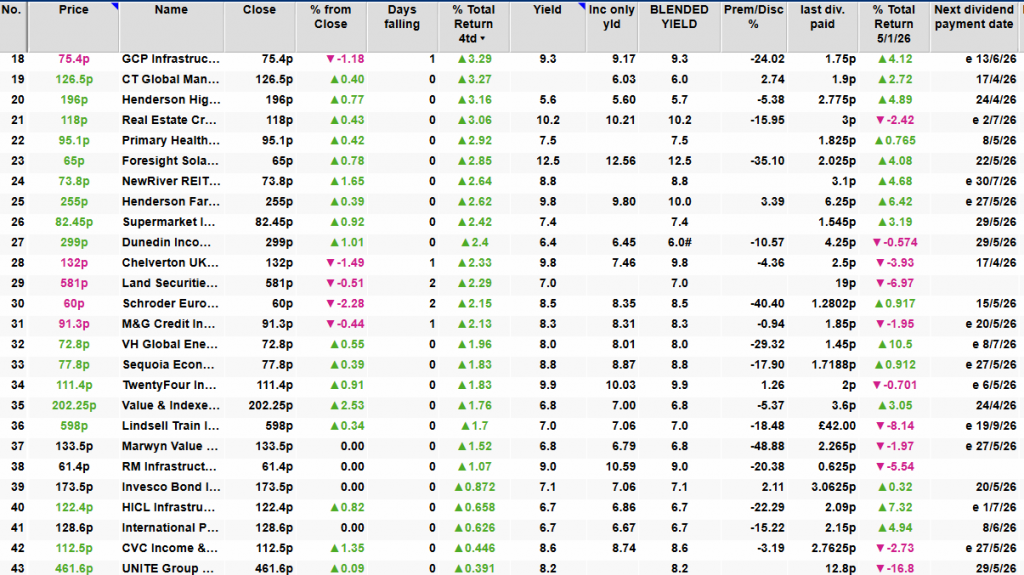
The current dividend has gently risen to 21.6p, a yield on buying price of 7%, which should continue to rise as long as you hold the share.
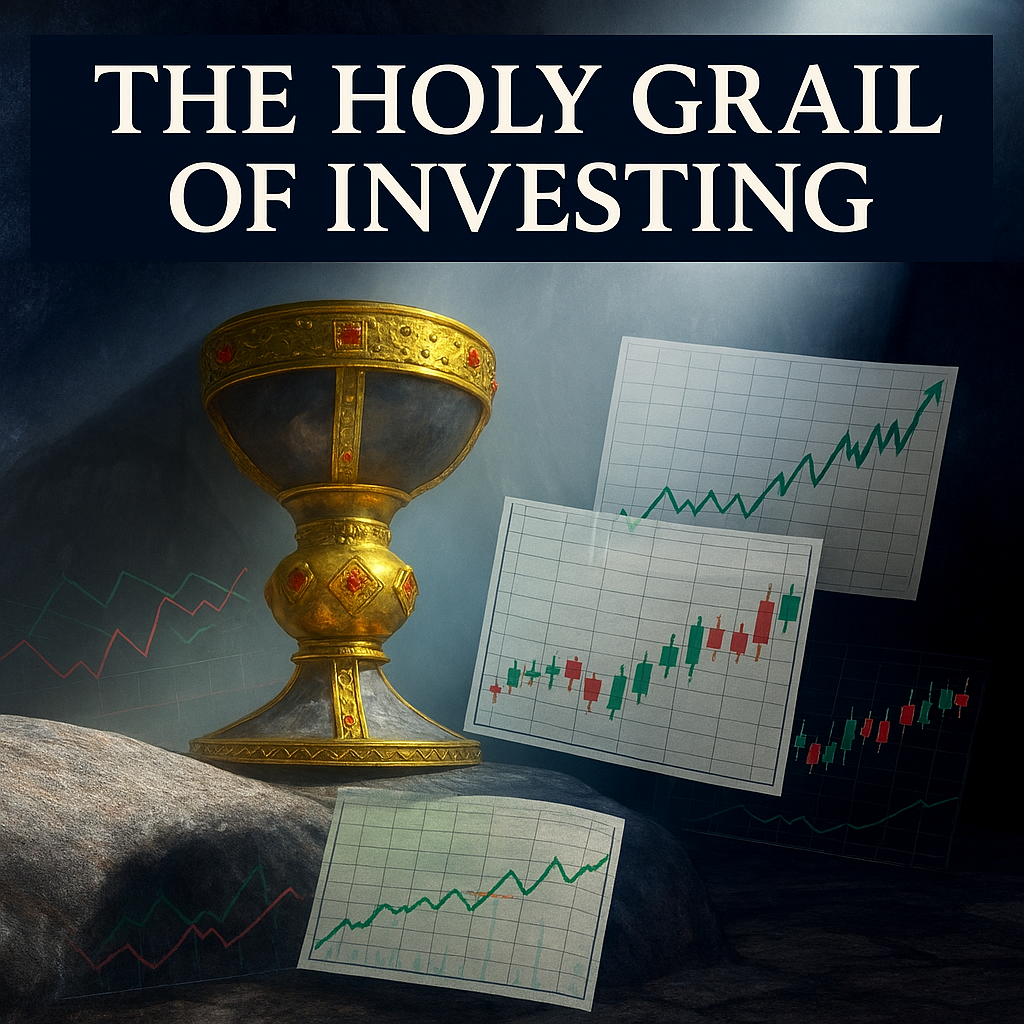
You would have also achieved the Holy Grail of Investing, in that you could take out your stake, invest in another high yielder and continue to earn income on a share that sits in your Snowball at zero, zilch, cost.
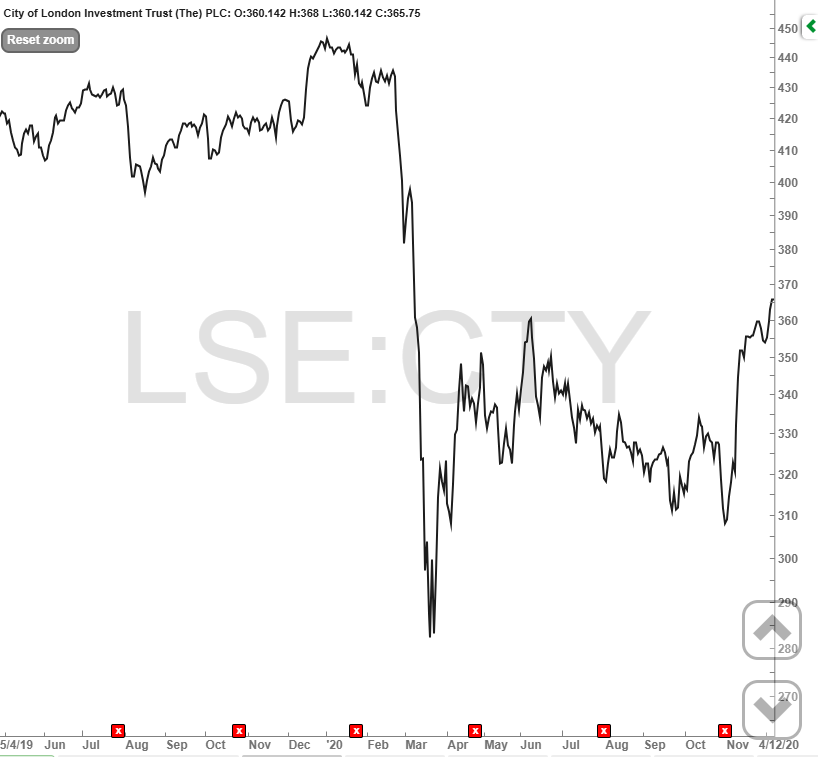
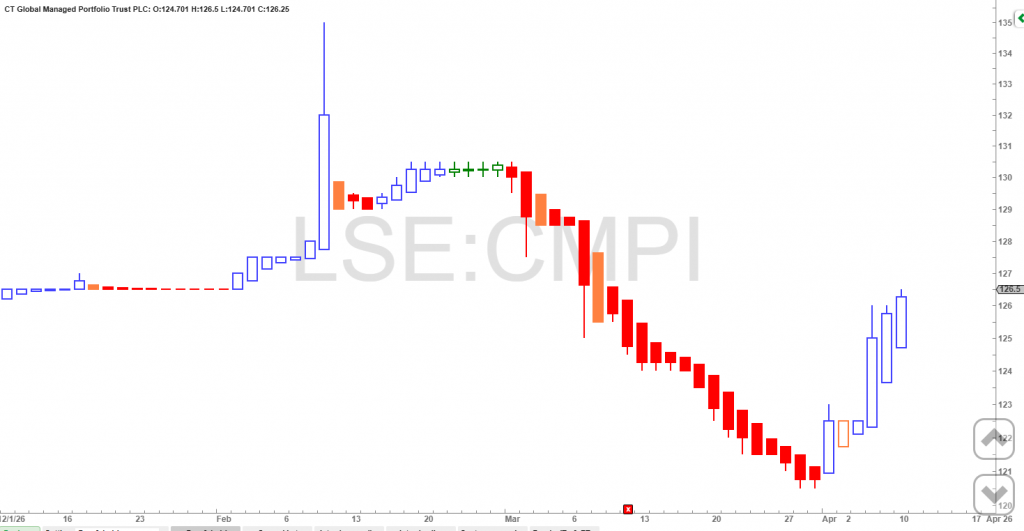
A picture conveys a thousand words, the chart shows what turned out to be a blow out top and captures the market retrace.
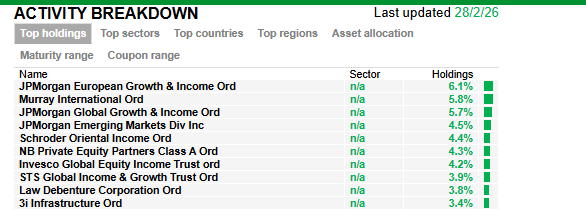
The Trust owns numerous Investment Trusts that pay a dividend, so diversification away from Renewables.
The current yield is 6% and because the yield is one of the safest in the market it normally trades at a small premium, also the spread can widen.
Although a boring Trust, as traded volumes are low, it still captured a lot of last year’s price action and rose 29%, although the intention is to hold forever you could have taken out your profit and invested in another higher yielder in your Snowball.
Hey this is kinda of off topic but I was wanting to know if blogs use WYSIWYG editors or if you have to manually code with HTML. I’m starting a blog soon but have no coding expertise so I wanted to get guidance from someone with experience. Any help would be greatly appreciated!
No coding required, if you can copy and paste you are good to go.
In time of trouble property can be a safer holding.
General guidance, not a substitute to DYOR.
Property values generally fall when interest rates rise as any future borrowing will be at a higher rate than current, therefore leaving less cash to payout in dividends.
You can buy property Trusts for discounted pounds.
Some Trusts post their NAV and therefore their discount to NAV is apparent, other REIT’s are companies and you need to compare their NAV value to their current capital value.
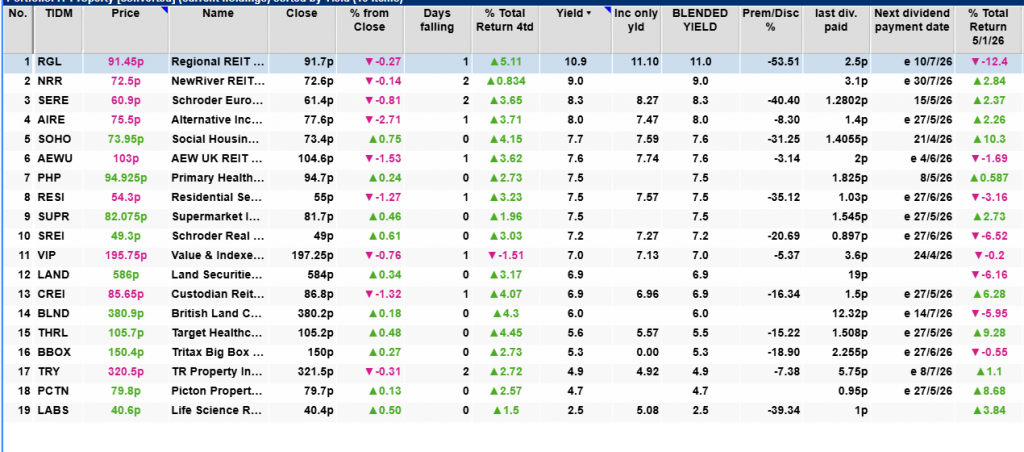
Any REIT with a progressive dividend policy may be worth researching around the 7% yield mark, especially if you are building a position with earned dividends as you don’t want the price to rise and the yield to fall until you have completed your buying.
RGL has been a very disappointing holding, leopards and spots but there is some research copied to the SNOWBALL which could, if you are an optimist, indicate that the worst is behind them.
AIRE, LABS are in a bid situation.
SERE has a French tax unresolved dispute, so DYOR.
NRR only pays two dividends a year, so there could be an opportunity to buy just before their xd date.
VIP sometimes trades on a wide spread.
etc., etc.
As the intention of the SNOWBALL is to hold forever, if you buy a property Trust and the value falls it’s of no consequence as long as the dividends are still paid.
A bedrock of stability But some investors weather these things better than others. And I don’t mean those who flee to cash or bonds at the first sight of trouble. Making calls like that is very, very difficult – and even the professionals have only patchy records of success.
The investors I’m talking about are those investors whose portfolios – while they might drop – fall in value nothing like the fall experienced by the broader market as a whole.
Investors whose dividend income streams continue more or less unabated, experiencing only minor turbulence, if any.
Investors who sleep easily at night, and who don’t experience that ‘sick to the stomach’ reaction every time they switch on the news, or – worse – take a look at their investment portfolios.
And who are these investors, precisely?
Investors with a solid exposure to defensive shares, in short. They might not be ‘all in’ on defensive shares – everyone likes growth, after all – but they’ve got defensive shares at the heart of their portfolios, creating a bedrock of stability and resilience.
Steady as you go So, what exactly are defensive shares? It’s not difficult.
Simply put, a defensive share is a business for which revenues – and profits – hold up pretty consistently, whatever the economic weather. Bad times, good times, and everything in between.
Clearly, that’s good news in bad times. Sales and profits continue to chug along, quite happily. Customers might be a little more price-sensitive, and perhaps not buy quite as much, but whatever the product or service that the business provides, they continue to rock up and buy it.
In short, whatever that product or service is, when it comes to customers’ budgets, it comes from non-discretionary spending.
Equally, though, there’s often less welcome news in good times. Those same customers don’t necessarily buy more of whatever it is. They might be a little less price-sensitive, and maybe buy a little bit more, but overall, demand remains fairly steady.
The charm of non-discretionary expenditure So what sort of companies, exactly, comprise defensive shares?
The key here is to think of companies that sell products or services that come from their customers’ non-discretionary expenditure. People have to eat, for instance, so a supermarket such as Tesco is a good example of a defensive share.
Food manufacturing is also in the frame, especially where there’s a decent ‘moat’ involved: Tate & Lyle would be an example, too. Unilever fits the bill, too – although the recent sale of its various food businesses (think Knorr, Marmite, Colman’s and so on) takes some of the shine off. Nevertheless, the remaining personal care portfolio is still largely defensive.
Ditto companies in the pharmaceutical and personal care sectors generally. Global giant GSK was a superb example, and is still strongly defensive, but the various consumer toothpaste and over-the-counter brands that were hived off into Haleon were a distinct loss from the standpoint of its defensive qualities. AstraZeneca and Reckitt Benckiser are also superb examples of defensive businesses.
More generally, well-chosen Real Estate Investment Trusts can possess excellent defensive qualities. Primary Health Properties, for instance, owns and leases out doctors’ surgeries – over 1,100 of them at the last count. Tritax Big Box, too, is worth a look, owning and leasing out the vast distribution centres that power the supply chains of clients such as Tesco, Amazon, Sainsbury’s, Morrisons, and Marks & Spencer.
But enough: you get the idea, I’m sure.
Boring but dependable So there we have it. In uncertain times, boring but predictable businesses that sell products or services that people dependably buy, whatever the economic climate, are a sensible underpinning for just about any portfolio – especially for older or more risk-averse investors looking for a decent income stream.
Until next time,
Malcolm Wheatley Investing Columnist, The Motley Fool UK
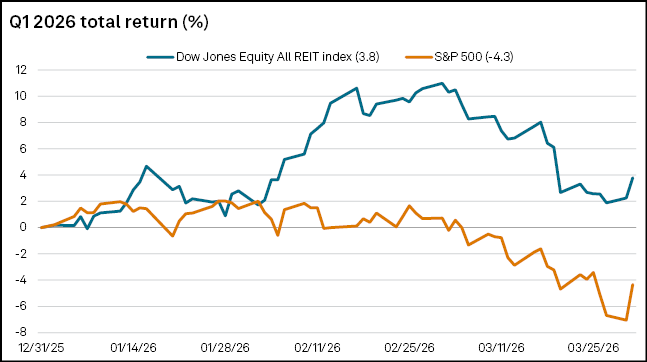
REITs outperformed the broader market in Q1 2026, supported by a rotation away from large-cap tech stocks.
As the markets and risk sectors rally on positive geopolitical news, this could be a good opportunity to add REITs on any rotational related weakness.
Geopolitical events and midterm elections may usher in more volatility, I highlight three REITs with strong AFFO growth and well-covered dividends in industries riding favorable tailwinds.
REITs can provide steady income and potential downside resilience in volatile markets. My three picks have an average trailing 12-month dividend yield of 6.9% versus roughly 1.2% for the S&P.
I am Steven Cress, Head of Quantitative Strategies at Seeking Alpha. I manage the quant ratings and factor grades on stocks and ETFs in Seeking Alpha Premium. I also lead Alpha Picks, which selects the two most attractive stocks to buy each month, and also determines when to sell them.
Torsten Asmus/iStock via Getty Images
REITs Outperform as Discounted Valuations Attract Income Investors
REITs outperformed the broader market in the first quarter of 2026, supported by discounted valuations, the rotation away from big tech, and improving expectations for interest rate cuts. Performance was pressured later in the quarter by elevated volatility tied to the Middle East conflict and shifting rate expectations, but most subsectors ended the quarter in positive territory, while 33 REITs have raised their dividends so far this year, some by double-digits.
S&P Global
Markets rallied and Treasury yields fell on Wednesday after the U.S. and Iran agreed to a conditional ceasefire framework, led by tech, industrial, and cyclical stocks. Any near-term rotation could create opportunities to buy REITs on the dip, while positioning for volatility tied to geopolitical developments and the upcoming midterm elections. In that environment, REITs can offer relatively steady income and potential downside resilience.
Reliable income, attractive valuations, and structural demand drivers are key reasons SA Analyst Brad Thomas believes it is time to overweight REITs, although he warned that not all REITs are created equal:
REITs are not a monolith. They are a collection of businesses – some average, some exceptional – and the key is to identify durable cash flows, strong management teams, competitive advantages, and intelligent capital allocation. As much as I love REITs, I would not recommend putting all your eggs in one basket.
Backed by tangible assets and contractual revenue streams, REITs can offer durable income to potentially stabilize a portfolio amid elevated volatility and sticky inflation. Investors seeking exposure to REITs can use Seeking Alpha’s quantitative tools to find investments offering solid yields supported by strong fundamentals.
How I Chose Top 3 Strong Buy REITs
Using Seeking Alpha’s REIT Screener, I identified 3 Strong Buy REITs showcasing strong AFFO growth, well-covered dividends, and diverse industry exposure. My three picks offer forward yields of 4.2% to 10.9%.
Seeking Alpha’s Quant REIT Ratings are generated by a proprietary model that analyzes more than 100 metrics for each REIT relative to sector peers and assigns grades across five factors: Growth, Value, Profitability, Revisions, and Momentum. The ratings incorporate key REIT-specific metrics such as FFO, AFFO, FAD, and gross properties. Separate Dividend Grades evaluate each REIT’s payout based on Safety, Growth, Yield, and Consistency relative to sector peers.
In the section below, I highlight context, recent developments, and key metrics supporting each REIT’s Quant Rating.
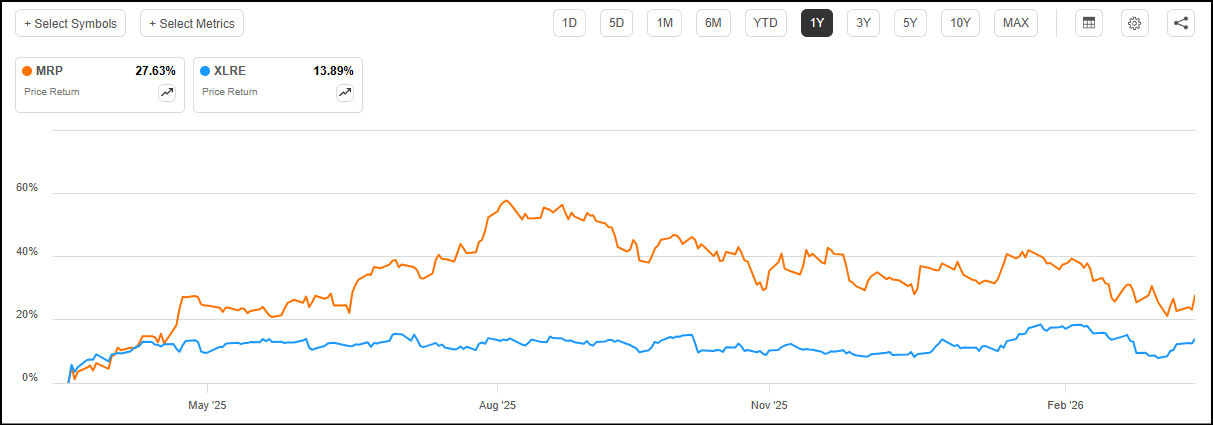
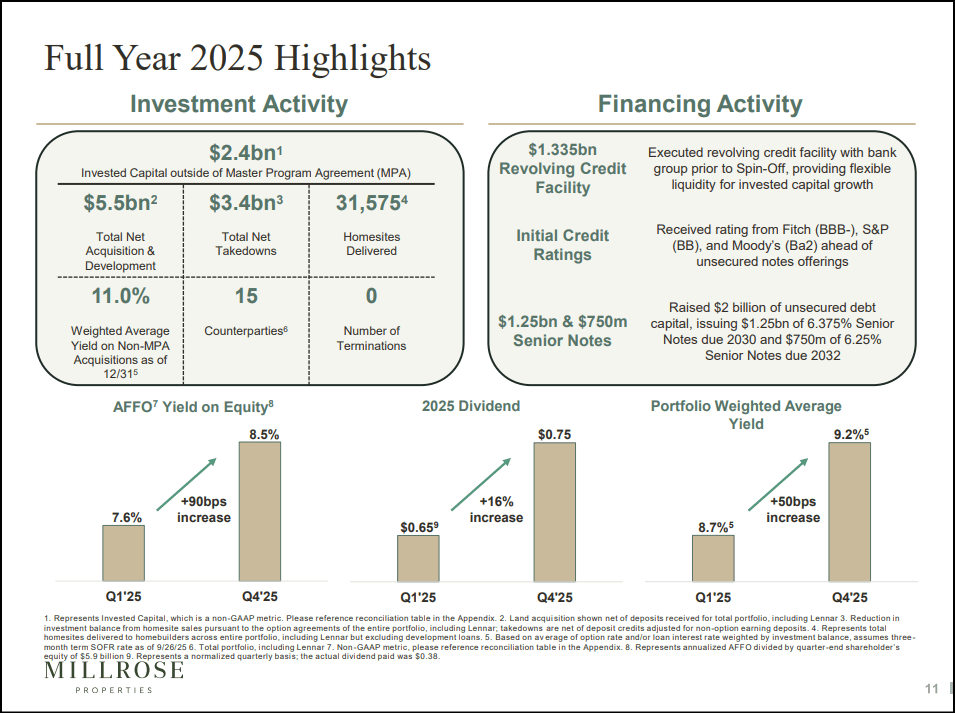
Spun out from homebuilding giant Lennar Corporation (LEN) in 2024, Millrose Properties is a homesite option platform for residential homebuilders with 142,139 homesites in its portfolio across 30 states. Targeting a total addressable market exceeding $170B, Millrose’s business model is benefiting from structural tailwinds as U.S. housing inventory remains near historical lows and homebuilders increasingly seek financing solutions to secure land.
MRP vs. S&P 500 Real Estate Sector (XLRE): 1Y Price Return
Seeking Alpha
In FY 2025, its first year as a public company, Millrose navigated affordability headwinds and macro uncertainty to deliver 31,575 homesites while topping AFFO guidance as the structural need for housing capital remained unchanged. Invested capital outside the Lennar Master Program Agreement reached $2.4B, generating yields of 11.0%, while reporting zero option terminations across the portfolio.
Driven by a strong pipeline and improving backdrop, Millrose expects AFFO to grow by 10% in FY 2026, and invested capital outside the Lennar MPA to increase by an additional $2B, CEO Darren Richman said in the earnings call:
2025 was a defining year for Millrose. Despite a cautious homebuilding environment, we were embraced across the industry with a reception that exceeded even our own expectations, validating both the concept and our team’s execution. 2025 proved the model. 2026 is where we intend to begin showing its full potential. We believe we have the platform, the pipeline, the partnerships and the track record, and we are just getting started.
According to consensus estimates, Millrose FFO is projected to grow by nearly 30% in FY 2026, backed by bullish sell-side analyst revisions in the past 3 months. Strong FFO margins, cash flow, and return on capital drive an A+ Profitability Grade.
Millrose REIT Investor Presentation
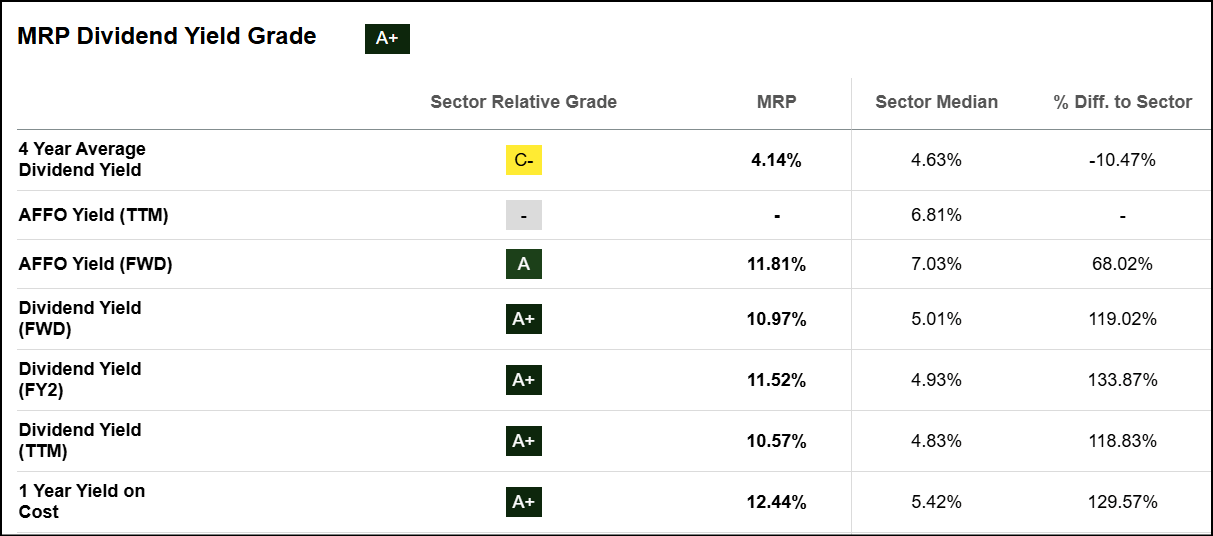
Millrose offers a dividend yielding 10.97%, which is expected to grow in the next two years, supported by strong cash flow generation and AFFO. Exceptional FFO interest coverage and conservative leverage underpin Millrose’s ‘A’ Dividend Safety Grade, which measures a company’s ability to continue paying the current dividend amount.
Seeking Alpha
Although Millrose has increased its dividend each quarter since initiation, its relatively short payout history weighs on the Dividend Consistency Grade. However, the score is likely to improve as the company establishes a longer record of payments. Millrose is trading at a 43% discount to the sector based on a forward price-to-AFFO of 8.6x vs. the sector’s 15x for an A+ Valuation Grade. A high yield, robust AFFO, and strong growth prospects make MRP my top REIT pick.
DiamondRock Hospitality owns 35 premium quality hotels concentrated in urban gateways and resort destinations under leading global brands such as Hyatt, Marriott, and Hilton. The portfolio covers 26 geographic markets with 45% of EBITDA deriving from the top five: Boston, Chicago, New York City, the Florida Keys, and Fort Lauderdale.
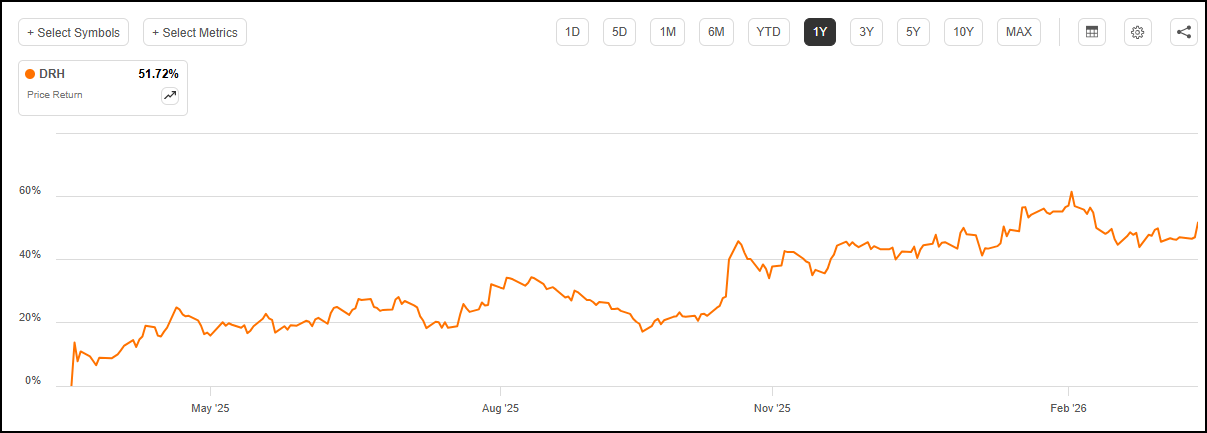
DRH has crushed the market in the past year, alongside top small-cap peers, driving an A- Momentum Grade, as leisure demand remains robust and consumer spending resilient. DRH dipped after the conflict in the Middle East escalated, offering a buying opportunity as it trades at an attractive valuation.
DRH 1Y Price Return
Seeking Alpha
Stronger than expected transient demand and out-of-room spending, offsetting the impact of the government shutdown, helped drive growth in RevPAR, FFO, and net income in FY 2025. Although the political and economic backdrop warrants caution, DRH sees several favorable factors supporting a positive outlook in 2026, including key markets hosting the majority of FIFA World Cup matches, America 250 celebrations, and post-renovation tailwinds.
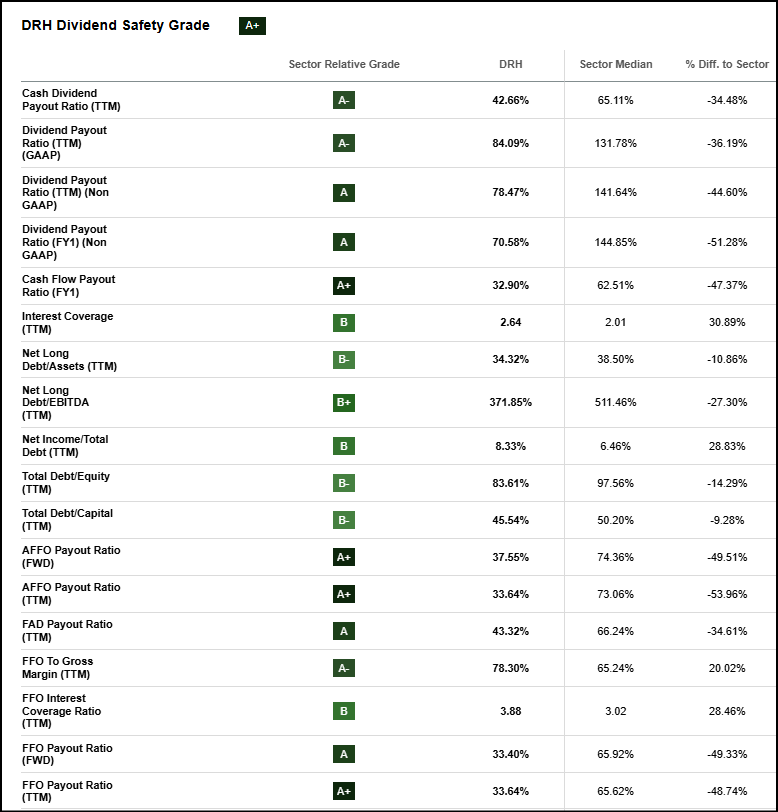
FFO is expected to grow steadily in the next three fiscal years while strong cash flow and AFFO drive an A- Growth Grade, along with a dividend that surged by a CAGR of 60% in the past 3 years. DRH offers a safe dividend yielding 4.25%, supported by payout ratios significantly lower than the sector and solid interest coverage.
Seeking Alpha
DRH is trading at only 9x forward AFFO for a solid Valuation Grade, supported by attractive trailing EV/EBITDA and price/rental revenue multiples relative to sector peers. DRH is a solid addition to my Strong Buy REIT basket, showcasing a visible FFO growth path and well-positioned to ride industry tailwinds in key markets in 2026.
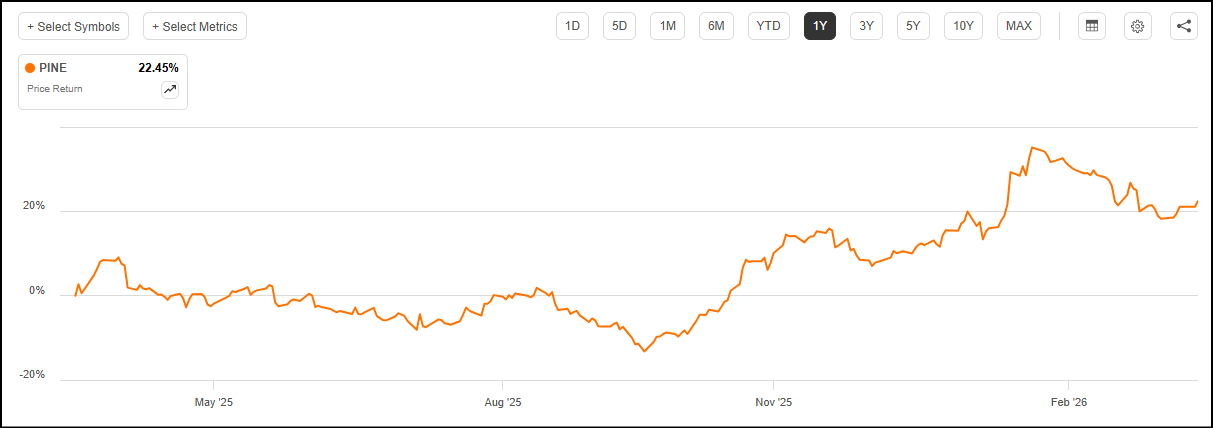
Alpine Income Property Trust owns and operates 127 net lease properties in 33 states, featuring top franchises such as Lowe’s Companies, Inc. (LOW), DICK’S Sporting Goods, Inc. (DKS), and Walgreens. Alpine offers a stable income profile, supported by a 99.5% occupancy rate with a Weighted Average Remaining Lease Term of 8.4 years.
PINE 1Y Price Return
Seeking Alpha
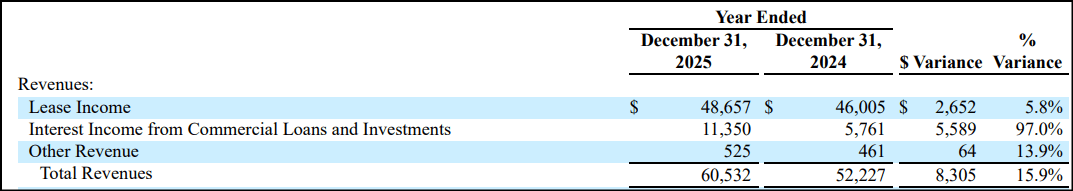
PINE grew AFFO by 22.7% YoY in Q4 2025, and +8.6% for the full-year, while completing a record $277.7M in investments, including $177M in commercial loan originations and $100.6M in 13 property acquisitions. Annual revenue grew by 15.9% YoY to $60.5M, primarily driven by a sharp increase in interest income from commercial loans and investments alongside modest growth in lease income.
PINE FY 2025 Revenue by Segment
Alpine Income Property Trust 10-K
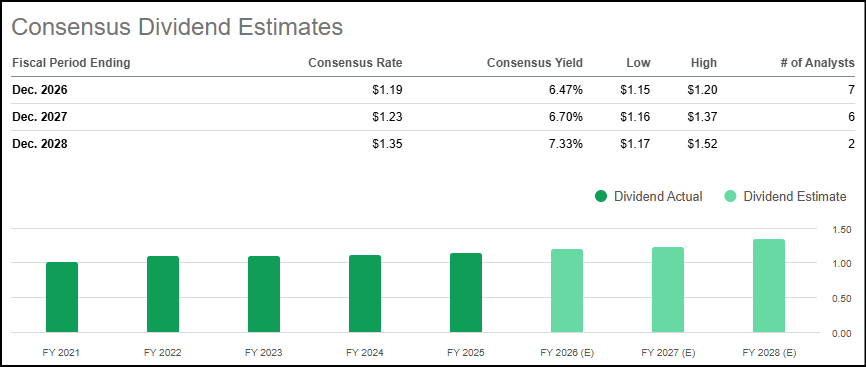
According to company guidance, Alpine expects even more growth in 2026, with AFFO estimated to increase by double digits. The results contributed to strong forward AFFO growth, driving an ‘A’ Growth Grade, supported by bullish long-term FFO estimates from sell-side analysts. PINE offers a fast-growing and consistent dividend yielding 6.53% with a 5Y growth rate of +6%. It is projected to continue growing for the next three fiscal years, adding support to an A- Dividend Growth Grade. PINE has paid out a dividend for six consecutive years – including 6 straight years of growth.
Seeking Alpha
Despite surging momentum in the past year, PINE is trading at 8.7x forward AFFO, driving an attractive valuation. PINE wraps up my basket of Strong Buy REITs for volatile markets, showcasing strong collective fundamentals, high growth, and solid yields.
3 Strong Buy REITs For Reliable Income
REITs were crushing the market to start off the year, supported by hopes of easing interest rates and a rotation out of stretched tech stocks. Although returns were compressed by the volatility fueled by the Iran war, most REIT subsectors finished Q1 2026 in the green, outperforming the broader market. REITs can offer durable cash flow streams and a potential hedge against inflation, but investors should ensure dividends are backed by strong fundamentals. SA Quant identified three REITs with strong AFFO growth and average dividend yields of around 7%.
Renewable Energy Infrastructure Inv Trust 80.3% UK Equity Income Inv Trust 10.3% Property – UK Commercial Inv Trust 8% Debt – Direct Lending Inv Trust 1.4%
The SNOWBALL is currently overweight in Renewables as that is where the current high yields are available. With several Trusts declaring they are winding down/up, this may prove a problem in the long term. In the short term, it could be a positive as more investment cash chases fewer opportunities.
The market wisdom is that when the perception is interest rates are rising property and debt are two sectors to avoid, although if prices fall and yields rise it could be an opportunity to avoid ‘secure’ yields above 7%
Equity Income as it yields below 7%, the SNOWBALL will maintain the current percentage.