Incredibly, the FTSE 100 just completed 11 days of positive gains. This was the blue-chip index‘s best run since 2019 !
The Footsie tanked in early April when President Trump’s sweeping tariffs announcement threatened to send the global economy into a tailspin. Since then though, there have been rowbacks and pauses from the US administration. This has calmed markets, at least for now.
Specifically for the FTSE 100, it means the index has nearly clawed back all the losses following Trump’s announcement. I certainly didn’t expect 11 days of gains, proving once again how utterly unpredictable markets can be in the short term.
Damage might already be done
But we’re not out of the woods just yet. The 90-day pause on most ‘reciprocal’ tariffs ends in July. Depending on what happens then (or before), the index could pull back sharply or keep climbing to notch new record highs. It’s a bit of a coin toss.
Moreover, there will already damage done to global growth from all the uncertainty. How much damage we don’t know yet, but the 10% blanket tariff is still in place, as is the extraordinary 145% duty on goods from China.
At the price of 400p, the dividend was 26p a yield of 6.5%.
Latest full year dividend 33.5p a yield on the buying price of 8.25%
A current yield of 3.76% trading at a small premium
You have doubled your capital invested, which could now be withdrawn, leaving a share in your Snowball producing income at a cost of zero, zilch, nothing.
You also have received the dividends which could have been re-invested back into the share until the yield fell and then switched to investing in another high yielding Trust.
Sadly Mr. Market didn’t give you another chance to buy but one to keep in your watch list, if the opportunity arises.
IPS Highlights
·
The Company’s wholly-owned provider of professional services is a key differentiator to other investment trusts and offers additional portfolio flexibility.
·
Accounts for c.19% of 2024 NAV but has funded approximately one-third of dividends paid by the Company in the last 10 years.
·
IPS has now delivered seven consecutive years of mid to high single digit underlying growth, with a 5 year underlying PBIT CAGR of 7.3%.
·
2024 valuation of £194.5 million (excluding net assets), up 83.6% since 2019.
·
Non cash goodwill impairment of £17.0 million on the 2021 acquisition of CSS.
Awards
Winner in the Active-Income category for the third year in a row at the 2024 AJ Bell Investment Awards.
Winner of the Best for Long-Term Income award at the QuotedData awards.
Recognised by the AIC as an “ISA Millionaire” performer
Depending on when you bought, you have nearly achieved the holy grail of investing that you have doubled your money.
As most of the profit is in earned dividends, most probably best to use the share as a milk cow and invest the dividends into another higher yielding share. Once you have received all your capital back in the form of dividends you will have a share in your Snowball producing income at zero risk.
Real Estate Credit Investments Limited (RECI) is a closed-ended investment company which originates and invests in real estate debt secured by commercial or residential properties in the United Kingdom and Western Europe.
RECI is externally managed by Cheyne Capital’s real estate business which was formed in 2008 and currently manages $6.5bn via private funds and managed accounts. Its investments span the entire spectrum of real estate risk from senior loans, mezzanine loans, special situations to direct asset development and management.
RECI’s aim is to deliver a stable quarterly dividend with minimal portfolio volatility, across economic and credit cycles, through a levered exposure to real estate credit investments.
Bellevue Healthcare Trust PLC ex-dividend date CQS Natural Resources Growth & Income PLC ex-dividend date CQS New City High Yield Fund Ltd ex-dividend date Dunedin Income Growth Investment Trust PLC ex-dividend date Edinburgh Investment Trust PLC ex-dividend date Global Opportunities Trust PLC ex-dividend date Henderson Far East Income Ltd ex-dividend date Henderson International Income Trust PLC ex-dividend date M&G Credit Income Investment Trust PLC ex-dividend date Mobius Investment Trust PLC ex-dividend date Schroder Oriental Income Fund Ltd ex-dividend date Sequoia Economic Infrastructure Income Fund Ltd ex-dividend date Starwood European Real Estate Finance Ltd ex-dividend date
Passively tracking the index is the best way to invest in the domestic market.
By Patrick Sanders
Reporter, Trustnet
Markets hate uncertainty, but volatility has been a common feature of the investment landscape for the past half a decade, in which markets have been shaken by everything from a global pandemic to the outbreak of war.
This year, uncertainty has continued as markets have had to grapple with US president Donald Trump’s fluctuating and unclear approach to trade threatening a full-blown trade war with China.
As such, in the first part of a new series, Trustnet examines market capitalisation, investment style and the performance of active and passive funds to determine the ‘ultimate way’ to invest in each major market since the start of 2020. Here we begin with the UK.
While past performance is not a guarantee of future returns, if volatility is here to stay, it may be helpful for investors to know what has done well in the past five years of market uncertainty.
Market capitalisation and investment styles
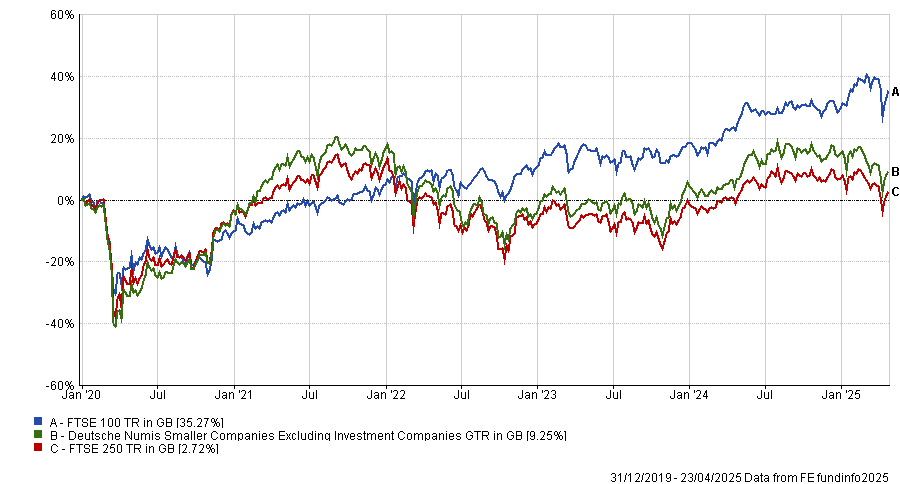
Of the three main UK market indices, the large-cap FTSE 100 is the best performer, up 35.3% since the start of 2020. Investors have sought the relative safety of larger companies in the past few years, as blue-chips tend to be more international and better prepared to deal with market shocks.
The make-up of the UK market, in particular, has been beneficial here. It is made up predominantly of large banks, which were boosted by rising interest rates, and oil majors, which have rocketed as the oil price jumped on the back of Russian sanctions following the country’s invasion of Ukraine.
As investors have taken risk off the table, other areas have struggled. The small-cap Deutsche Numis Smaller Companies index is up by 9%, a difference of 26 percentage points, while the mid-cap FTSE 250 is up by just 2.7% as investors have shunned domestic names.
Performance of indices since 2020
Source: FE Analytics
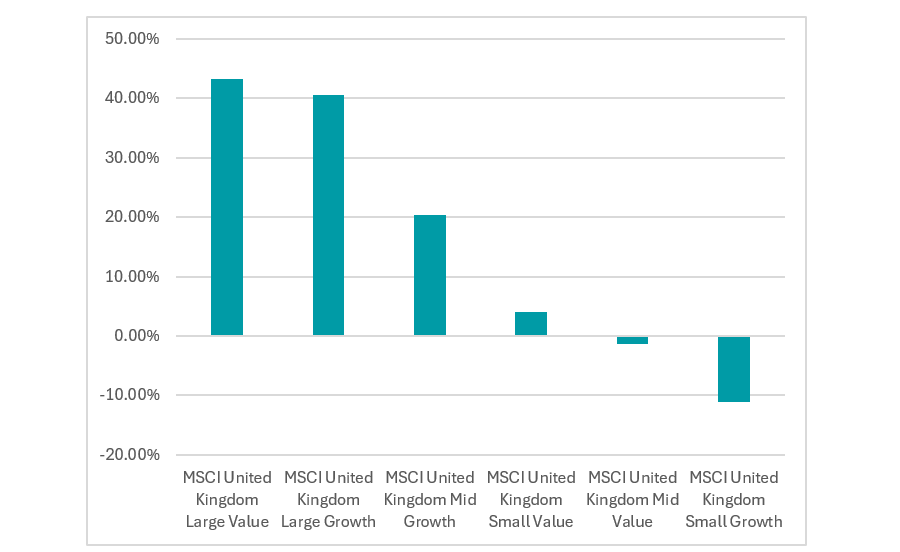
Turning to investment styles, large-caps again triumphed, with MSCI United Kingdom Large Value and MSCI United Kingdom Large Growth topping the chart with a return of 43.3% and 40.5%, respectively, suggesting style was less of a factor than market capitalisation.
However, value was the clear winner across the entire market spectrum, with the style also outperforming in the small-cap space (the MSCI United Kingdom Small Value was up by 4.1%, while the growth index tanked by 11.2%). The only exception was in mid-caps, where this trend reversed.
Performance of indices since 2020
Source: FE Analytics.
Active vs passive
Having established that a large-cap value fund was the best way to invest in the UK over the past five years, how did active funds perform versus their passive counterparts?
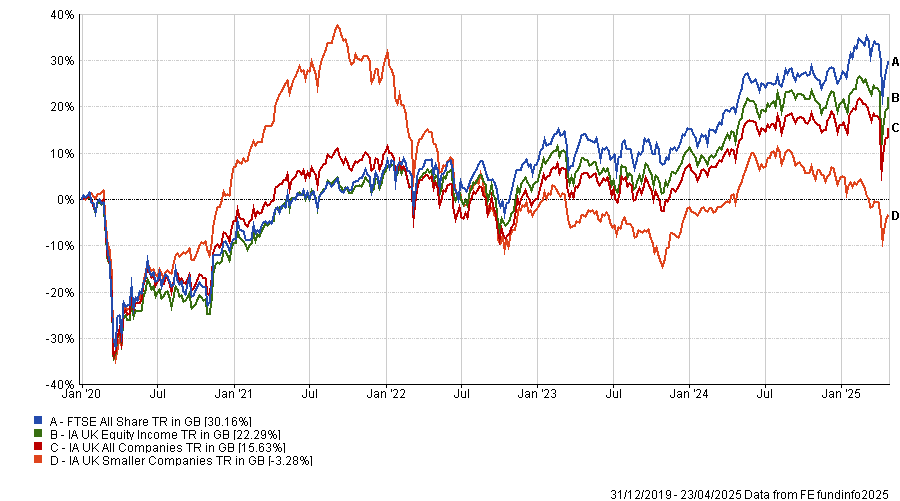
Across all three IA UK equity sectors, the average fund failed to beat the most common UK benchmark – the FTSE All Share – which surged 30.2% since the start of 2020. The IA UK Equity Income sector average came closest to this result, up 22.3%, while the IA UK All Companies sector peer group is up by 15.6% and the IA UK Smaller Companies sector lost 3.3%.
Performance of IA Sectors vs the benchmark since 2020
Source: FE Analytics.
This poor performance from active funds reflects the dominance of large stocks in the index, such as pharmaceutical giant AstraZeneca and oil titan Shell. While active managers may hold allocations towards these stocks, they may struggle to be overweight due to their weighting in the index.
Instead, active managers tend to hunt for shares further down the market-cap spectrum, impacting their performance against the market.
In total, 19% of the IA UK All Companies sector has beaten the FTSE All-Share, while 23% of the IA UK Equity Income sector achieved the feat. In the small-cap arena, 22% were ahead of the Deutsche Numis Smaller Companies Excluding Investment Companies index (a more relevant benchmark), while three funds were able to beat the FTSE All Share.
Conclusion: Buy a large-cap tracker
The data indicates the best way to invest in the UK during times of market dislocation is just to buy a large-cap tracker. At least, that is what would have worked over the past five years.
In this regard, investors are spoilt for choice, with many firms now offering a range of passive index trackers which have proven very popular amongst investors. For example,the Vanguard FTSE UK All Share Index UK Unit trust has more than £14bn in assets under management, making it the largest and most popular fund in the IA UK All Companies sector. It tracks the FTSE All Share for an ongoing charges figure (OCF) of 0.06%, making it one of the cheapest funds on the market.
However, this is not to say active management does not have a place. While the average active fund failed to beat the market, some did manage to deliver.
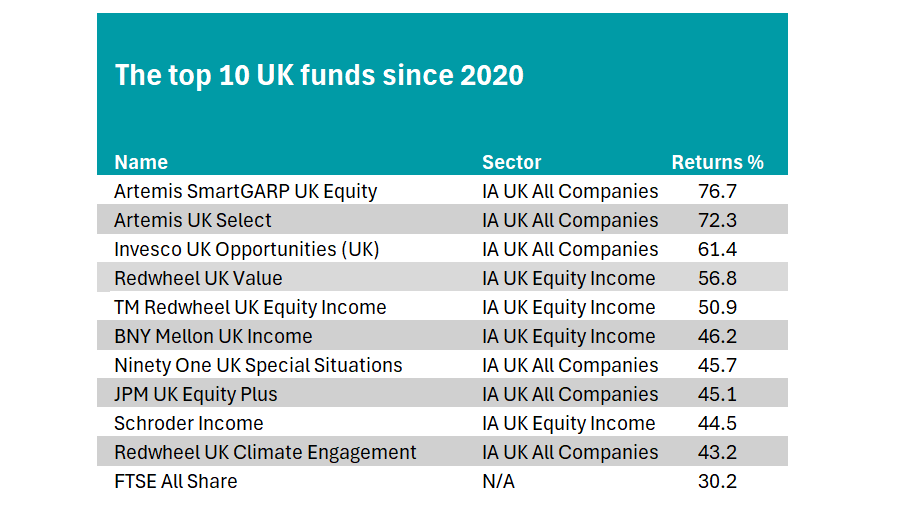
The table below shows the 10 best-performing funds in the UK market since the beginning of 2020, all of which beat the FTSE All Share. Six funds are in the IA UK All Companies sector, while four are in the IA UK Equity Income sector.
Source: FE Analytics
Top of the list is the Artemis SmartGARP UK Equity fund (growth at a reasonable price). Managed by experienced stockpicker Philip Wolstencroft, Shell and GSK are the only two holdings in its top 10 that are also in the top 10 of the FTSE All Share. Otherwise, it is very different to the standard tracker.
It is followed by another strategy from the Artemis team, Ed Legget and Ambrose Faulks’ Artemis UK Select fund. It has significant allocations towards three of the FTSE All Share’s largest constituents – Shell, HSBC and Rolls-Royce.
Income.
Three strategies from the team of Ian Lance and Nick Purves also beat the benchmark – Redwheel UK Value, Redwheel UK Equity Income and Redwheel UK Climate Engagement.
Other funds to qualify include: Invesco UK Opportunities fund, Ninety One UK Special Situations, JPM UK Equity Plus, Schroders Income and BNY Mellon UK Income.
We continue to look back to the future, so the next time Mr. Market gives you the chance you will be prepared.
Or how to Get rich without taking high risks with your hard earned.
Note how the dividend was trimmed after the covid crash but it wasn’t a reason to sell.
Dividend 10.28p. Price shown on chart 127p a yield of 8%.
Note: chart price not including dividends.
You would have achieved the Holy Grail of Investing in that you could take out your stake and re-invest in another higher yielder and have a share in you Snowball providing income at a cost of zero, zilch, nothing.
Most probably the safest dividend in the Investment Trust Universe, dividends are not re-invested into CTY but re-invested into the higher yielding shares in your portfolio.
If you had bought the yield around the covid low, the yield was around 6% which has gently increased to 6.75%.
Chart: Not Including dividends.
The current yield is 4.47% so if you pair traded with a higher yielder a blended yield of 7%. With a ‘safer’ dividend you could accept a lower blended yield.
Still some time before you achieve the holy grail of investing, where you can take out your stake and have a share producing income at zero, zilch, cost.
If you had invested 10k, you would have earned very roughly £2,500 in dividends which would be earning more dividends, for your Snowball, re-invested in a higher yielder.
Earn Stacks With Snacks: 5 Staples Stocks Yielding up to 10.7%
Brett Owens, Chief Investment Strategist Updated: April 25, 2025
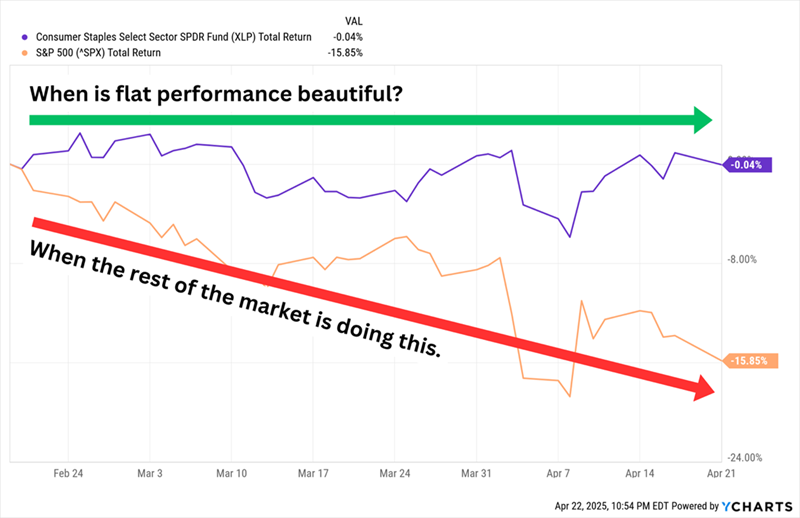
Let’s talk about consumer staples dividends today. If we’re heading for a slowdown then we need to be picky about our payouts. When the economy slows, discretionary spending is often punted but staples continue to be bought.
Today we’ll discuss five dividends between 4.2% and 10.7%. These “must have” products can provide our portfolios with important recession-resistant qualities.
Year-to-date staples have been flat and, in this market, that is great. Their sideways action has lapped the over-owned S&P 500 this year:
Consumer Staples: Doing Exactly What We Expect Them to Do
Consumer staples stocks tend to have more stable operations that result in more stable share performance in turbulent markets. And they also have predictable profits that allow them to pay out better-than-average dividends.
But there are exceptions. Perpetually too-popular staples like Costco (COST) and Walmart (WMT) deliver sub-1% yields. This also drags down the yields of staples-focused funds.
This is why we cherry pick our payouts, as always. Let’s get into these five which yield up to 10.7%.
Tobacco Stocks
Smokers are going to keep smoking, which is why these two tobacco companies have delivered double-digit gains (against the market’s 15% decline!) since Feb. 19:
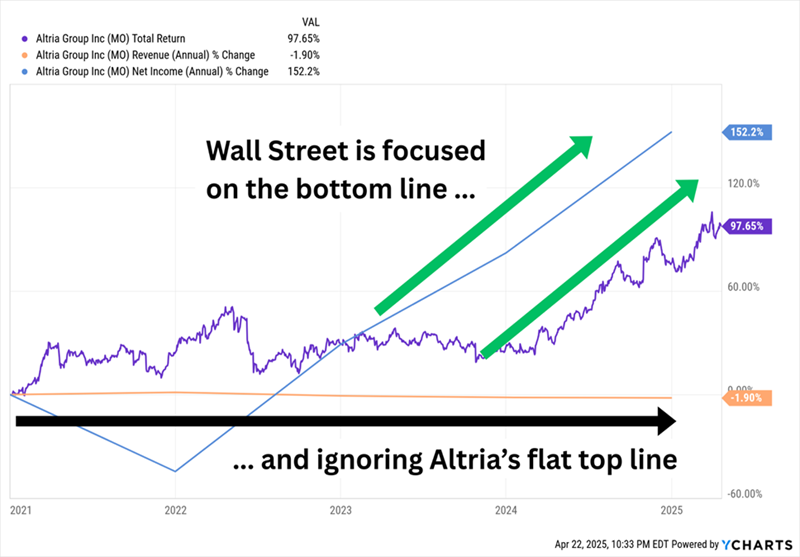
Altria (MO, 6.9% yield) is best-known for its Philip Morris USA segment, which produces Marlboro cigarettes and is by far and away the company’s top revenue driver. But the company is putting increasing focus on its smokeless products, which include Copenhagen and Skoal smokeless tobacco, On! Oral nicotine pouches, NJOY e-vapor products and—through a joint venture with JT Group called Horizon Innovations—heated tobacco products.
Altria has been battling volume declines in cigarettes for years, and it has suffered a few self-inflicted wounds, such as its ill-fated stake in Juul Labs. However, higher prices on cigarettes, as well as growth in its smokeless products, have helped keep earnings and its high dividend on the rise, and both are expected to continue their (admittedly slow) growth in 2025.
As Long as Altria Can Charge More, Investors Will Buy More
Ever since the market started sliding in February, investors have been snapping up MO shares to get some of that stability. But Altria is getting expensive—yes, a forward P/E of 11 doesn’t scream “overbought,” but it’s noticeably higher than the 8x-9x valuation it has typically carried over the past few years.
British American Tobacco (BTI, 7.5% yield) owns a number of well-known cigarette brands, including Camel, American Spirit and Newport. But it too deals in smokeless tobacco, including Grizzly dipping tobacco, Glo heated tobacco, VELO nicotine pouches, and Vuse vapes. In late 2023, BTI announced it would take a massive noncash writedown—which a few months later would become official, at $34.5 billion—on the value of its American cigarette brands. The stock bottomed in late 2024 and has been recovering ever since, including a roughly 10% gain since the February market top.
Despite the writedown, BTI’s top and bottom lines have been generally stable if not improving for years. But the company doesn’t expect sustainable growth until at least 2026, when management believes it will get more support from its smokeless portfolio. Fortunately, the company still keeps finding enough change under the couch to improve its dividend, which it has done in 26 of the past 27 years. A 7%-plus yield is stellar. A forward P/E of 9 not so much once we realize that’s at the high end of its multiyear range.
Groceries
Let’s move on to more traditional consumer staples businesses—but not traditional consumer staples names. The sector’s blue chips tend to be overcrowded, which is a recipe for limited yields. Instead, I prefer stocks that live outside of the spotlight but offer good to great levels of income.
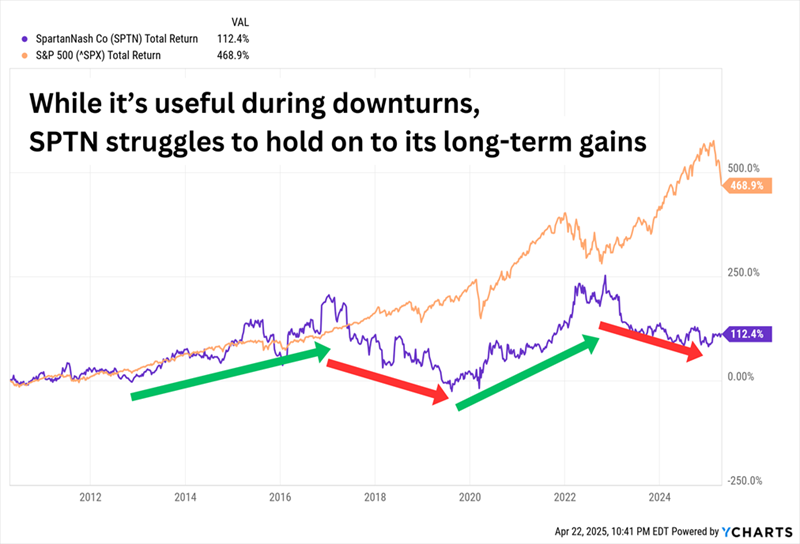
SpartanNash (SPTN, 4.2% yield) is a company that we’ve previously discussed as a “grocer-plus.” It operates nearly 200 grocery stores in 10 states across numerous brands, including Family Fresh Market, Metcalfe’s Market and Supermercado Nuestra Familia. But its other, larger segment is a wholesale distribution business that services roughly 2,300 independent grocers across the U.S. The company is several years into a turnaround plan that has helped to rejuvenate the top and bottom lines, but the stock’s performance hasn’t matched.
As we said back in 2020, “a look at the past 10 years is probably a decent indication of what the next 10 will broadly look like.”
A Strong 2025 Aside, That Has Unfortunately Been the Case
SPTN boasts a decent 4%-plus yield that dwarfs most other grocers, it has raised its distribution for 15 consecutive years, and it pays out just less than half its earnings, so the dividend should have more upside. It’s hard to say the same about the stock price. Management did recently express interest in expanding its Hispanic grocery and convenience store presence, but its plans are in their infancy.
BGS Foods (BGS, 10.7% yield) is the name behind brands such as Crisco, Cream of Wheat, Ortega and Bear Creek. Its double-digit yield is largely the product of a slumping stock, with shares off by more than 70% over the past few years amid slumping top and bottom lines.
Its 10% return since the market top is something of a small miracle considering its continued operational woes. In late February, B&G reported it was booking charges of $320 million related to “intangible trademark assets” on its Green Giant, Victoria, Static Guard and McCann’s brands. BGS also kept its dividend at 19 cents per share, but it’s an open question as to how long B&G can keep it up. The dividend annualizes to 78 cents per share. The pros expect adjusted profits of 68 cents this year and 73 cents in 2026. Something has to give.
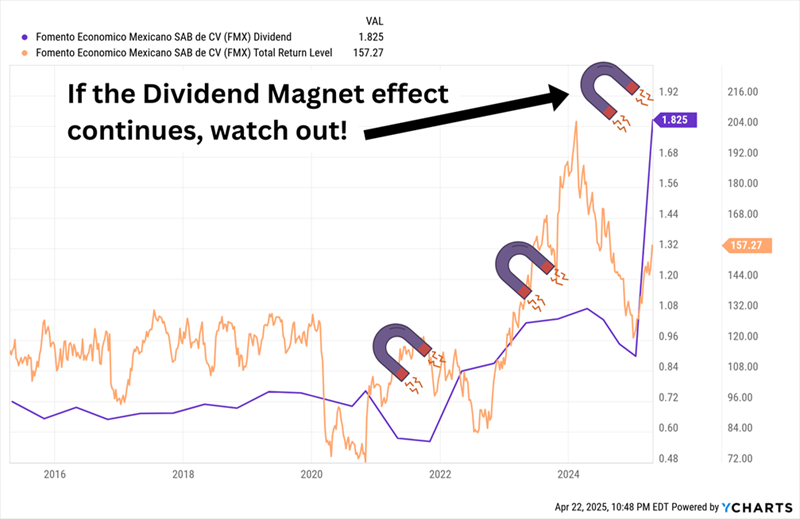
FEMSA (FMX, 7.0% yield)—the merciful shorthand for Fomento Económico Mexicano, S.A.B. de C.V.—isn’t a familiar name, but it’s awfully interesting. FEMSA operates a huge chain of small-box retail stores, called Oxxo, in Mexico, Colombia, Peru, Chile and Brazil. It uses the same brand for auto service stations in Mexico. It also operates drugstores under several names in Mexico, Chile, Colombia and Ecuador. And it owns nearly half of Coca-Cola FEMSA (KOF), the world’s largest bottler of Coca-Cola (KO) by volume.
FEMSA isn’t automatically a great defensive play, then, if our worry is the U.S. economy. We have to keep our eyes on Mexico to determine FMX’s real utility. But there’s a lot to like here. It has a dominant position in Latin America. Top- and bottom-line growth hasn’t been pristine, but it’s better than many other staples names. Estimates are for 26% profit growth this year, then another 12% in 2026. The dividend itself is generous—FEMSA has become increasingly aggressive about returning capital, and it plans on paying four quarterly ordinary dividends as well as four “extraordinary” dividends, coming out to a yield of about 7%.
A Step Change in FEMSA’s Dividend Policy
But while FMX has been plenty fruitful, it has also been more volatile than the average staples stock, and it’s also richly priced at 20 times earnings estimates.
One of FEMSA’s best qualities—its dividend growth—is the lynchpin of my dividend strategy this year.