At times like these, we look to 8%+ paying closed-end funds (CEFs) to reap the strongest dividends and potential upside.
I say this as REITs, long-time market outperformers, have been stuck in an unusually long slump.
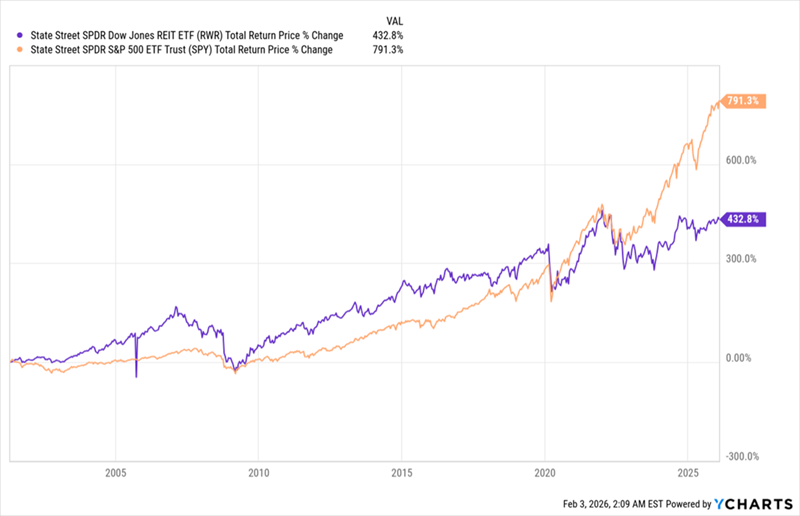
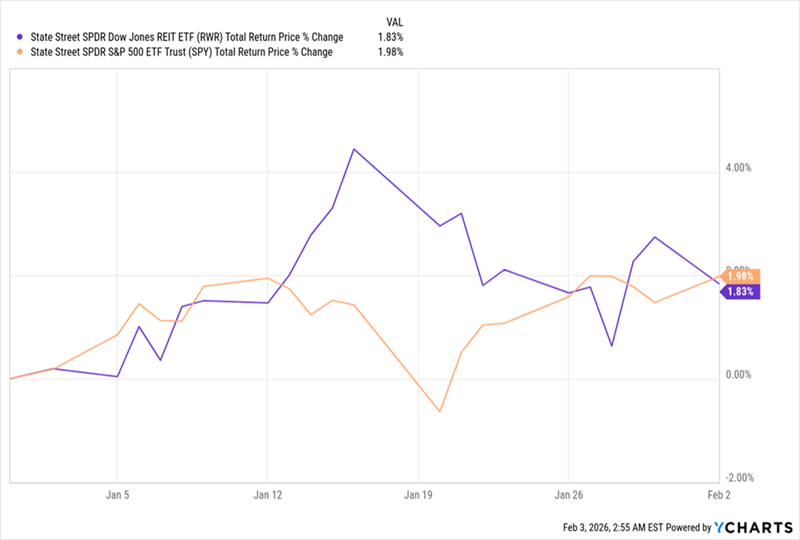
Remember when stocks ricocheted hard after the early days of the pandemic? REITs (with their benchmark ETF shown in purple below, compared to the main S&P 500 ETF, in orange) rebounded, too. But not nearly as much.
REITs’ Slow Recovery Why REIT Headwinds Are Diminishingand Setting Up to Reverse
There are lots of reasons why REITs have lagged in the last six years, and none of them are really secrets: Work-from-home hit office demand. Interest rates jumped, hitting REITs’ bottom lines, as these companies borrow heavily to invest in their properties. Lower immigration into the US also had an effect on both housing and workspace demand.
That last point – immigration into America – still applies. But both of those other barriers, which are far more meaningful, have either flipped or are in the process of doing so.
Work-from-home? It’s largely been replaced by either a full-time return to the office or hybrid work. Interest rates? This is where things get intriguing.
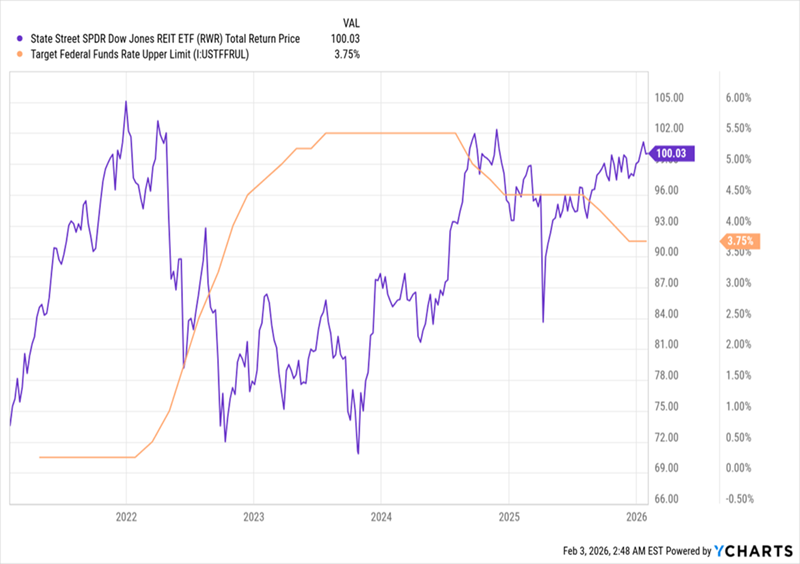
Rates Fall, REITs Start to Respond REITs, as mentioned, borrow to invest in real estate, so rate cuts go straight to their bottom lines. The cuts the Federal Reserve has delivered since mid-2024 (in orange above) have come more slowly than markets expected. So it follows that the boost to REIT profits, and therefore their share prices, is real (purple line), but smaller than investors hoped.
That leaves REITs in a strong position – still underpriced, but starting to show momentum. And with the first month of 2026 now behind us, we can see the current state of play here:
REITs Nearly Reeled In Stocks in January As you can see, in January, REITs (again with their benchmark in purple above) almost met the stock market’s returns. Now, one month does not make a trend, but that’s a switch from what we saw in 2025, when the S&P 500 gained over 17% and RWR returned a mere 3.2%.
The takeaway: The lead stocks have held over REITs is finally starting to fade.
And if interest rates fall faster than the market expects – quite possible if President Trump’s nominee for Fed chair, Kevin Warsh, is confirmed – REITs could not just match the S&P 500 but beat it this year.
That would finally end REITs’ six-year lag. Let’s buy in before that happens. How?
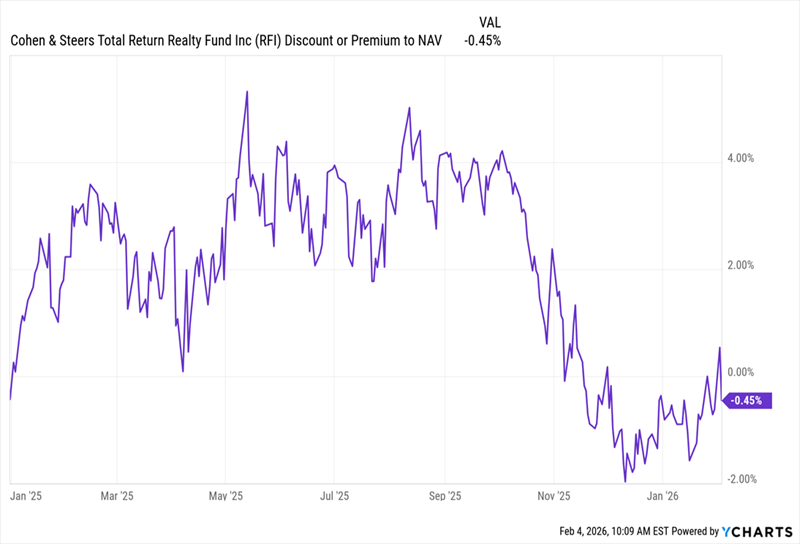
My favorite avenue is through those aforementioned CEFs. Consider, for example, the Cohen & Steers Total Return Realty Fund (RFI), a holding in my CEF Insider service that yields 8.6% as I write this.
The fund is a solid play here, thanks to that 8.6% dividend, which has been rock-steady for years. The fund pays that dividend monthly, to boot.
Source: Income Calendar RFI is also nicely diversified, boasting a portfolio that gives us exposure to AI’s infrastructure needs, with significant weightings in data center and communications (think cell-tower) REITs.
Source: Cohen & Steers It also holds industrial REITs, giving us broad exposure to both the reshoring and automation of factories. That top allocation to healthcare is also a plus, letting us tap into the aging of the US populations – a trend that still has decades to run. Finally, its allocations to bonds and preferred shares add stability.
The fund is cheap, too. As I write this, we can buy RFI at a 0.5% discount to net asset value (NAV, or the value of the fund’s portfolio). I know that doesn’t sound like much of a deal, but it’s far below the premiums at which RFI traded for most of last year:
The kicker? That “small” discount is also well below RFI’s average premium of 3.7% over the last five years.
That makes now a good time to buy this overlooked bargain, before other investors pick up on the many tailwinds shifting in RFI’s favor.
5 More “Built-for-2026” Income Plays You’re Not Too Late On (Yields Up to 10.7%)
CEFs are, hands-down, the top plays on disconnects like the one we’re seeing shape up with REITs today, for three reasons:CEFs pay us (mostly) in cash, thanks to their rich dividends (around 8% on average).CEFs give us a double discount – on both washed-out stocks (or in this case REITs) themselves and on the fund itself through its discount to NAV.CEFs put our investments in the hands of a professional who knows their asset class inside and out.
Alternative Income REIT PLC ex-dividend date BlackRock American Income Trust PLC ex-dividend date BlackRock Income & Growth Investment Trust PLC ex-dividend date Fair Oaks Income Ltd ex-dividend date Franklin Global Trust PLC ex-dividend date GCP Asset Backed Income Fund Ltd ex-dividend date GCP Infrastructure Investments Ltd ex-dividend date Greencoat UK Wind PLC ex-dividend date ICG Enterprise Trust PLC ex-dividend date Impax Environmental Markets PLC ex-dividend date International Public Partnerships Ltd ex-dividend date JPMorgan Emerging EMEA Securities PLC ex-dividend date Majedie Investments PLC ex-dividend date Murray Income Trust PLC ex-dividend date NextEnergy Solar Fund Ltd ex-dividend date Octopus Renewables Infrastructure Trust PLC ex-dividend date Pershing Square Holdings Ltd ex-dividend date Target Healthcare REIT PLC ex-dividend date
You can protect your retirement from a market crash
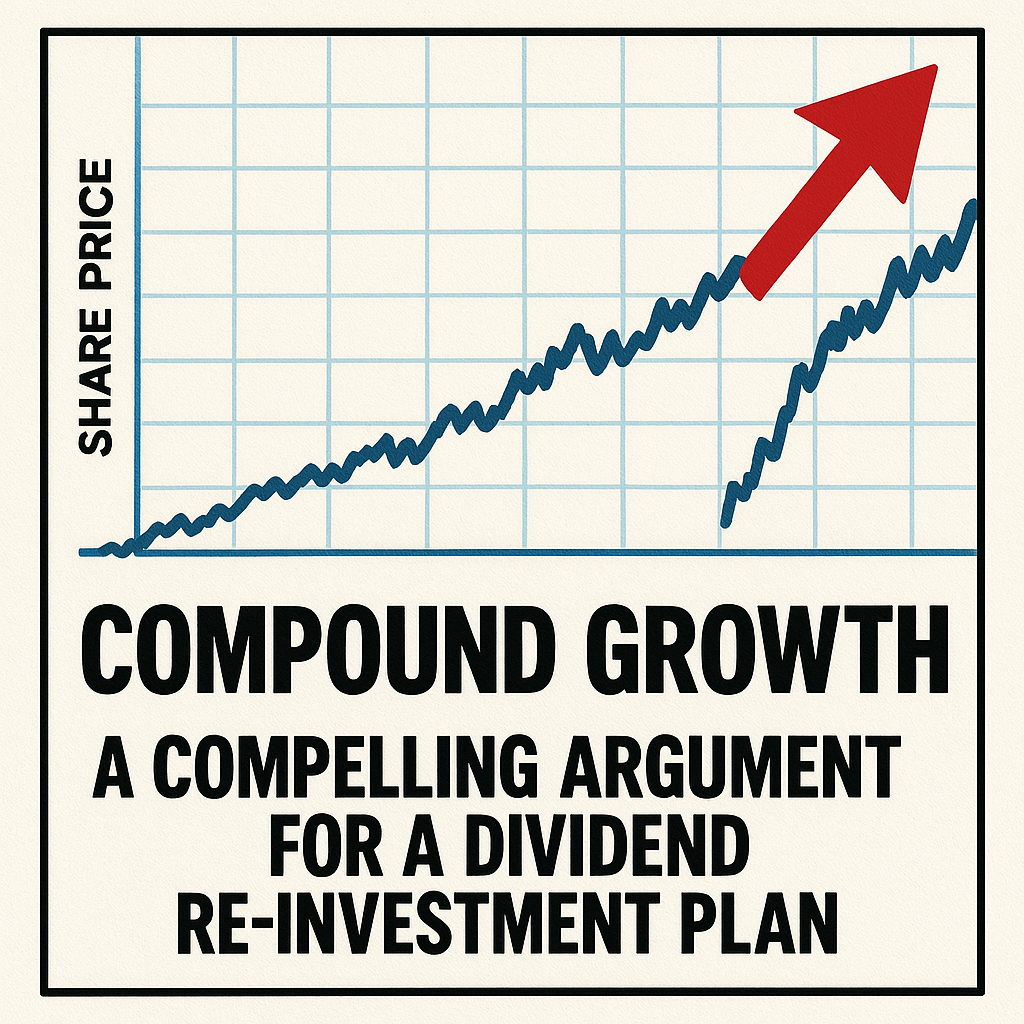
Dividend payouts are stable, unlike share prices – and could power future returns.
David Stevenson
04 February 2026
People on the cusp of retirement finally have something to cheer about after dividends paid by global companies rose to record levels.
Those regular cheques provide a valuable source of natural income for older investors looking for an alternative to high annuity rates.
According to Capital Group, global dividends hit a third-quarter record of $519bn (£379bn) last year, with a bumper 6.2pc increase in that quarter alone.
Crucially, those dividend payouts are stable – unlike share prices, which are volatile – and nearly nine in 10 companies increased payouts or held them steady, according to Capital.
Dividends can seem a little “old school” when compared to share buybacks, which have been all the rage in recent years – especially in the US, even amongst the tech giants.
But bear in mind one crucial issue: buybacks are volatile and tend to stop rather arbitrarily.
In Europe, for instance, analysts warn that the Continent’s leading energy companies are likely to scale back their buyback programmes. By contrast, most large corporations have been reluctant to chop dividends or even slow down dividend growth.
But dividends have a much more profound significance.
Academic economists have crunched the data on dividends from major stock markets over more than a hundred years and they’ve come to a powerful conclusion. In some decades dividends, the growth in that dividend payout and their subsequent reinvestment in the underlying stocks accounted for the majority of total returns.
That’s not true for recent decades, where valuations and capital gains have powered total returns – but it could be true for the next decade if markets wobble.
Dividends also matter a great deal to many older investors seeking what’s been called a natural income in their later years.
A growing majority of older investors have most of their wealth tied up in defined contribution pensions and Isas, and their primary goal is to preserve that capital for the remainder of their lives and generate a steady income.
Annuities provide an answer and rates are currently very high but there’s a clear drawback – you don’t have any capital left when you die.
That might be fine if you want a steady income but for many other investors, that loss of capital is a major drawback.
At that point, many investors encounter the 4pc rule – a rule of thumb that says you can withdraw 4pc of your retirement portfolio in the first year, adjust that amount for inflation each year after and not run out of money for at least 30 years.
The concept was born in 1994 when William Bengen, the financial planner, published a landmark study analysing historical market data dating back to 1926.
He found that even if you retired at the absolute worst possible moment – just before the Great Depression or the stagflation of the 1970s – a 50/50 mix of stocks and bonds would have survived a 30-year retirement with a 4pc initial withdrawal rate.
For decades it was the gold standard for US-based retirees seeking income while preserving their accumulated capital.
The bad news, though, is that depending on who you talk to, that number in the UK is probably somewhere lower – and quite possibly much, much lower.
A study covering 19 developed countries found that the 4pc rule would have failed in about half of them, including major economies such as Japan, France and the UK.
Doug Brodie, a financial planner from Chancery Lane, thinks the safe max in the UK is probably closer to 3pc than 4pc.
Helpfully, that 3pc to 4pc range aligns with the typical income from dividend-oriented equity funds that invest in UK or global equities.
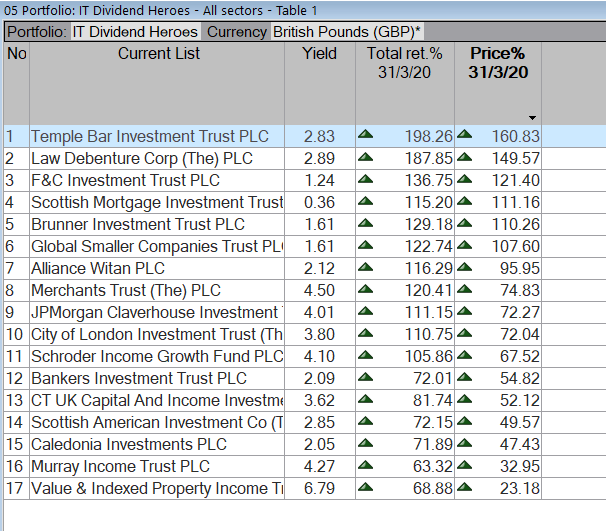
Crucially, Brodie prefers equity income investment trusts where the board can accumulate past income from the portfolio into reserves and then pay it out in the future, keeping the dividend progressively increasing year after year.
This has spawned a whole sub-sector of investment trusts that are called “dividend heroes”, defined as funds that have increased their dividend payouts every year for at least the last two decades without fail, even during the pandemic.
The average yield on equity income investment trusts varies between 3.5 and 4pc per annum and you still get to keep the upside from owning risky equities.
Also, there’s strong evidence to suggest that corporates tend to increase their dividends at a rate that is above inflation, thus potentially inflation-proofing your income.
Here’s one last crucial upside when thinking about how volatile equities can be.
Although dividend-focused equities tend to underperform their peers, especially tech-oriented growth stocks, during booming bull markets, their downside losses during a sell-off are usually – though not always – more subdued.
The real trick for fund managers is to combine this income focus on dividends with a keen eye for what’s called “quality” which in investment terms means looking for companies that have strong balance sheets and are steadily compounding earnings growth.
This way, you avoid stocks that boast high yields simply because they are value traps: businesses that are in trouble and deserve their low share price and high dividend yield.
Analysis by Brodie suggests that, over many decades, this focus on quality stocks in dividend-hero equity income investment trusts not only grows your yearly income payout but also increases your final capital sum – unlike annuities, where you’ll have nothing left to hand over at the end.
But what to do now? Many of us are staying in cash for the time being, with plans to hunt for bargains once stocks fall. The issue is, this fall isn’t happening.
The FTSE 100 hit record highs again last week having reached its previous all-time high in January. By waiting for the opportune moment to invest, many savers have already missed out on significant gains. Meanwhile, despite AI worries, the bubble has yet to burst and some experts maintain that comparisons between the AI-driven rally and the dotcom bubble in the 1990s is overblown.
For investors, this presents a conundrum. Do you wait to buy the dip – however long that takes – losing out on any potential gains in the meantime? Or do you invest now and risk heavy losses in a market crash?
British savers are often chastised for holding too much in cash. As a nation, we ploughed almost £70bn into cash Isas in 2023-24, according to the latest figures – more than double the £31bn we committed to stocks and shares Isas.
Yet research shows that stocks and shares outperform cash over the long-term. A one-off investment of £1,000 in 1999 would be worth over £6,000 today, according to stockbroker AJ Bell, whereas the same payment into a cash Isa would be worth just £2,000.
No one likes the idea of buying when prices are high and missing out on a good deal, but there is no way of identifying market dips in advance, or guessing correctly how much damage they could inflict.
Since 1870, the US stock market has seen 19 bear markets – defined as a period with a drop of 20pc or more over at least two months. While some crashes dragged on for years, others were strangely brief. The US stock market took only four months to recover from the Covid-19 crash, for example.
The investment management firm AQR recently tested 196 buy-the-dip strategies going back to 1965 and found that, in more than 60pc of scenarios, the investor would have been better off holding the S&P 500 passively. Returns were especially poor if the investor bought the dip at the start of a lengthy market downturn.
Of course, it’s possible to combine both strategies. You could hold the long-term while also retaining some cash to tactically buy stocks at the opportune moment – but you have to be quick about it. Last week, for example, there were buying opportunities after weak jobs data and new coding tools triggered a significant sell-off in the technology sector.
Generally, the best time to invest is when you have the money to do so. Advisers recommend holding between three and six months of expenses in an easy-access savings account in case of an income shock. Any more than this, and you might want to think about investing again, without worrying too much about your market timing.
Remember the market is likened to an elastic band, the further it is stretched the faster it will snap back.
The past 12 months were all about value stocks. We look at the managers getting ahead of the market
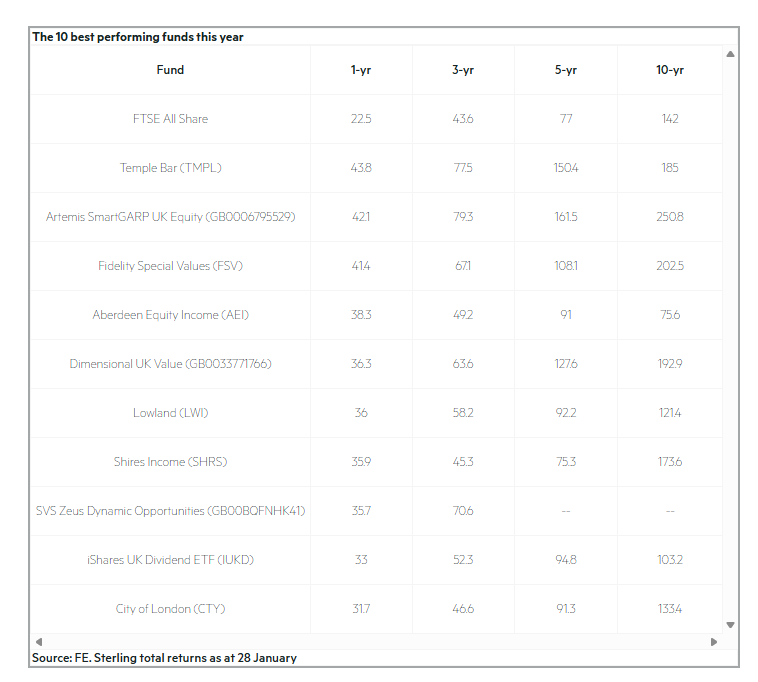
Ten funds beating the FTSE this year Published on February 6, 2026 by Val Cipriani
After a long malaise, it’s been a buoyant period for UK stocks, with the FTSE All-Share index returning 22.5 per cent in the 12 months to 28 January. One might have assumed such a strong result would be hard to beat for fund managers, but in fact a decent number of active funds comfortably outpaced the index.
The table below lists the 10 best performing funds over the period, spanning the UK All Companies and UK Equity Income sectors across both funds and investment trusts (using Investment Association sectors for the first and Association of Investment Companies sectors for the second; there are 302 funds in total across the four sectors). This is a short timeframe, but it is interesting to see which strategies have worked well in the current market.
The 10 best performing funds this year
Six out of the 10 funds in the list are investment trusts. While stock picking will have been a crucial driver of outperformance, gearing is likely to have helped too – trusts have the ability to borrow to invest, which can give them a real boost in rising markets (and exacerbate losses during downturns). The trusts in the table all deploy gearing to various degrees, with Shires Income (SHRS) currently the most geared at 14 per cent of the portfolio.
Some of these trusts also saw their discounts narrow meaningfully in the past year, as net asset value (NAV) performance helped stimulate demand – as at the end of 2024, Fidelity Special Values (FSV) was trading on an 8 per cent discount to NAV, Temple Bar (TMPL) on 6.6 per cent and Lowland (LWI) on 11.7 per cent. Fast forward to 29 January this year, and the first two are trading at around NAV, while Lowland is on a 6.5 per cent discount.
The list also includes one exchange traded fund (ETF), the iShares UK Dividend ETF (IUKD). Not all ETFs are included in the Investment Association sectors, so including any in our table is arguably a little partial. We have kept this one in because it is not just a broad market ETF – instead it tracks “the top 50 stocks by one-year forecast dividend yield”, with weightings determined by yield levels rather than market capitalisation. Its presence in the list also indicates that the top dividend-paying stocks delivered some of the best total returns over the past year.
Forecast: here’s how far the S&P 500 could crash in 2026.
S&P 500 tech stocks are getting sold off as economic uncertainty and AI disruption fears take over. But if the fear spreads, how far could the index fall?
You’re reading a free article with opinions that may differ from The Motley Fool’s Premium Investing Services.
S&P 500 tech stocks have taken quite a beating over the last few days, and concerns surrounding artificial intelligence (AI) disruption and lofty valuations sent prices falling. But could this just be the beginning of a wider US stock market crash? And if so, how far do the experts believe the market could tumble?
Volatility on the rise
While sudden aggressive drops in stock prices are usually caused by a clear, distinct catalyst, that’s not what’s happened this time around. Instead, the recent downward pressure on the US tech sector seems to be originating from a variety of converging factors.
Weaker-than-expected earnings, combined with further AI capex by Microsoft, triggered an initial wave of selling. This was followed by the launch of next generation AI assistant Claude Cowork by Anthropic that investors believe threatens existing enterprise software solutions.
Combining all this with further early earnings misses and a weaker outlook from key S&P 500 players alongside premium valuations, it isn’t so surprising that volatility has started spiking.
Yet, if some institutional forecasts prove to be accurate, this might be just the beginning. US unemployment’s steadily ticking up, inflation’s proving sticky, and consumer credit quality’s in decline.
While none of this guarantees a recession, the analyst team at BCA Research has estimated the probability at a concerning 60%. And as for the S&P 500, BCA has projected that America’s flagship index could tumble to between 4,200 and 4,500. Compared to where the index stands today, that suggests up to a 40% crash could be on the horizon!
Keep calm and carry on
While concerning, it’s important to highlight that BCA currently has one of the most bearish outlooks for the US market. By comparison, the experts at Goldman Sachs have projected only a 25% chance of a recession paired with a 15% pullback should things turn to custard.
Regardless, the best strategy for navigating volatility remains the same: focus on the business, not the stock price. And if the business continues to thrive while the share price dives, it may be time to consider going shopping.
With that in mind, I’m keeping a close eye on Toast (NYSE:TOST).
An emerging buying opportunity?
The one-stop-shop restaurant tech platform is now trading at a 52-week low, stumbling by over 16% since the start of the year. That isn’t entirely surprising given the stock still trades at a fairly expensive forward price-to-earnings ratio of 22. Yet, looking at the underlying business, the company seems to be thriving
More than 156,000 restaurants now rely on its platform worldwide, driving impressive annual subscription revenue, alongside continuous cash flows from small fees on all transactions moving through its network.
Obviously, a weaker US economic outlook doesn’t bode well for this business. After all, if consumers stop eating out, that means fewer restaurant transactions, resulting in a potentially painful slowdown. And given the high failure rate of restaurants in general, a wider recession will undoubtedly have a nasty impact on its subscription income as well.
Yet, with the stock selling off on what is ultimately a cyclical headwind, it’s hard not to be tempted by this high-growth enterprise. That’s why I think investors should consider taking a closer look. And it’s not the only potential S&P 500 opportunity I’ve got on my radar right now.
4 REITs. 4 Monthly Dividend Programs. 4 Massive Yields of Up to 11.7%
Brett Owens, Chief Investment Strategist Updated: January 30, 2026
Quarterly-paying dividend stocks? Ha!
We save those for the poor vanilla investors. Give us the monthly payers—those that dish divvies every 30 days.
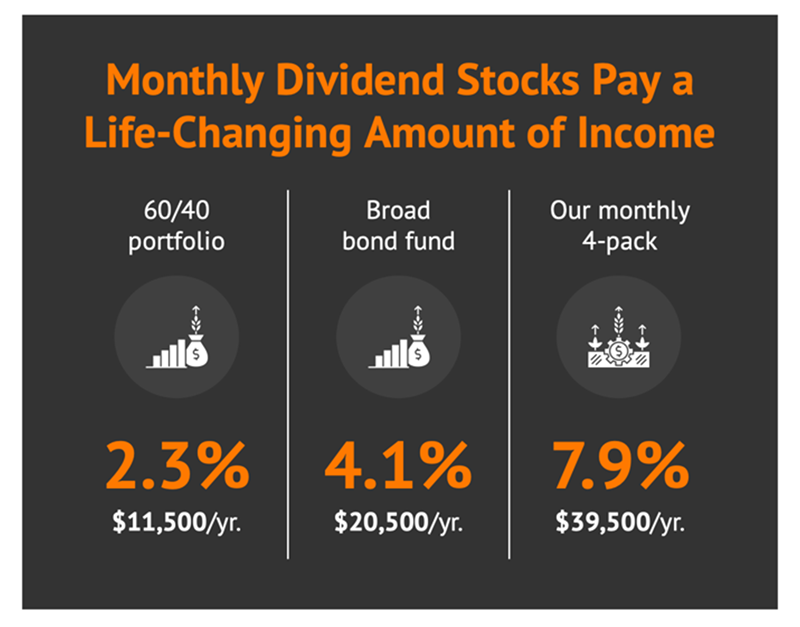
Today we’ll discuss four monthly payers yielding between 5% and 11% per year. An average yield of 7.9%.
This means a $500,000 investment portfolio can buy this four-pack, earn $39,500 per year in dividend income alone and keep principal intact.
Better yet, the payments show up in neat monthly installments. No need to wait 90 days to get paid. The “checks” show up every 30!
Let’s contrast our monthly dividend strategy with the tried, true and (let’s be blunt) inferior techniques employed by unimaginative Wall Street suits who jam their clients into standard broad-based bond funds (or worse, a cheesy 60/40 portfolio):
The advantages of monthly payers are many:
We cut down on “lumpy” portfolio income. Investors who insist on owning nothing but mega-caps and plain ETFs (which usually pay quarterly) must deal with uneven cash flow. A portfolio of monthly dividend stocks pays us the same month in and month out.
Dividends compound faster. The quicker the payouts hit our pockets, the quicker we can put that money back to work.
Do we jump out and buy any monthly dividend payers, however? NO! Remember, our goal is to (at minimum) keep our principal intact. Which means we need to find stocks that are at least likely to grind sideways as they pay their divvies.
With this “price stability” requirement in mind, let’s review these four monthly payers.
Realty Income (O) Dividend Yield: 5.3%
Realty Income (O) is a $55 billion net-lease real estate investment trust (REIT) with 15,500 commercial properties leased out to more than 1,600 clients in more than 90 industries. The vast majority of those properties are leased here in the U.S., but a few hundred of those buildings are scattered across eight European nations.
Realty Income is also a dividend juggernaut, so much so that it calls itself the “Monthly Dividend Company.” It’s a self-given nickname, but it is legit. This REIT has declared 667 consecutive monthly dividends and 113 consecutive quarterly dividend increases; indeed, at more than 30 years of consecutive dividend hikes, it’s a Dividend Aristocrat—and the only monthly payer to enjoy that honor.
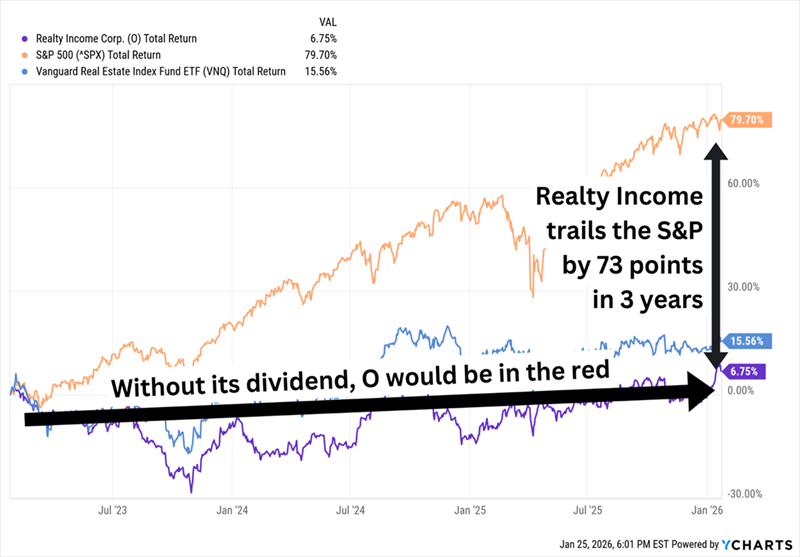
Those are some impressive accolades. Too bad they’ve meant nothing to shareholders over the past few years.
Realty Income: Dead Money Since 2023
The comparisons look a little better since O’s late 2023 low, but the point still stands: Real estate generally has been a lackluster sector, and Realty Income hasn’t differentiated itself. What we need to know is whether that’s primed to change.
Realty Income’s size is a double-edged sword at this point. On the one hand, its broad diversity and long-term leases (its average remaining lease is over nine years!) gives us plenty of reason to believe the dividend will keep inching higher for the foreseeable future. But external growth is increasingly difficult to come by. And as far as its existing properties go: Realty Income is exposed to several industries, including restaurants and health/fitness, that could struggle in a soft economy.
Valuation isn’t helping us either. O trades at about 14 times adjusted funds from operations (AFFO) estimates; it’s not expensive, but it’s hardly a springboard for shares, either.
SL Green Realty (SLG) Dividend Yield: 6.7%
SL Green Realty (SLG), “Manhattan’s largest landlord,” is a much more specialized REIT that deals in commercial real estate in New York City. Its portfolio currently consists of interest in 53 buildings representing nearly 31 million square feet.
The good news? SL Green Realty is one of the biggest landlords in one of the biggest cities on the planet, and its portfolio is stuffed with high-quality and well-located buildings. It also has an extremely well-covered dividend, which currently represents only two-thirds of 2026 FFO estimates.
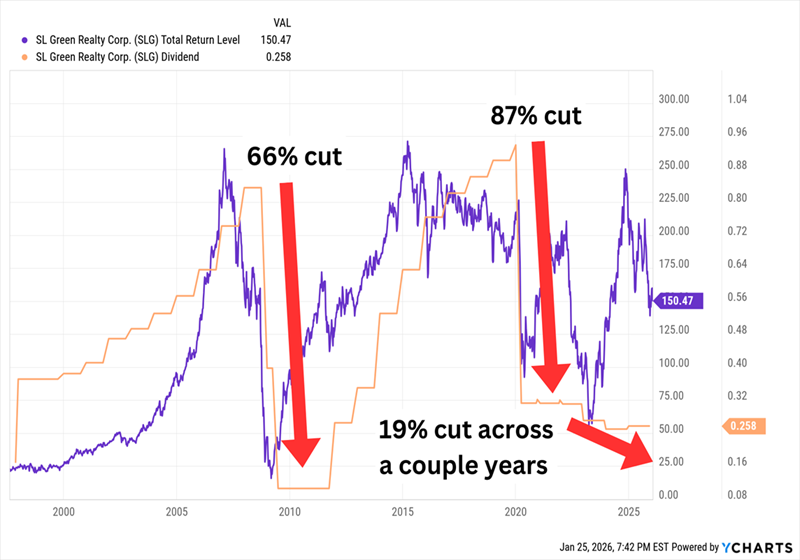
The bad news? SLG is one of the most highly leveraged companies in its category, FFO estimates for 2026 are 19% lower than they are for the yet-to-be released full-year 2025, and SLG’s dividend seems to go whichever way the wind is blowing.
This Is the Opposite of a Dependable Dividend
If there’s any reason to be optimistic, it’s that New York offices have mounted a strong recovery. The stock is also decently priced at 10 times those lower 2026 estimates.
Apple Hospitality REIT (APLE) Dividend Yield: 7.8%
Another monthly payer from the real estate sector is hotel property owner Apple Hospitality REIT (APLE).
Apple Hospitality’s portfolio is predominantly made up of upscale, “rooms-focused” hotels in the U.S. It currently boasts 217 hotels accounting for about 29,600 guest rooms in 84 markets in 37 states and D.C. The portfolio is largely split between Hilton (HLT, 115 hotels) and Marriott (MAR, 96 hotels), though it also has a single Hyatt (H) branded hotel.
Apple Hospitality’s hotels, on average, are on the younger side, they’re well-maintained, and they enjoy some of the best EBITDA margins in the industry. That’s in part because of the “rooms-focused” or “select service” nature of the hotels, which means they focus only on essential amenities such as gyms, business centers, small convenience stores and limited dining. Geographic diversification is a plus. This is a truly inexpensive REIT, to boot, trading at just 8 times 2026’s FFO estimates.
However, APLE doesn’t have much room to broaden margins further. It’s also in the precarious position of being strongly tethered to World Cup 2026 demand—a big showing could drive growth in this hotel name, but concerns over the administration’s immigration policies could dampen demand.
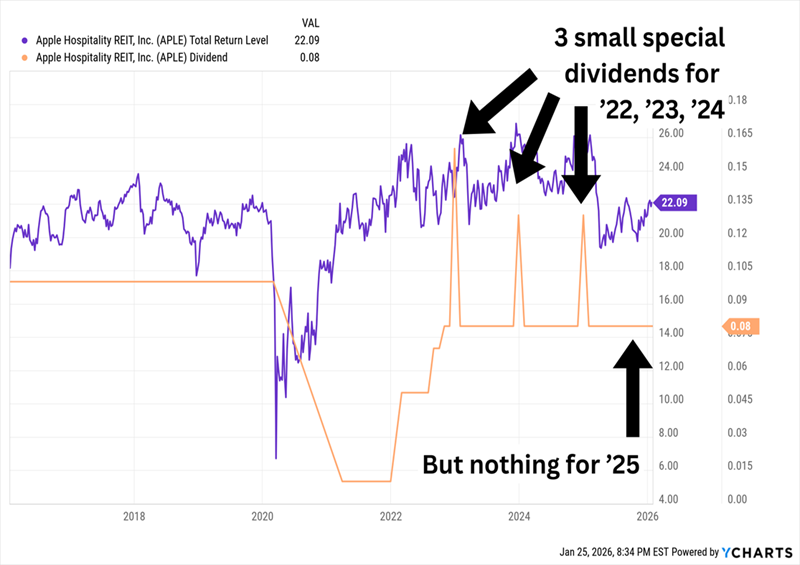
The monthly dividend is a mixed bag, too. It’s extremely well covered at less than two-thirds FFO estimates. But it has never recovered to its post-COVID levels; APLE was paying 10 cents per share, but suspended the dividend in 2020, brought it back in 2021 at a penny per share, and has since raised it to 8 cents per share. It also has been paying small specials at the start of the past three years but didn’t authorize one for 2026.
APLE’s Dividend Growth Has Flattened, And Shares Have Reflected That
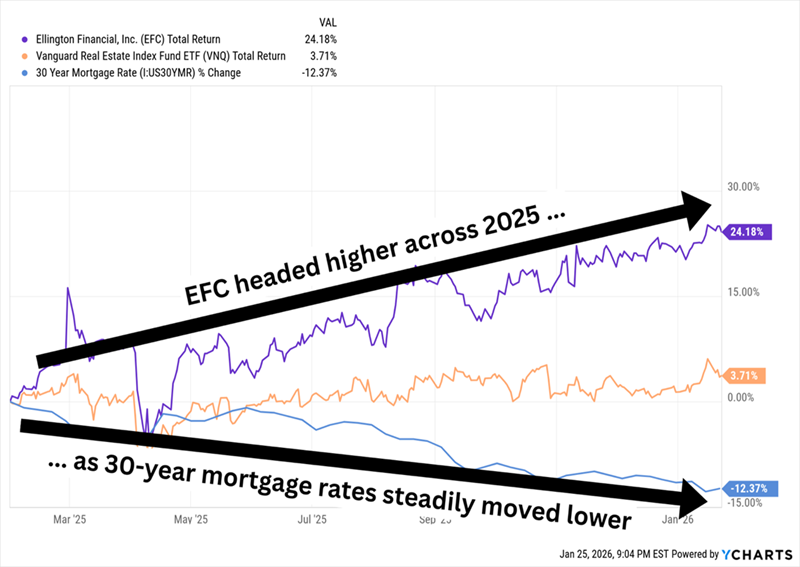
Ellington Financial (EFC) Dividend Yield: 11.7%
No surprise at all the highest yielder on the list, Ellington Financial (EFC), is a small-cap mortgage REIT (mREIT). It primarily deals in credit such as residential transition loans, residential and commercial mortgage loans, CMBSs and collateralized loan obligations (CLOs), but it also has lesser (and shrinking) dealings in agency MBSs.
All of that is “paper” real estate, not physical properties. Mortgage REITs like EFC borrow money at short-term rates to buy mortgages and other assets that pay income tied to long-term rates, and they profit off the difference. Naturally, then, management wants short-term rates to be lower than long-term ones, which they typically are.
These loans are helped by short-term rates declining while long-term rates hold steady or move lower (because lower rates mean mREITs’ mortgages—issued when rates were higher—yield more than newly issued ones, so they’re worth more). Importantly, the 30-year rate has drifted lower, which is good, but it hasn’t plunged quickly enough to trigger a wave of refinancing or prepayments.
EFC’s Relationship With Long-Term Mortgage Rates Was Pretty Straightforward in 2025
2025’s run in EFC (and other mREITs) could very well continue into 2026 if the Federal Reserve adds a couple more rate cuts this year. Ellington also stands to benefit from government-sponsored enterprise (GSE) reform, with the Trump administration looking at releasing the likes of Fannie Mae and Freddie Mac from government conservatorship.
The mammoth yield on EFC’s monthly dividend grew a little bit more a couple days ago: The company announced an 8.77 million-share secondary offering, with the option to sell up to another 1.32 million shares, to help redeem all of its Series A Preferred Stock. The resulting decline in shares bumped the yield from just above 11% to nearly 12%.
On a nominal basis, Ellington pays out$1.56 per share annually, which is about 86% of 2026 estimates for $1.82 in earnings per share (EPS). Not a ton of breathing room, but not panic territory, either. The stock also trades at less than 8 times those earnings.
Brett Owens, Chief Investment Strategist Updated: February 6, 2026
New tariffs. A government shutdown. A brutal selloff in the software sector with speculation that AI will eat everything in its wake.
Concerned about a pullback? An outright bear market? Fair enough and, if so, let’s talk about beta.
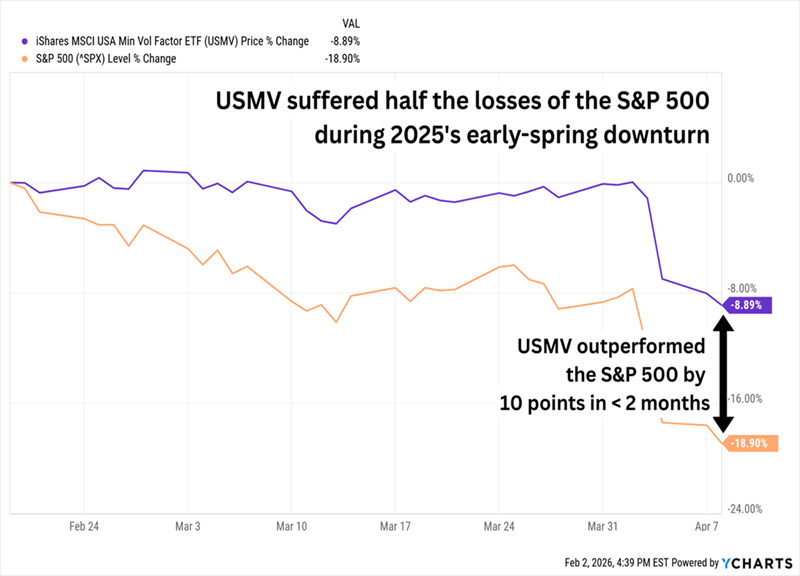
Low beta stocks are our best friends for surviving a bear market. Stocks with betas below 1 are considered less volatile than the overall market. For example, we’d expect a stock with a beta of 0.5 to drop only half as much as the S&P 500 during a pullback.
Let’s consider low-beta fund iShares MSCI USA Min Vol Factor ETF (USMV), which did its job in the leadup to the “Liberation Day” panic last year. The S&P 500 dropped 19% while USMV shed only 9%:
Low Beta Fund Beat the Market
And that’s just a simple fund. We can do even better if we cherry pick our favorite low-beta dividend payers.
The idea, of course, is not to lose money. It’s to make money regardless of what happens in the broader market. To do this we’ll consider six low-beta stocks yielding 5.8% to 8.4%.
First up is Apple Hospitality REIT (APLE, 8.1% dividend yield), featured in my recent breakdown of generous monthly dividend payers. The hotel real estate investment trust is low drama, boasting tranquil 1- and 5-year betas of 0.73 and 0.83, respectively.
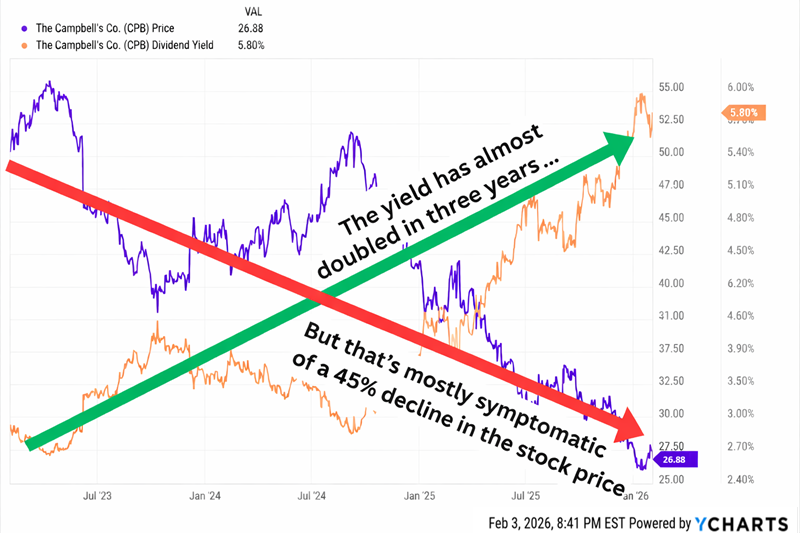
Moving on to aisle five we have Campbell’s Co. (CPB, 5.8% dividend yield), which now boasts a tasty yield. Unfortunately the big divvie is due to a rough three-year price decline.
Unfortunately, CPB Took the Other Route to a High Yield
Can Campbell’s turn the corner? The company is more than Campbell’s soup—its wide portfolio of grocery staples includes Pepperidge Farm baked goods, Goldfish and Lance crackers, Cape Cod and Kettle Brand chips, and Prego pasta sauces, V8 vegetable juices, and Pace salsa, among others. This diversification should be a strength, but the company has struggled virtually across the board amid constant inflation, cautious consumers willing to go private-label to save money, and its own increasing input costs. It has made a few acquisitions in recent years to spur growth—most notably, its 2024 acquisition of Sovos Brands that brought in the fast-rising Rao’s pasta sauce and Michael Angelo’s frozen meal brands.
CPB is expected to rebound next year. Analysts believe Campbell’s will post declines on both the top and bottom lines in 2026. But the dividend—which CPB improved in 2025 for the first time since 2021—is well-covered at about 65% of this year’s meek earnings estimates. The stock’s 1- and 5-year betas of 0.06 and -0.04 would normally be encouraging for defense hunters, but in Campbell’s case, they reflect lethargy more than stability.
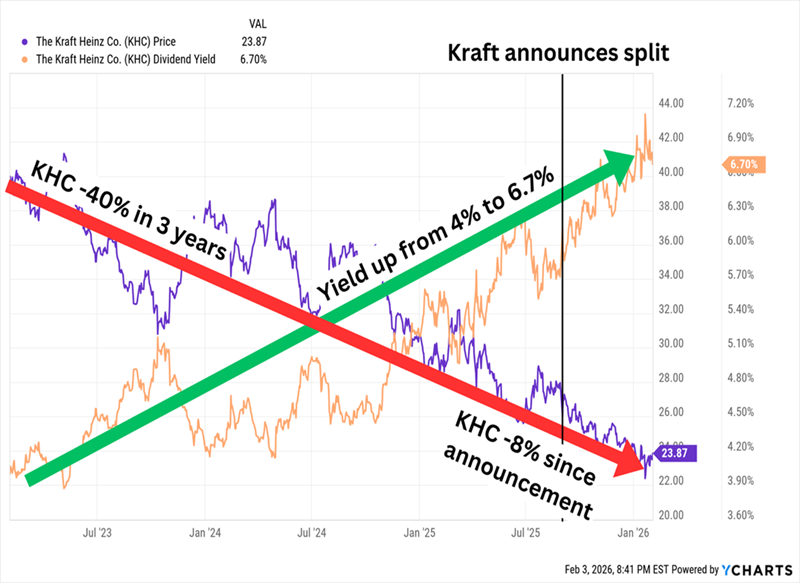
Kraft has since announced it’s splitting its business into:
“Global Taste Elevation Co.”: A “roster of iconic brands and local jewels,” including billion-dollar brands Heinz, Philadelphia and Kraft Mac & Cheese. We frequently see corporate splits divide a company into a growth arm and a more stable, cash-generating arm; Global Taste Elevation is expected to be the former.
“North American Grocery Co.”: A “portfolio of North American staples” that includes its own trio of billion-dollar brands—Oscar Mayer, Kraft Singles, and Lunchables. This is likely to be the stodgier (but perhaps better-paying) arm.
We’re constantly told that M&A is great for “unlocking shareholder value.” This has not been the case with Kraft.
Kraft is a Gooey Mess
Like with Campbell’s, its marginal 1- and 5-year betas of 0.07 and 0.05 signal low volatility but not in a good way. The patient is on life support.
And now, it appears the Kraft bear crowd will add a very big name: Berkshire Hathaway (BRK.B). New CEO Greg Abel recently signaled that he could be exiting the company’s 27.5% stake in the company, making an SEC filing to register the potential resale of up to 325 million shares. That doesn’t necessarily mean Berkshire will sell, but it does set the company up to do so.
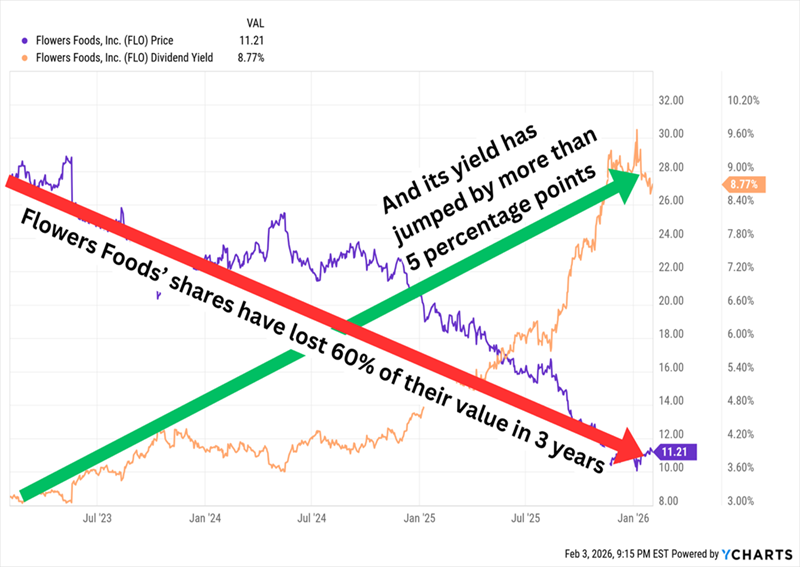
Flowers is a bakery giant whose businesses can largely be split into bread (Wonder, Sunbeam, Nature’s Own, Dave’s Killer Bread, among others) and snacks (Tastykake, Mrs. Freshley’s and more). But all of that is the “Branded” segment, which makes up about two-thirds of revenues; the remaining third is generated by an “Other” segment that includes private-label brands and other business.
FLO is facing many of the same pressures as the aforementioned staples companies, but it’s also more susceptible to improving health trends and GLP usage. And it has piled up heavy debt, too. The company is also subject of a case—Flowers Foods v. Brock, which will determine whether last-mile drivers are exempt from the Federal Arbitration Act—heading to the Supreme Court next month.
So despite what its 1- and 5-year betas (0.12 and 0.33) might otherwise suggest, shares have cracked under heavy pressure—though that has lifted the yield to nearly 9%.
This Stock Could Use Some Yeast
Not all of that yield jump can be chalked up to stock losses—Flowers has been stubbornly raising the dividend against the tide. But I have to wonder whether management knows something that my calculator doesn’t—its 24.75-cent quarterly dividend comes out to 99 cents per share annually. FLO is expected to earn $1.03 this year and 98 cents in 2027. S&P Global Ratings has noticed: Late last year, the debt-scoring agency lowered its rating on Flowers from BBB to BBB-, which is the lowest tier of investment-grade.
That said, the stock is dirt cheap. Shares trade at half the company’s sales, and FLO’s revenue mix is increasingly leaning into the higher-margin, higher-growth Branded segment. There’s light at the end of the tunnel—whether or not it’s the headlights of an incoming train remains to be seen.
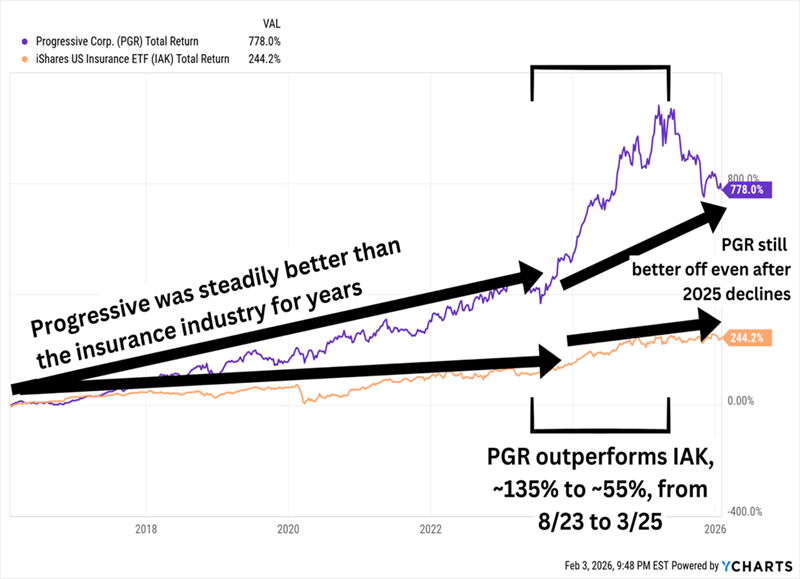
Speaking of “Flo,” let’s look at Progressive (PGR, 7.0% dividend yield), which is admittedly on the schneid itself. But unlike our troubled consumer staples stocks, PGR merely appears to be reverting to the mean after break-neck share growth.
PGR Has Been Working Off High Valuations for a Year
Progressive writes personal auto, residential property, business general liability, commercial property, and workers compensation insurance, among other policies. We’ve previously bagged 87% gains on this stock in my Hidden Yields service, and it remains on my watchlist today.
Artificial intelligence (AI) is changing a lot of industries. Most people immediately think tech—but anyone who knows an actuary or two knows that AI is coursing through the insurance business, too. Progressive, for instance, is currently using AI to refine Snapshot—its program that adapts rates based on real-time data from a customer’s car—as well as to analyze photos of damage to speed up claims.
Like with the staples companies, Progressive’s modest 1- and 5-year betas (0.54 and 0.31) more so reflect its struggles than anything else, but PGR has historically been a smooth operator.
But the high yield? That’s new. And it might—or might not—be fleeting. PGR pays a nominal quarterly dividend of a dime per share that comes out to a yield of about 0.2%. However, it has also been paying increasingly large special annual dividends in each of the past three years; its most recent distribution of $13.60 per share cranked that annualized payout up to 7%. It’s probably not an ideal situation for anyone relying on regular income, but it’s a nice kicker for anyone focused on total returns.
But as I said before, it’s on my watch list, and I’m still watching. Despite its selloff, PGR still trades at 4 times book.
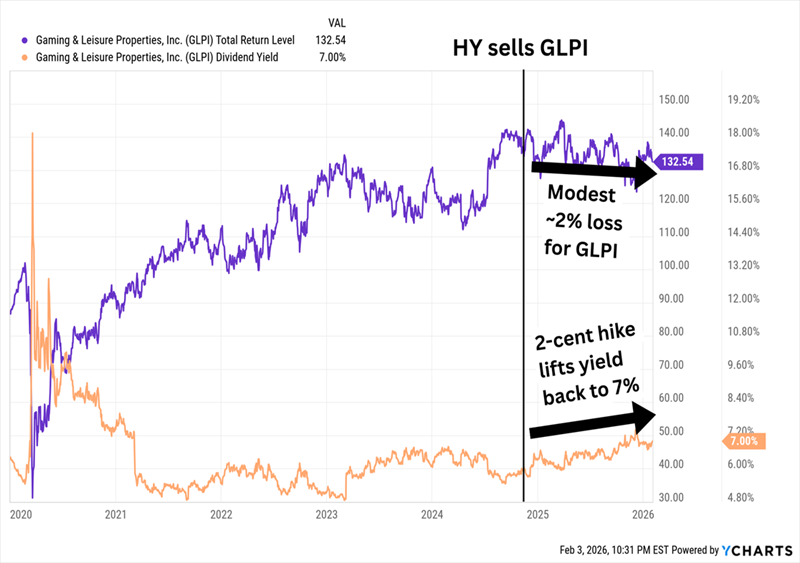
My Hidden Yields service also has a brief history with Gaming & Leisure Properties (GLPI, 7.0% dividend yield), a casino and gaming REIT with 69 assets under brands such as Caesars Entertainment (CZR), PENN Entertainment (PENN), Boyd Gaming (BYD), and more. GLPI stands out from other gaming names in that it has extremely little exposure to the hub of American casinos, Las Vegas—its only property there is The Tropicana. Instead, its properties are spread across 20 states, from New Mexico to Ohio to Rhode Island.
We held GLPI for a little more than a year between 2023 and 2024 before collecting a tidy profit. And despite selling just as the Fed started cutting its target rate (generally good for REITs), the stock—even including its sizable dividend—is sitting on a small loss since then.
The House Has Held GLPI to Roughly Breakeven
Here, though, GLPI’s 1- and 5-year betas (0.17 and 0.68) are actually proof that GLPI has largely been hanging tough. The past year-plus especially has been brutal on the gaming space between a stiff decline in international tourism and a tougher economic backdrop holding back domestic gamblers.
There’s no sign of weakness in Gaming & Leisure Properties’ capital plans, with the company primed to spend more than $3 billion over the next two years while still keeping a reasonable amount of leverage. Meanwhile, GLPI’s dividend surpassed its pre-COVID-cut heights years ago, and it keeps growing, including a roughly 3% hike last year. The current 78-cent quarterly payout comes out to roughly 75% of adjusted funds from operations (AFFO) estimates, which is plenty safe in REIT-speak. Shares trade at less than 11 times those estimates, too.
GRS without taking big risks with your hard earned.
When markets fell you may have been fearful of trading as prices could have kept falling but if you traded the enhanced yield you would have been lucky.
How lucky would depend on the choices you made and if you had cash to invest.
Low risk LWDB has outperformed high risk SMT but it could be different the next time markets crash, not if but when. GL
Warren Buffett has built his legacy not by attempting to predict short-term market movements but by investing in high-quality businesses with durable competitive advantages and holding them for the long term. He has repeatedly stated that trying to time the market is a fool’s errand and that even the most experienced investors struggle to do so consistently. Instead of attempting to buy at the lowest point and sell at the highest, Buffett advocates for a strategy of steady, disciplined investing that allows the power of compounding to work in an investor’s favour.
Market timing – the practice of attempting to buy stocks when prices are low and sell when they are high – may seem like a logical approach, but in reality, it is extremely difficult, if not impossible, to execute with precision. Economic cycles, geopolitical events and investor sentiment drive market fluctuations, often in unpredictable ways. Buffett warns that even professionals fail to accurately predict market cycles and the risk of making poor decisions based on short-term noise far outweighs the potential benefits of timing trades correctly.
Rather than trying to outguess the market, Buffett believes that investors should identify strong businesses, invest at reasonable prices and stay invested through market cycles. This philosophy has allowed him to outperform the market over decades and it offers valuable lessons for individual investors looking to build long-term wealth.
BUFFETT’S ARGUMENTS AGAINST MARKET TIMING
Short-term fluctuations are unpredictable: Even experts fail to time markets accurately
One of Buffett’s core beliefs is that no one can predict short-term market movements with consistency. The stock market is influenced by countless factors, including economic data, corporate earnings, geopolitical developments, interest rates and investor sentiment. These elements interact in complex ways, making it nearly impossible to forecast short-term price changes.
Buffett has frequently criticised the financial media and market commentators who attempt to predict market trends. He argues that their forecasts are often incorrect and can lead investors astray. Even professional fund managers, with access to extensive research and sophisticated models, often struggle to time the market effectively.
To illustrate this point, Buffett points to his own experience. Despite decades of investing success, he has never attempted to time the market. Instead, he remains focused on evaluating businesses based on their long-term prospects rather than reacting to daily price movements. His approach underscores a fundamental truth: investing is about buying great businesses, not predicting short-term price swings.
The risk of missing the best days: How staying invested yields better long-term results
One of the greatest dangers of market timing is missing the best days in the market. Investors who try to jump in and out of stocks based on short-term predictions often find themselves on the sidelines during the strongest rallies. Since markets tend to rebound quickly after downturns, being out of the market even for a few key days can significantly reduce long-term returns.
Historical data supports this point. Studies have shown that missing just a handful of the best-performing days in the stock market over a 20- or 30-year period can dramatically reduce an investor’s overall returns. For example, if an investor had been fully invested in the S&P 500 over the past 30 years, they would have earned an average annual return of around 10%. However, missing just the 10 best days in the market during that period would have cut returns nearly in half.
Buffett’s wisdom is clear: the best way to benefit from long-term market growth is to remain consistently invested, rather than trying to jump in and out based on market forecasts. He advises investors to ignore short-term volatility and trust in the power of compounding over time.
Compounding works best over time: The longer you stay in, the greater your returns
Buffett’s investment success is largely built on the principle of compounding returns. Compounding occurs when an investor earns returns on both their initial investment and the accumulated gains from previous years. Over long periods, compounding leads to exponential growth.
However, compounding only works effectively if investors remain invested for long enough. Those who attempt to time the market often interrupt the compounding process, missing out on the gradual accumulation of wealth. Buffett likens investing to planting a tree – the sooner you plant it and the longer you let it grow, the larger and stronger it becomes.
Buffett’s own track record is a testament to the power of compounding. By holding investments for decades rather than months or years, he has allowed companies like Coca-Cola, American Express and Apple to compound in value, generating massive long-term gains.
For individual investors, the key takeaway is that time in the market is more important than timing the market. The longer an investor stays invested, the more they benefit from the exponential growth of compounding returns.
HOW INVESTORS CAN FOLLOW BUFFETT’S APPROACH
Focus on buying great businesses rather than predicting market cycles
Buffett’s strategy revolves around identifying strong companies with durable competitive advantages and holding them for the long term. Instead of trying to predict when markets will rise or fall, he focuses on:
Finding businesses with strong fundamentals, such as stable earnings, high return on equity (ROE) and robust free cash flow.
Looking for companies with economic moats, ensuring they can maintain profitability over time.
Investing when valuations are reasonable, rather than waiting for the ‘perfect’ moment to buy.
By prioritising business quality over market timing, investors can build a resilient portfolio that delivers strong returns over decades.
Ignore short-term noise and media speculation
Buffett often warns investors against paying too much attention to financial news and market speculation. Media headlines frequently focus on short-term market movements, economic uncertainty or geopolitical risks – all of which can create fear and lead investors to make impulsive decisions.
Buffett advises that investors tune out the noise and instead concentrate on the underlying strength of their investments. He has famously stated: “The stock market is designed to transfer money from the active to the patient.” This means that those who react emotionally to news and market fluctuations often make poor decisions, while those who remain patient and disciplined tend to succeed.
A practical way to apply this lesson is to review investments periodically, rather than obsessing over daily price changes. Checking stock prices too frequently can lead to overtrading and emotional decision-making. Instead, investors should focus on fundamentals and long-term growth.
Invest consistently and let time do the work
One of the best ways to overcome the temptation of market timing is to invest consistently. Buffett recommends a dollar-cost averaging strategy, which involves investing a fixed amount at regular intervals, regardless of market conditions.
This approach helps investors:
Avoid emotional investing, as they continue to invest regardless of market sentiment.
Take advantage of lower prices during downturns, buying more shares when prices are down.
Benefit from compounding over time, as investments grow steadily.
Buffett has even recommended this approach to everyday investors, suggesting that most people simply invest in a low-cost S&P 500 index fund regularly. This strategy ensures participation in long-term market growth without the risk of mistiming trades.
Buffett’s wisdom on market timing is simple: it doesn’t work and it isn’t necessary for investment success. Instead of trying to predict market movements, investors should focus on buying strong businesses, holding them for the long term and letting compounding do the work.
This Trustnet Learn article was written with assistance from artificial intelligence (AI). For more information, please visit our AI Statement.
The good news is if you only have modest savings, compounding takes time to make a noticeable difference, you stand to make more in the last few years than you do in all the early years.

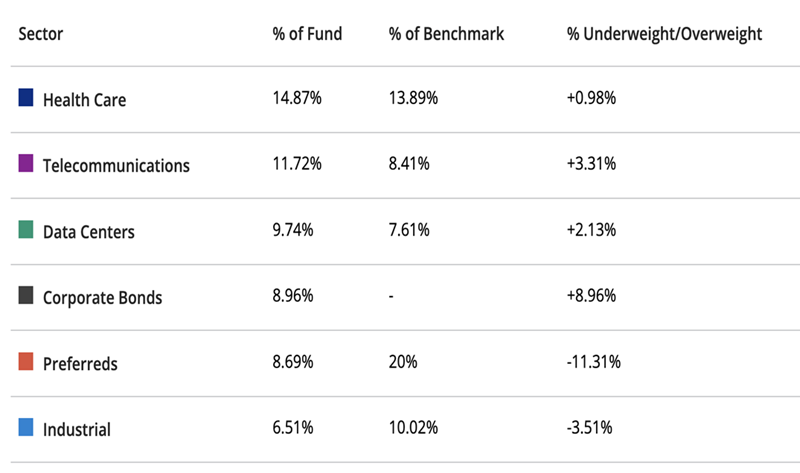 Source: Cohen & Steers