
Investment Trust Dividends
Impact Healthcare REIT plc acquires, renovates, extends and redevelops high quality healthcare real estate assets in the UK and lets these assets on long-term full repairing and insuring leases to high-quality established healthcare operators which offer good quality care, under leases which provide the Company with attractive levels of rent cover.
The Company aims to provide shareholders with an attractive sustainable return, principally in the form of quarterly income distributions and with the potential for capital and income growth, through exposure to a diversified and resilient portfolio of UK healthcare real estate assets, in particular care homes for the elderly.
The Company’s dividend policy is to maintain a progressive dividend that is covered by adjusted earnings.
On this basis, the target total dividend for the year ending 31 December 2024 is 6.95 pence per share, a 0.18 pence increase over the 6.77 pence in dividends paid or declared per ordinary share for the year ended 31 December 2023.
BARCLAYS RAISES JLEN ENVIRONMENTAL ASSETS TO ‘OVERWEIGHT’ (E-W) – PRICE TARGET 110 PENCE
BARCLAYS CUTS NEXTENERGY SOLAR FUND TO ‘EQUAL WEIGHT’ (OW) – PRICE TARGET 87 (100) PENCE
RBC CUTS HICL INFRASTRUCTURE PRICE TARGET TO 165 (175) PENCE – ‘OUTPERFORM’
BARCLAYS RAISES VH Global Sustainable Energy Opp target to 89 (88) p – ‘EQUAL WEIGHT’
BARCLAYS RAISES FORESIGHT SOLAR FUND TARGET TO 102 (99) PENCE – ‘EQUAL WEIGHT’
BARCLAYS CUTS OCTOPUS RENEWABLES INFRASTRUCTURE TRUST TARGET TO 88 (98)P – ‘OVER WEIGHT’
BARCLAYS CUTS BLUEFIELD SOLAR INCOME FUND TARGET TO 128 (132) P – ‘OVERWEIGHT’
JEFFERIES CUTS ASSURA TO ‘HOLD’ (BUY) – PRICE TARGET 45 (52) PENCE
Q1 2024 Dividend Declaration
The Company declares that it will pay a dividend of 1.20 pence per share (“pps”) for the period 1 January 2024 to 31 March 2024, (1 January 2023 to 31 March 2023: 1.65pps). The entire dividend will be paid as a REIT property income distribution (“PID”).
Shareholders have the option to invest their dividend in a Dividend Reinvestment Plan (“DRIP”), and more details can be found on the Company’s website https://www.regionalreit.com/investors/investors-dividend/dividend-reinvestment-plan.
The key dates relating to this dividend are:
| Ex-dividend date | 30 May 2024 |
| Record date | 31 May 2024 |
| Last day for DRIP election | 21 June 2024 |
| Payment date | 12 July 2024 |
The level of future payments of dividends will be determined by the Board having regard to, among other factors, the financial position and performance of the Group at the relevant time, UK REIT requirements, the interest of shareholders and the long term future of the Company.
Stephen Inglis, CEO of London & Scottish Property Investment Management, Asset Manager commented:
“During the period under review, rent collection remained strong, positive leasing momentum was maintained, EPC ratings continued to improve, and the disposals programme remains on track for 2024.
“With inflation pressures subsiding we expect this to lead to an easing of pressure on the wider economy and in turn the likely reduction in the borrowing cost environment. The combination of these two factors should see a positive impact on the investment market and transactional activity, assisting the sales programme and the value of our assets.
“We are acutely aware of the need to reduce our LTV back towards the 40% long term target and finding the most appropriate solution for the retail bond, which is due to mature in August. We continuing to progress the work on debt and equity refinancing options available to the Company, whilst executing the controlled disposal programme.
“The Board continues to align the dividend with earnings and has today declared the Q1 2024 dividend of 1.20pps for the period.”
££££££££££££££
Dividend unchanged, a strong hold.
21 May 2024
Expected US returns are likely to disappoint investors, said Redwheel’s Ian Lance.
By Matteo Anelli
Senior reporter, Trustnet
The US has been investors’ favourite market for more than a decade and particularly so in 2023 and 2024. However, Temple Bar manager Ian Lance warned fans of the New World should reconsider their positions or be willing to lose on average 4% of their money each year for the next 12 years.
For UK investors who maxed out their £20,000 ISA allowance this past financial year, this could mean be losing up to £7,745 by 2036, if that money was all invested in the S&P 500.
For investors who didn’t go all-in and allocated approximately 70% to the US – for example through the MSCI World index, whose weighting to the US is 70% – the losses from the US portion of the tracker on the £20,000 initial investment would amount to £5,422.
This is what can be drawn from the chart below, put together by John Hussman of Hussman Strategic Advisors. The culprit for this is valuations.
Market cap of non-financial US companies as a ratio to their gross-value added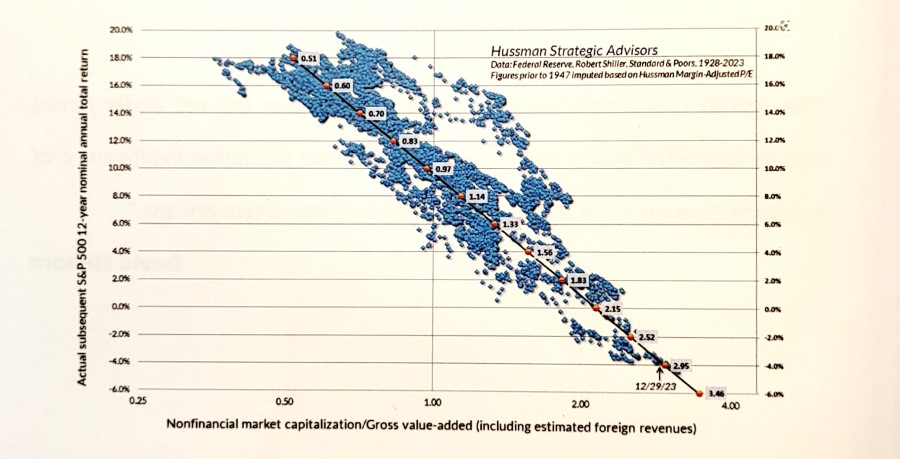
Source: Redwheel, Hussman Strategic Advisors
“The market has become too valuation-agnostic,” Lance explained. “People disregard them, but valuations do drive future returns.”
The chart above shows the US stock market’s annualised returns 12 years on from the point of purchase (on the y axis), in connection to valuations (across the x axis, cheap on the left-hand side, expensive on the right-hand side).
Unsurprisingly to Lance, buying the US market on a ratio of 0.5x made investors about 18% per year, while buying them off at an average valuation of 1x produced an average return of about 9%.
“And then just take a look at where we are today, over the far right-hand side of the chart. If that data holds, by buying the US stock market today you should expect to lose 4% per annum for the next 12 years.”
“Although the US looks this expensive, lots of investors that I know of have 70% of their clients’ equity money invested in the US market on those very high valuations.”
Other US value managers agreed with Lance. One of them was Phoenix-based Cole Smead, manager of Smead US Value UCITS, who called the US “the most over-owned market in the world” and what’s going on in it “a craze and a mania”. He came to this conclusion using the chart below.
US household equity ownership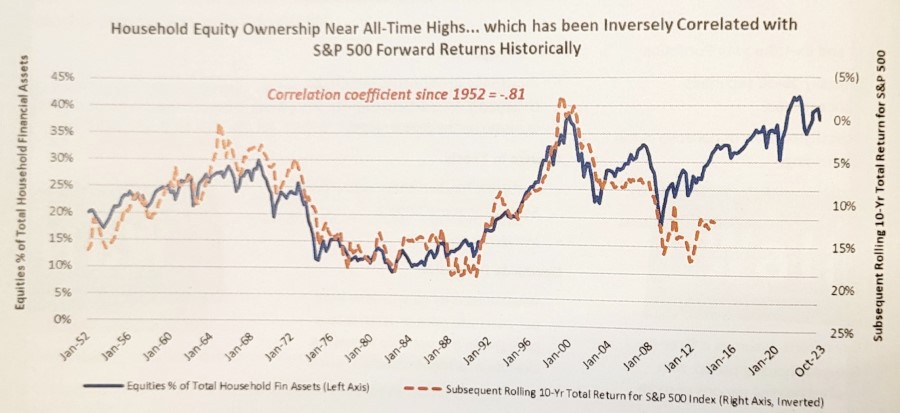
Source: Federal Reserve Economic Data, Bloomberg
The blue line shows American households ownership of stocks as a percentage of US household financial assets. There are three highs in this dataset – 1969, 1999 and 2021, which was the highest so far. The orange line displays the subsequent 10-year rolling-returns of the S&P 500.
“You’ll notice the y axis starts negative on the right side and it ends positive on the bottom, and that’s because these two datasets have a powerful relationship to be negatively correlated,” Smead said.
“This is not particularly shocking. When everyone’s excited about stocks, how does broad common stock participation United States do, as noted by the S&P 500? It does terribly.”
With this, the manager wants to prepare investors for the upcoming stock market failure, whereby the market will fail to make money in real (inflation-adjusted) terms.
In 1969, the 10-year forward return of the S&P 500 was 5.9%. If that sounds not too bad, there’s a catch. The decade started with 6% inflation and ended it with 13.3%, amounting to a 4-5% real negative return.
Again in 1999, investors lost almost 1%. With 3% inflation during the decade of the 2000s, they ended up losing 3-4% in real terms, all of which are examples of stock market failure in Smead’s opinion.
“The highs in this data set argue that the S&P is going to make negative returns in real terms. When I hear people say that you can’t lose money over 10 years in stock markets, I say you absolutely can. You can be broadly diversified and still lose money in stocks,” he said.
“The US is the most over-owned market, the biggest casino in the world. What’s going on with the meme stocks stocks such as Coinbase Global and Gamestop Corporation, which can maintain elevated prices regardless of their underlying worth thanks to their web-based popularity is just evidence that this is a craze and mania and the biggest danger to global capital today.”

I’ve sold the portfolio shares in SMIF for a profit of £160.50 including the dividend earned but not received.
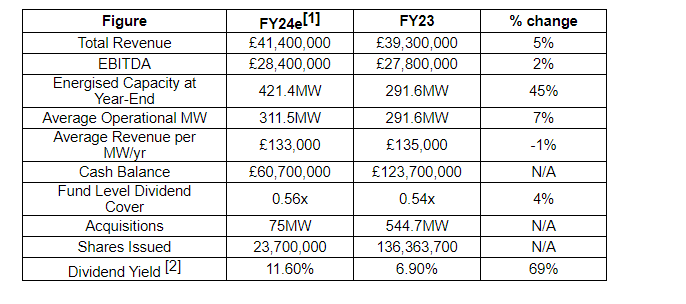
I’ve bought 14768 shares in GSF Gore Street Energy for 10k after today’s update, there was a stamp duty charge of £100 included in the buying cost.
At the higher end of the risk profile but a fcast yield
As previously highlighted, the Company reaffirms its dividend target of 7% of NAV for the reported period.

Wall Street’s Most Accurate Analysts’ Views On 3 Tech And Telecom Stocks Delivering High-Dividend Yields
During times of turbulence and uncertainty in the markets, many investors turn to dividend-yielding stocks. These are often companies that have high free cash flows and reward shareholders with a high dividend payout.
Below are the ratings of the most accurate analysts for three high-yielding stocks in the communication services sector.
Sinclair, Inc. (NASDAQ:SBGI)
Dividend Yield: 6.87%
Rosenblatt analyst Barton Crockett maintained a Neutral rating and raised the price target from $10.4 to $15.7 on Jan 18. This analyst has an accuracy rate of 68%.
Guggenheim analyst Curry Baker maintained a Buy rating and cut the price target from $30 to $20 on Nov. 3, 2023. This analyst has an accuracy rate of 67%.
Recent News: On May 8, Sinclair reported financial results for the three months ended March 31, 2024.
Verizon Communications Inc. (NYSE:VZ)
Dividend Yield: 6.64%
Tigress Financial analyst Ivan Feinseth maintained a Buy rating and raised the price target from $50 to $52 on May 17. This analyst has an accuracy rate of 71%.
Oppenheimer analyst Timothy Horan maintained an Outperform rating with a price target of $48 on April 23. This analyst has an accuracy rate of 70%.
Recent News: On April 22, Verizon Communications reported fiscal first-quarter 2024 results. Its sales increased 0.2% year over year to $32.98 billion, marginally missing the consensus of $33.24 billion.
Telephone and Data Systems, Inc. (NYSE:TDS)
Dividend Yield: 3.65%
Morgan Stanley analyst Simon Flannery maintained an Equal-Weight rating and increased the price target from $15 to $18 on Sept. 11, 2023. This analyst has an accuracy rate of 65%.
Citigroup analyst Michael Rollins upgraded the stock from Neutral to Buy with a price target of $16 on Aug. 4, 2023. This analyst has an accuracy rate of 75%.
Recent News: On May 3, Telephone and Data posted upbeat quarterly sales.

Keep watching and waiting, it could be prudent to take some of the money off the table, the worst thing that could happen is the price continues to rise and u make even more money.
U might be considering buying Assura as the current yield is suitable for either an accumulation or de-accumulation portfolio.
The first check is their dividend yield 7.6%. Tick
Second their dividend history. Tick

Third dividend guidance

Assura increases quarterly dividend to 0.84p from 0.82p; FY24 dividend 3.24p vs 3.08p Tick
Fourth chart don’t buy a ‘falling knife’.

Uncertain which way the share will trade but if u want to lock in the dividend it matters little. The Trust was in the portfolio but was sold for a small profit to re-invest in a higher yielder.
If the blog portfolio was a de-accumulation portfolio I would still own the Trust.
That’s my research but as always best to DYOR. GL

If u are investing your hard earned for your retirement that are two stages to consider.
ACCUMULATION
Weak markets.
Where because u have time on your side although u will not be making a profit from your portfolio u will be able to re-invest the dividends at a higher yield also getting more shares for your money. U may be willing to take a higher risk/reward but stick to your plan.
Strong markets where u will be able to book some profits, especially as the price rises the yield will fall and u can re-invest in a higher yielder.
DE-ACCUMULATION
The only thing that is of interest to u, is your portfolio of Trusts going to pay their next dividend ? The risk/reward would need to be at the lower end of risk so u might be willing to take a lower yield than when u were in the accumulation period.
© 2026 Passive Income Live
Theme by Anders Noren — Up ↑