How I’d turn £100 a month into a lifetime of passive income Story by Charlie Keough
Building streams of passive income is a goal for many and making extra funds outside of my main source of income will provide me with an extra layer of financial security.
I don’t need an abundance of money to start doing this. With just £100 a month, here’s what I’d do
Choosing the best
I’d put my money to work in the stock market. Some savings accounts may offer relatively attractive returns at the moment. However, with my money sitting in the bank, I’m missing out on the growth opportunities that the market provides.
More specifically, I think the FTSE 100 is a strong entry point. Many of its constituents are household names whose products are used every day. And as Warren Buffett says, it’s best to invest in companies we understand.
On top of that, the Footsie provides some of the best passive income opportunities. After all, its average dividend yield is around 4%. For comparison, the S&P 500’s is under half of that.
Within the index, I’d look for companies that have a track record of providing stable growth. While past performance is no indication of future returns, this will offer me greater confidence that the companies I invest in will be able to withstand any economic downturn, such as what we are seeing right now.
I must also do my due diligence. For example, I’d be looking at the financial health of companies, more specifically their balance sheets. A firm with high levels of debt may be at risk should it come under financial pressure. What’s more, with interest rates amplified, and predictions the UK base rate won’t decrease to 2%-3% until the tail end of next year, debt will be more expensive to finance.
I’d also look for businesses that have a history of returning value to shareholders, such as Dividend Aristocrats. These are companies that have paid and increased payouts to shareholders for a prolonged period.
How much can I make?
£100 a month is equivalent to £25 a week. And by cutting back my spending, for example, by a coffee every day, I could more than easily afford this.
With an average annual return of 8%, £100 a month after 30 years would equate to a portfolio worth around £125,000. At a 4% dividend rate, I’d be earning just over £9,500 a year in passive income by year 30.
Of course, I’m aware these returns aren’t guaranteed. The stock market is volatile and historical performance may not repeat itself. Nevertheless, nearly 10 grand a year in passive income is not to be sniffed at, even with the impact of inflation. And this additional money could pave the way to a more comfortable retirement.
The post How I’d turn £100 a month into a lifetime of passive income appeared first on The Motley Fool UK.
A billionaire has offered an insight into his financial success – explaining how the process of “getting rich” begins with a simple daily task.
Back in 2011, the star shared a post entitled, How To Get Rich, in which detailed his path from living with five roommates and sleeping on a floor to appearing on Forbes’ World’s Richest People list. “It doesn’t suck to be rich,” Cuban exclaimed. “The question everyone wants answered, is how to get there.”
Whilst there is no “template” to guarantee success for everyone, there are also “no shortcuts” either, he added. The initial advice is simple, however. “Save your money. Save as much money as you possibly can,” Cuban said. Of course, this is easier said than done, but he goes on to elaborate: “Instead of coffee, drink water. Instead of going to McDonald’s, eat mac and cheese.”
Cuban, who also offers financial tips on his TikTok account, continued: “If you use a credit card, you don’t want to be rich. The first step to getting rich, requires discipline. If you really want to be rich, you need to find the discipline, can you?”
Cuban went on to emphasise that the greatest rate of return you will earn is on your own personal spending. “Being a smart shopper is the first step to getting rich,” he said. “You have to give things up and that doesn’t work for everyone, particularly if you have a family.
“That is reality. But whatever you can save, save it. As much as you possibly can. Then put it in 6 month CDs in the bank. The first step to getting rich is having cash available. You arent saving for retirement. You are saving for the moment you need cash.”
Once you’ve began to notice progress this way, Cuban said the second part of your plan should involve becoming an expert in your chosen field – whether that be your passion, a specific industry or a skill set. “Find the one you love the best and GET A JOB in the business that supports it,” the billionaire advised. “It may not be the perfect job, but there is no perfect path to getting rich.”
“It could be as a clerk, a salesperson, whatever you can find,” Cuban added. “You have to start learning the business somewhere. Instead of paying to go to school somewhere, you are getting paid to learn. It may not be the perfect job, but there is no perfect path to getting rich.
“Before or after work and on weekends, every single day, read everything there is to read about the business. Go to trade shows, read the trade magazines, spend a lot of time talking to the people you do business with about their business and the people they buy from.”
Cuban warned, however, that the path is not a short-term project. “We aren’t talking days,” he clarified. “We aren’t talking months. We are talking years. Lots of years and maybe decades. I didn’t say this was a get rich quick scheme. This is a get rich path.”
Remember the Snowball never adds more cash to the seed capital, if you can you will increase your retirement Snowball but I guess a billion is a bridge too far.
I just recently got engaged and performed the hunt for the perfect diamond engagement supplant Houston, TX. The option right here is unbelievable! I discovered a magnificent ring that exceeded my requirements engagement rings houston
Muhammad Cheema explains how an investor could target £5,555 in monthly passive income over time by making use of a Stocks and Shares ISA.
Posted by Muhammad Cheema
Published 9 December
Image source: Getty Images
You’re reading a free article with opinions that may differ from The Motley Fool’s Premium Investing Services.
As we approach closer to 2026, investors may be looking for new ways to make passive income.
I believe buying shares is one great way to achieve this. This is because investors only need to research the companies they’re invested in, not manage them.
One tax-efficient way to buy shares for this purpose is to use a Stocks and Shares ISA. You can invest up to £20,000 a year into one, and the dividends received are be tax-free.
Please note that tax treatment depends on the individual circumstances of each client and may be subject to change in future. The content in this article is provided for information purposes only. It is not intended to be, neither does it constitute, any form of tax advice. Readers are responsible for carrying out their own due diligence and for obtaining professional advice before making any investment decisions.
By investing consistently over time, it’s possible that investors could make a sizeable additional income.
So, how much would you need to aim for £5,555 a month? And what shares may help achieve this?
If we target an average portfolio yield of 5%, £1,333,200 would be needed to generate this second income straight away. It’s important to bear in mind that dividends aren’t necessarily guaranteed.
However, I doubt many reading this have that amount of spare cash to use right now. Even if you do, only £20,000 can be invested in an ISA annually to get the benefit of tax-free dividends.
However, it can still be achieved over time. For example, if investors set aside a more reasonable £20,000 initially, and then invest £1,666 a month, they could hit £1,341,746 in 24 years. That’s more than enough to generate £5,555 a month.
Crucially, the £1,666 monthly investment means it’s just under the ISA limit. Moreover, this is computed under some pretty conservative assumptions, notably that annual share price and dividend growth are only 2%. Investors would also need to reinvest their 5% dividends.
the future stream of Pfizer’s dividend is now 3.2% cheaper than it was at the start of the year. Furthermore, its yield is far superior to the S&P 500’s 1.1%.
A juicy 6.7% yield
As mentioned above, an average yield of 5% could help to generate an investor’s passive income machine. That’s why Pfizer (NYSE:PFE) is a good share to consider, with a handsome 6.7% dividend yield.
Since the start of 2025, the pharmaceutical giant has seen its shares fall by 3.2%. Considering the S&P 500 has gained 16.7% over the same period, this has been disappointing.
However, savvy investors will understand that the cost to obtain the future stream of Pfizer’s dividend is now 3.2% cheaper than it was at the start of the year. Furthermore, its yield is far superior to the S&P 500’s 1.1%.
It also has a strong track record of raising its dividend year on year. It’s now increased every year since 2010.
There are some risks with respect to the company. The biggest is that it has several patents coming to an end over the next few years.
For example, Eliquis, its top-selling medicine, is set to lose its patent exclusivity in Europe in 2026 and in the US in 2028.
However, I still believe the firm’s long-term prospects remain strong. This is because it has plenty of exciting candidates in its pipeline, such as its PF-4044 medicine, which management believes could be used to treat various types of cancer.
While the company may have struggled with growth over the last few years, I believe it has solid foundations to bounce back and resume growth. That’s why I believe investors should consider its share
Will the stock market crash next year? Nobody knows for sure, including our writer. Here’s what he’s doing now to prep for whenever a crash comes.
Posted by Christopher Ruane
Published 9 December
Image source: Getty Images
You’re reading a free article with opinions that may differ from The Motley Fool’s Premium Investing Services.
At the start of 2025, I saw various reasons to be concerned about where the stock market might go. 2025 is not over yet, but so far we have avoided a stock market crash
April did see a ‘correction’, commonly defined as a sudden fall of 10% or more, whereas a crash requires 20% or greater.
The FTSE 100’s 11% fall in the first week of April now feels like a distant memory. Indeed, since then, the flagship UK share index has risen 26%.
But is the British economy 26% stronger than in April – or at all?
Growing more nervous about valuations
I do not think the economy is in notably better shape than it was earlier in the year.
In itself though, that might not be relevant in terms of where the UK stock market goes from here.
After all, the FTSE100 remains less aggressively valued relative to earnings than its US counterpart and some other overseas stock market indexes.
Broadly speaking, investor sentiment has held up so far this year despite wobbles along the way. That could continue.
Could it happen in 2026 ? Absolutely. Geopolitical risks remain high and the global economic outlook is not that strong.
However, that was true a year ago – and since then, stock markets on both sides of the pond have moved upwards. Key indexes including the FTSE 100 have repeatedly set new all-time highs along the way.
Rather than trying to time the market, which it is impossible to do with absolute confidence, I am instead making hay while the sun shines – but also preparing for a storm!
Compiling a list of brilliant shares to buy
By ‘making hay’, I mean that this year I have bought shares I think potentially offer great value.
Some, such as JDSports and Diageo, have seen their prices tumble this year even while the broader FTSE 100 index has moved upwards strongly. I have bought both.
But I am also preparing for that storm even though I do not know when it will happen.
Specifically, I have been looking for great companies I would love to invest in, but that currently sell for more than I want to pay.
That way, if a market crash brings prices tumbling down, I should be ready.
One share on my list
For example, Games Workshop (LSE: GAW) is the sort of quality company I would be happy to own – if only I could buy it at what I saw as an attractive price.
The Games Workshop share price has been riding high, having risen 92% over the past five years.
Selling fantasy games and associated paraphernalia is big business – and offers attractive profit margins. Games Workshop benefits from its own intellectual property including franchises like Warhammer.
It also has a well-heeled, loyal customer base and proven business model. So even in a tough economy, it may keep doing well.
The company’s concentrated manufacturing base brings risks, especially if anything happens to take its main factory complex offline.
But at the right price I would gladly add some of its shares to my portfolio.
The anticipated 0.25% Fed rate cut is likely already priced in, setting up potential for a ‘sell the news’ event.
I expect institutional money managers are aggressively buying into the year-end rally, especially in large-cap stocks, to catch up on benchmarks.
A brief, sharp sell-off of up to -5% may occur post-rate cut, triggered by a potential breakout in the 10-year Treasury yield above recent ranges.
I plan to trim expensive positions, hold 5-7% cash, and buy discounted quality names, like NFLX, SNOW, and DDOG, if the sell-off materializes.
Getty Images/Retrofile RF
The Rate Cut May Produce a “Sell the news” Event
The FOMC meeting this week could move the market
This week, on December 10th, it should be no surprise to anyone interested in the stock market that another rate cut of .25% will be announced (cite). The speculation lies in whether this is a hawkish cut (as in “one and down”), or a dovish cut. My take is that the Fed chair will try to couch the announcement as neutral as possible, but during the Q&A, he will appear dovish as he, in my opinion, almost always does. So what’s my problem? Chairman Powell will cut rates, and in all likelihood leave the door open for more cuts next year. Boom!. We are off to the races, we hear the jingling of bells, and the “Santa Claus Rally” gets on to a strong start. We will finish going into January over 7000! We could even see 7200 before the end of January. Most of that move will be in recognition of profit growth, and not a rise in price/earnings multiples.
So if I am taking such a bullish stance, what’s my problem?
As most of my loyal readers know by now, nearly every week, I publish an analysis where I share my thoughts memoir-style. This means that I am sharing my mindset and featuring what the most important undercurrents of the market are. Sometimes I write about individual stocks that intrigue me, but if I see a more macro-view change in the overall market, I am sharing that with all of you. My approach to generating returns is to actively manage my investments and be very mindful of where the market might be taking us. It is very difficult to be exactly right week-in and week-out, but I do believe that it is important to create a picture, and if the market deviates from that picture, then adjust tactics as the week progresses. I think that market participants have already discounted a dovish Fed.
I know that correlation is not causation, but allow me to aver that the recent strength in the market could be (in my opinion, and probably many others) attributed to the excited anticipation of this rate cut. Yes, this is the year-end period, which is widely believed to be the best time of the year, the “Santa Claus Rally”. Not only because it is Christmas or the New Year’s celebrations just up ahead, but because… well, actually, no one really knows why. To be precise, according to our friends at Investopedia.com, the rally, when it occurs, officially starts the week before December 24th (cite). The article goes on to state that some believe it lasts into the first 2 days of January.
This rally starts next week, not this week
I know the likelihood of predicting what the market will do over such a short period is a fool’s errand. I am not doing that, I am pointing out risks, and in fact, this article is a continuation of last week’s article (cite), where I did say we are likely to rally upward and that the closer we get to the old high, the more fragile this rally gets. I also opined that quite often when the price of an equity or index reaches an old high, the first attempt is not usually successful.
Money Managers/Institutions, I believe, are now part of the buying
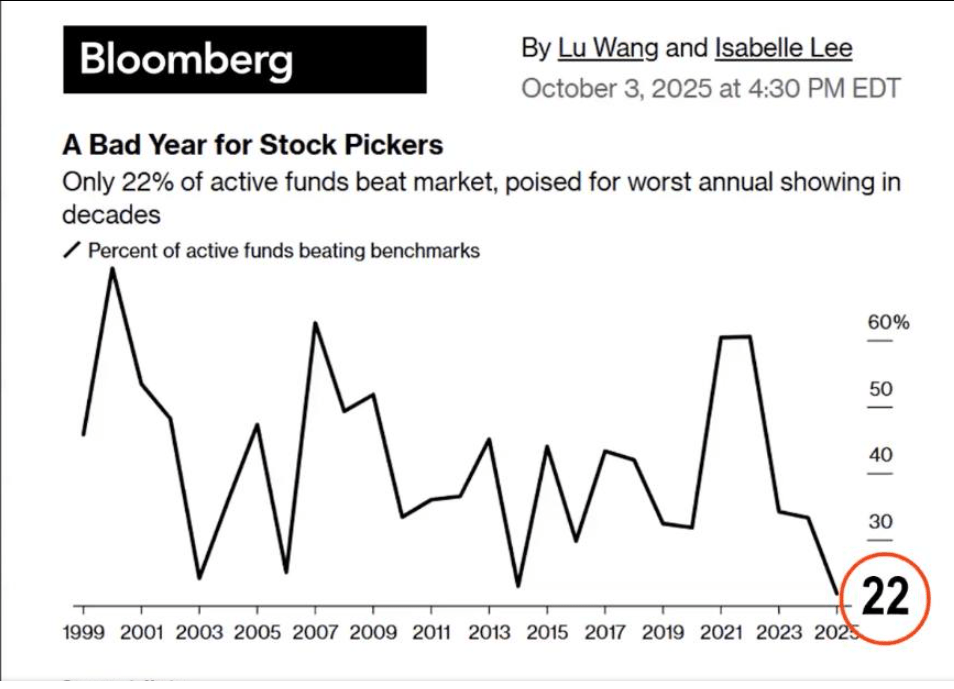
As you’ll see on the graph below, shows the performance of the “buy side”, are meeting their benchmarks, and they are likely buying into this year-end rally, as you’ll see from the charts below it would be logical for them to push more cash into equities, possibly directly to the biggest, most liquid stocks out there – the magnificent 7. I don’t see a way that I can prove this, but if I were a money manager, that is what I would do, especially since so many of them are underperforming right now.
There are explanations for this phenomenon that do make sense in normal times, such as “window dressing,” where money managers go and buy the best-performing stocks, so their clients can see that their managers were right on top of the winners (cite). There is also a cohort of managers who did not beat their benchmarks, or even meet them. As a result, they pour all the cash that they had set aside into equities. in the hope that the market has a big finish to the year, so they can catch up. My opinion of this motivation to buy from professional money management is my opinion, but formed by years of observing the markets. Here is a very insightful chart from our friends at Bloomberg.com
Bloomberg.com
The above chart might buttress the notion that money managers might be more aggressive buyers than usual.
What do I mean by sell the news?
It is half of an old Wall Street saying, “Buy the rumor, and sell the News (or Fact).” It is simply the observation that the market is forward-looking and tries to anticipate what is going to happen in the future. So, as expectations of rate cuts grew in the last several weeks, even before the November cut, it was already the accepted wisdom that there would be another cut, a .25% cut on December 10th, as I had cited in the first paragraph. The stock market index is rallying strongly in anticipation, and by the time the cut is announced, most of those anticipating this news have already put their money to work. I would say this in normal times, but with many professionals behind on their benchmarks, I believe many are piling in.
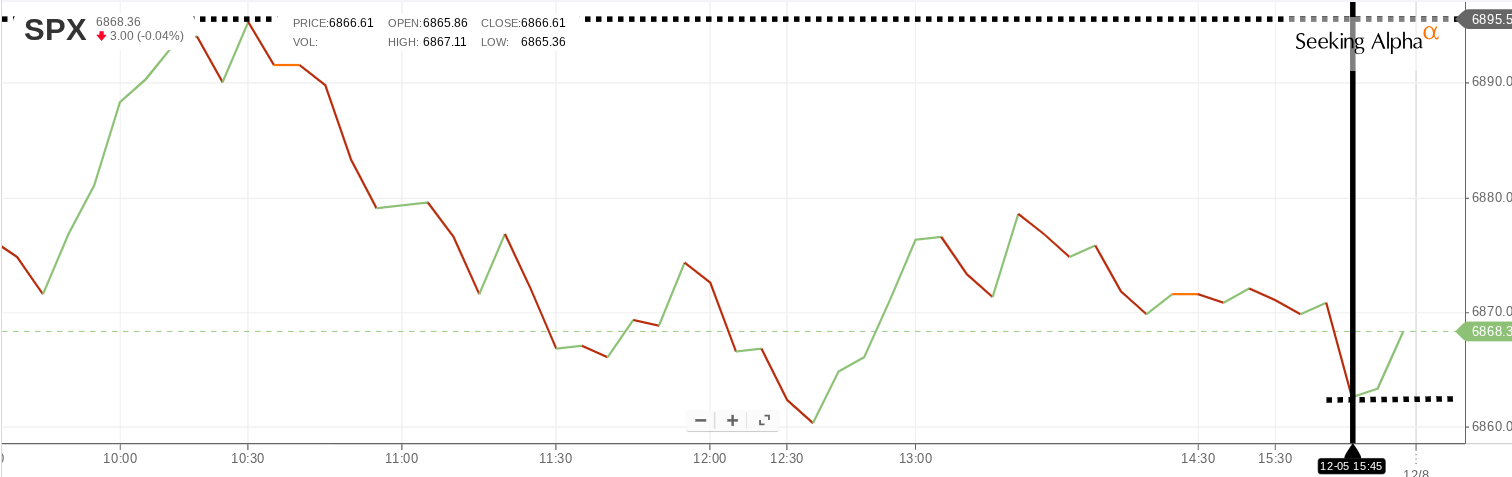
What makes me think so ? This is my opinion borne of experience. The rally this week has been very strong. This past Friday at 10:30 am, the S&P 500 reached all the way to 6895, just 25 points from the all-time high; the previous day, the market closed at 6856. That was a nice pop, but then the index started to slide almost the entire day, reaching a low of 5662 at 3:45 pm, and with only 15 minutes left, and as it was a Friday, I assumed we would end in the minus column. By assuming that Friday would be a down day, market participants tend to take some profits at the end of the week, especially when there is no particularly bullish news that day. The spike at 10 am was due to the lower PCE data, which was not super relevant since it was from September. So at that 3:45 pm mark, instead of falling further and ending in the red, buyers came in to elevate the index to 5670, and a new high end the week. What happened here? I think there were a lot of “market-on-close orders” coming in. Who normally uses market-on-close orders? Most institutional investors use market-on-close orders; typically, these orders begin to be executed about 15 minutes before the actual close. Look at this daily chart. (cite)
Seeking Alpha
That jump to 5870 started at exactly 15 minutes before the close. I believe this price action buttresses the argument that Institutions are buying this rally. I was closely watching the close as I always do, and fully expected that the downtrend that started at 10.30 this morning would just continue into the close. I was pleasantly surprised by the change in direction in the last few minutes of the day. Only in the course of this writing did this occur to me. I think there will be more buying on Monday and Tuesday, and once everyone is on the bullish side of the boat, the risk on Wednesday is that selling will begin.
But wait, there’s more!
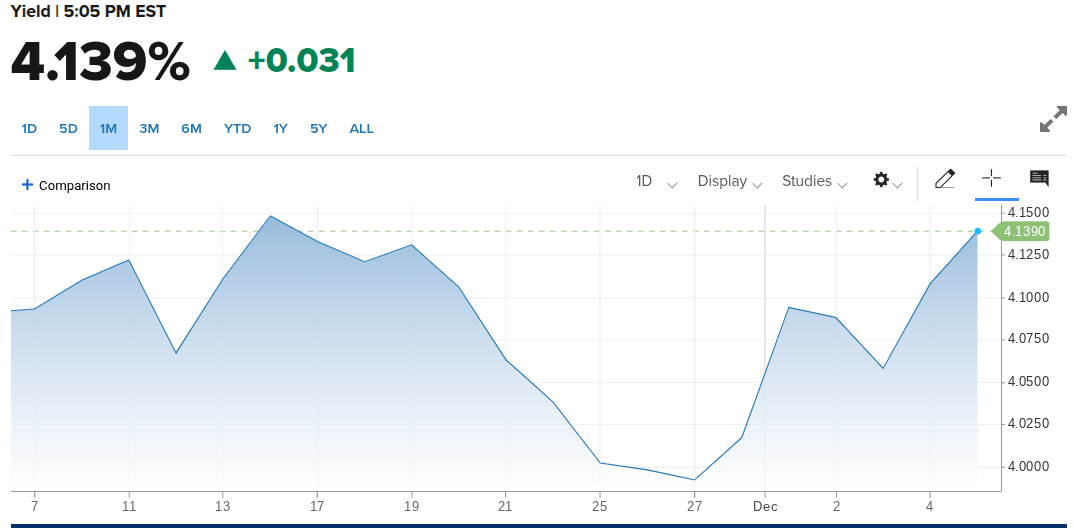
If it is just about selling the news, I doubt that it will be a very big sell-off, and may not even be sustained for a full day the following Thursday. No, there is one more macro issue that I believe will crop up and give several days of selling. Below is the 10-year US Treasury bond. Check out this chart from our friends at CNBC.com. This is a one-month chart, but I want you to look at that drop on November 27. It was on that day that the rate for the 10-year fell below 4%. Ever since that time, alongside the growing confidence that another cut was coming, the rate has climbed, reaching nearly 4.14% at the end of Friday’s close at 4.139%.
CNBC.com
I believe the 10-Y breaks above its recent range and in proximity to the aftermath of the rate cut it will be the catalyst to give us a sharp sell-off, perhaps as much as -5%. I am going to buy that sale off. I don’t expect the rate to break above 4.25%, and after the rate settles down, the tally should continue, hitting 7,000 by year-end. If you are a buy-and-hold type, then make sure you have the resolve to stay the course if there is sharp selling. The media is going to love this unexpected news and will amplify the drama. As I am a more active type, I will trim some positions by selling my most expensive shares of those positions, and just have 5% to 7% cash set aside to redeploy. I might choose to buy the same names at a lower price, or pick up something new. I still believe that with patience, even the best names can give you a -20% discount or more, look at Netflix (NFLX)!
This type of low-risk fund could be an option to consider for ISA investors who are waiting for better stock market investment opportunities.
Posted by
Edward Sheldon, CFA
Image source: Getty Images
You’re reading a free article with opinions that may differ from The Motley Fool’s Premium Investing Services.
A lot of investors are concerned that the stock market could be set for a pullback in 2026. That’s understandable as major indexes have had a brilliant run this year and valuations now sit at elevated levels in many cases.
Now, I don’t know if we’re going to see a market slump in 2026. But I’ve been taking some precautions just in case, putting a little bit of my ISA capital into a fund that pays 4%+ annually with near-zero risk.
Savings account-like returns
The product I’m talking about is the Fidelity Cash fund. It’s available to consider on Hargreaves Lansdown and many other investment platforms.
This is a money market fund, meaning that it invests in high-quality, short-term bonds and cash equivalents to generate a small but predictable return. Currently, it has a distribution yield of around 4.5%. And because of the types of investments it makes, the overall risk profile of the cash-like portfolio is very low.
However, even a low-risk fund isn’t entirely risk-free. If we saw another event like the 2008/09 Global Financial Crisis and financial liquidity froze, for example, this fund may not deliver the returns investors are expecting. However, for all intents and purposes, it’s similar to a high-interest savings account (there’s no FSCS protection).
Note that on Hargreaves Lansdown there’s a range of these funds. Some other examples include the Vanguard Sterling Short-Term Money Market fund and the Legal & General Cash fund.
Better than a Cash ISA?
Why not just stick my money into a Cash ISA? Well, the beauty of this product is that if stocks were to slump, I could sell out of it and quickly deploy my capital into investments with more potential within my Stocks and Shares ISA.
In other words, it gives me far more optionality than a Cash ISA. With a Cash ISA, I’m stuck in cash for good and that doesn’t appeal to me as earning less than 5% a year over the long run isn’t going to do much for my wealth.
Returns of 15% a year
As an example, let’s say the market pulls back in the second quarter of 2026 and my favourite investment trust Scottish Mortgage (LSE: SMT) falls 10%. In this scenario, I could quickly sell my Fidelity Cash fund and redeploy the capital into the growth-focused investment trust.
Taking a five-year view, I reckon this product is likely to outperform the Fidelity Cash fund and other cash savings products (eg Cash ISAs) by a wide margin. After all, its top holdings include the likes of Amazon, Nvidia, Taiwan Semi, and SpaceX – which all look set for strong growth in today’s digital world.
Note that over the last decade, the share price of this investment trust has risen about 300%. That translates to a return of about 15% a year.
I’ll point out that this trust is volatile at times due to its growth focus. To enjoy those 15%-a-year returns, investors have had to tolerate some wild share price swings.
I think it’s worth a look though, especially if there’s some market weakness. I see a lot of potential in the long run.