

The big fall in the chart was the ending of the dotcom bubble.
For dotcom read AI, dotcom mania took a long while to reach it’s conclusion so it’s better to follow than repeat. TR or a Dividend Re-investment plan ?

Investment Trust Dividends
The big fall in the chart was the ending of the dotcom bubble.
For dotcom read AI, dotcom mania took a long while to reach it’s conclusion so it’s better to follow than repeat. TR or a Dividend Re-investment plan ?


The graph includes earned dividends which could be re-invested in a high yielding Investment Trust, earning more dividends to re-invest in a high yielding Investment trust.

Whether it’s high-yield dividends or growth, there are plenty of options on the London Stock Exchange to help build long-term wealth.
Posted by Ben McPoland
Published 21 July

When investing, your capital is at risk. The value of your investments can go down as well as up and you may get back less than you put in.Read More
You’re reading a free article with opinions that may differ from The Motley Fool’s Premium Investing Services.
The London Stock Exchange is packed with thousands of shares, investment trusts, and exchange-traded funds (ETFs). So much so, the challenge isn’t finding investment opportunities, but narrowing them down.
With this in mind, here are two ETFs that I reckon are worth considering for a £20,000 Stocks and Shares ISA.
First up is the iShares UK Dividend UCITS ETF (LSE: IUKD). This gives diversified exposure to high-yield income stocks from the Footsie and FTSE 250.
It currently has 51 holdings, including British American Tobacco, Legal & General, BP, Aviva, Lloyds, and HSBC. The dividend yield is 5.32%, comfortably above the FTSE 100‘s 3.4%.
In practice, this means the ETF is offering £532 in annual income from a £10,000 investment. Then there’s the possibility of share price appreciation on top, though markets do fall as well as rise, of course.
Now, one risk here is that the focus is solely on dividend stocks listed in the UK. Therefore, if this type of share suddenly falls out of favour, the ETF would underperform. Plus, another pandemic-type event could see many companies suspend dividends again.
However, I’m encouraged by the share price performance here. Over five years, the iShares UK Dividend ETF is up around 50%. Adding in the income too, that’s a solid return.
Looking at the portfolio, which contains many cheap UK shares, I think the ETF will carry on doing well in future.
Next is the iShares Automation & Robotics UCITS ETF (LSE: RBTX). As the name implies, this tracks global companies dedicated to automation and robotics innovation (140 of them).
This area is expected to enjoy robust growth over the next decade due to manufacturing and warehouse automation, industrial Internet of Things, self-driving cars, and intelligent software that can execute tasks autonomously (AI agents).
Top holdings include Nvidia and Advanced Micro Devices (AMD), the chipmakers that provide the computational muscle behind everything from AI chatbots to humanoid robots.
On the industrial side, Rockwell Automation and Emerson Electric are powering the next generation of smart manufacturing, while Intuitive Surgical is a pioneer in robotic-assisted surgery.
ServiceNow and Snowflake are involved with AI agents in one way or another. As Amazon CEO Andy Jassy recently said: “Many of these agents have yet to be built, but make no mistake, they’re coming, and coming fast.”
Since its launch in 2016, the iShares Automation & Robotics ETF is up 210%. That’s impressive, while the ongoing charge of 0.40 % is reasonable for a high-quality thematic ETF, in my opinion.
As for risks, areas of the robotics industry can be cyclical, so a global slowdown could dent performance for a while. Also, nearly 69% of the fund is in technology stocks, meaning any sell-off in that sector would impact the fund.
Looking ahead, however, I’m bullish on this ETF’s prospects. There’s a good mixture of large and smaller business across hardware, software, and industrial engineering.
Nvidia CEO Jensen Huang has declared that “we are at the beginning of a new industrial revolution“. This ETF offers bags of exposure to this, making it worth considering for a growth-oriented ISA.

Earning money from dividends in an ISA is one way to set up passive income streams. Our writer explains how it might work in practice.
Posted by Christopher Ruane
Published 22 July

When investing, your capital is at risk. The value of your investments can go down as well as up and you may get back less than you put in.
You’re reading a free article with opinions that may differ from The Motley Fool’s Premium Investing Services.
There are different ways to earn passive income and one that I like myself is in blue-chip shares that pay dividends. Doing that with a £20,000 ISA could see income streams of hundreds of pounds per month in future. Here’s how.
Dividends are one way for a business to use excess cash it generates. There are others, though – and not all businesses generate spare cash. So, dividends are never guaranteed and even when they have been paid before, they are not guaranteed to last.
Therefore, I think it is important for an investor to take care when choosing dividend shares for their ISA. For example, just looking at a current yield does not necessarily set a reasonable expectation of likely future income. Instead, one needs to understand the source of a firm’s free cash flows and how likely they are to continue.
For example, does it have a proven business model? As it grows sales, does it make money or lose money? What sorts of expenditure might crop up, using up money otherwise available to pay dividends?
But while dividends can come and go, a diversified selection of the right shares can generate meaningful passive income – especially for someone who is willing to take a long-term approach to investing.
For example, if a £20,000 Stocks and Shares ISA was compounded at 8% annually for 15 years, it should grow to a size where an 8% dividend yield would equate to £423 per month on average in passive income. That is without having to take any capital out of the tax-free wrapper.
Please note that tax treatment depends on the individual circumstances of each client and may be subject to change in future. The content in this article is provided for information purposes only. It is not intended to be, neither does it constitute, any form of tax advice. Readers are responsible for carrying out their own due diligence and for obtaining professional advice before making any investment decisions.
That 8% is well above the current average FTSE 100 yield of 3.3%. But the compound annual gain I mentioned above can be driven not only by dividends, but also by share price changes. And while the average yield is 3.3%, plenty of FTSE 100 firms offer higher yields.
As an example, one share I think investors should consider is Lucky Strike manufacturer British American Tobacco (LSE: BATS).
Not only it its yield 6.3%, the company aims to keep raising its dividend per share annually – as it has already done for decades.
Can it do that?
On the one hand, a strong stable of premium brands and proven massive cash flow generation potential work in its favour. On the other hand, declining cigarette sales volumes pose a challenge to the business even maintaining, let alone growing, its profitability. Revenues have fallen for the past couple of years in a row.
All shares involve risks, but the long-term demand picture for cigarettes is a notable risk, in my view, not only for British American but also rivals. However, I continue to think it has sizeable cash generation potential as a business. It continues to sell billions of cigarettes per week.
In my example I mentioned a £20,000 ISA. The same approach could work with less money – even much less – although the passive income streams generated would be proportionately smaller.
An obvious first move for a passive income hunter would be to compare some of the many different Stocks and Shares ISAs available, to decide what one suits their own needs best.

Michael Foster, Investment Strategist
Updated: July 14, 2025

With stocks levitating higher, you just might be starting to peek at other investment ideas (bonds? REITs?) to spread out your risk and, most importantly, boost your dividends.
It’s always a smart strategy, and especially so now. We ran through an easy way to diversify while grabbing yourself a healthy 7.9% payout in last Thursday’s article (click here to catch up if you missed it).
“Munis” Cut Your Taxes, Boost Your Payouts—But Timing Matters
Which brings me to my favorite income plays, closed-end funds (CEFs), and in particular those that hold municipal bonds. (“Munis” are issued by state and local governments to fund infrastructure projects. Their dividends are tax-free for most Americans.)
In a second, we’ll look at one overpriced muni-bond CEF that’s about to tumble—and another kicking out a 7.4% dividend that’s trading at a rare discount (I’m talking 10% off its “true” value here).
How an 8% Yield Becomes 13%
Muni-bond CEFs’ tax breaks can make a big difference. To give you a sense of just how much of a difference, the one muni-bond CEF in the portfolio of my CEF Insider advisory yields around 8%, but that could be worth 13% to you on a taxable-equivalent basis depending on your tax bracket.
Despite that, we do only hold that one muni-bond CEF now. That’s in part because, when you look at benchmark index funds for the S&P 500, high-yield bonds, REITs and munis, you’ll see that munis (in green below) were the worst performers through the first half of this year.
Munis Trailed the Pack in the First Half of ’25
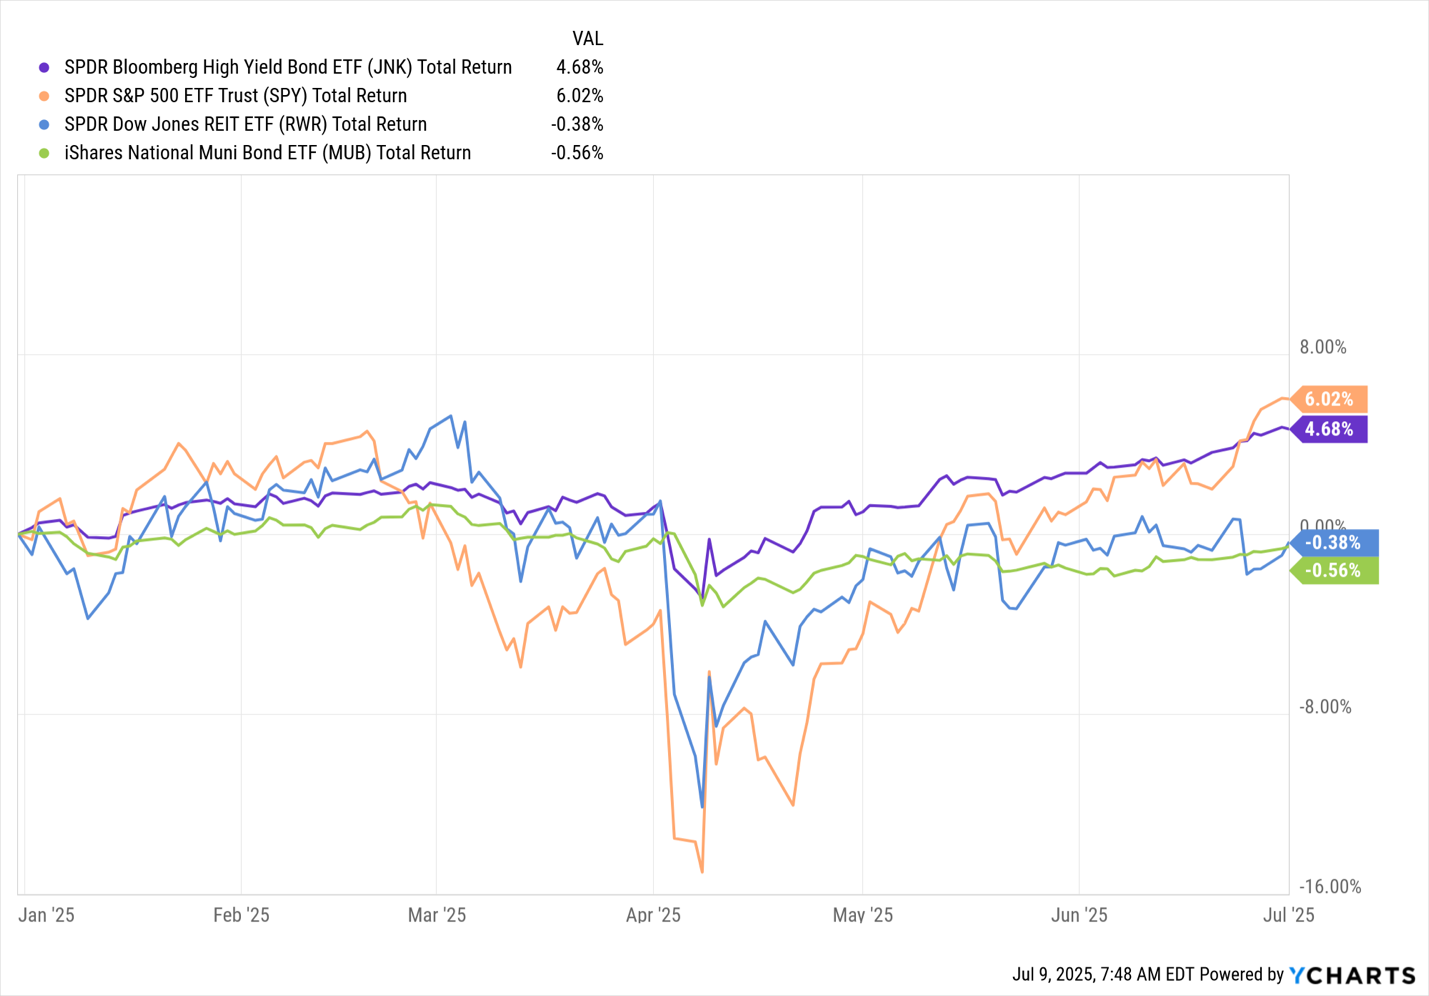
However, with the recovery in the S&P 500, it seems that munis’ fortunes will probably change for the better as investors begin to fear a correction in the stock market and look for a steady, high-yielding (not to mention hugely tax-advantaged) alternative.
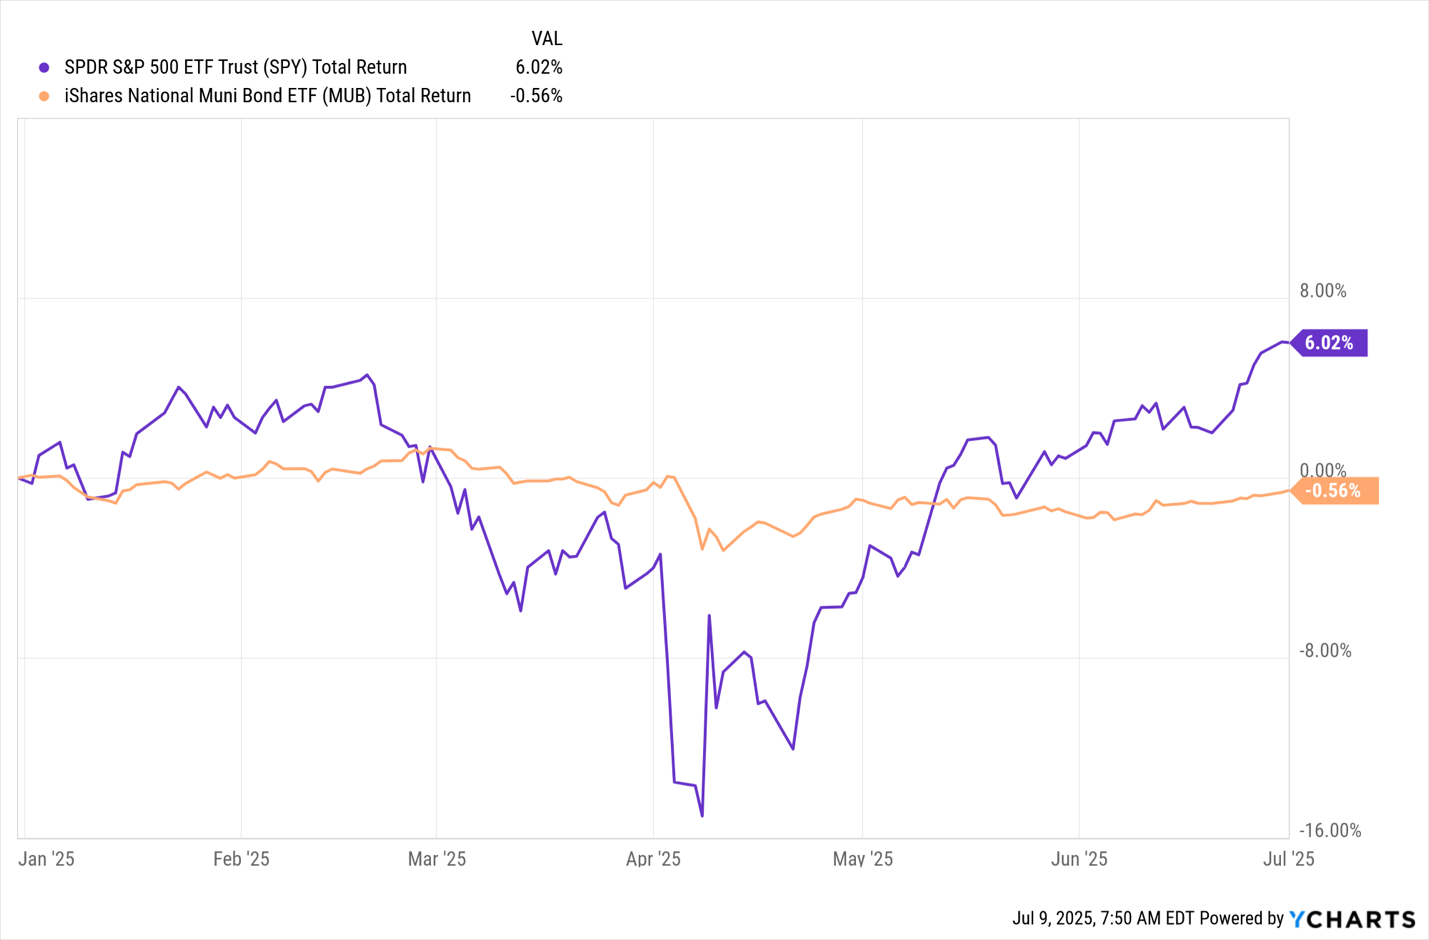
Over the last five years, the main muni-bond index fund has been basically flat. That’s partly because stocks have been on a solid run, drawing attention away from munis.
But here’s the thing: When this kind of lull in the muni-bond market happens, it’s usually followed by a strong showing, especially if the rest of the market pulls back.
Muni Bonds Delivered in the 2008 Mess
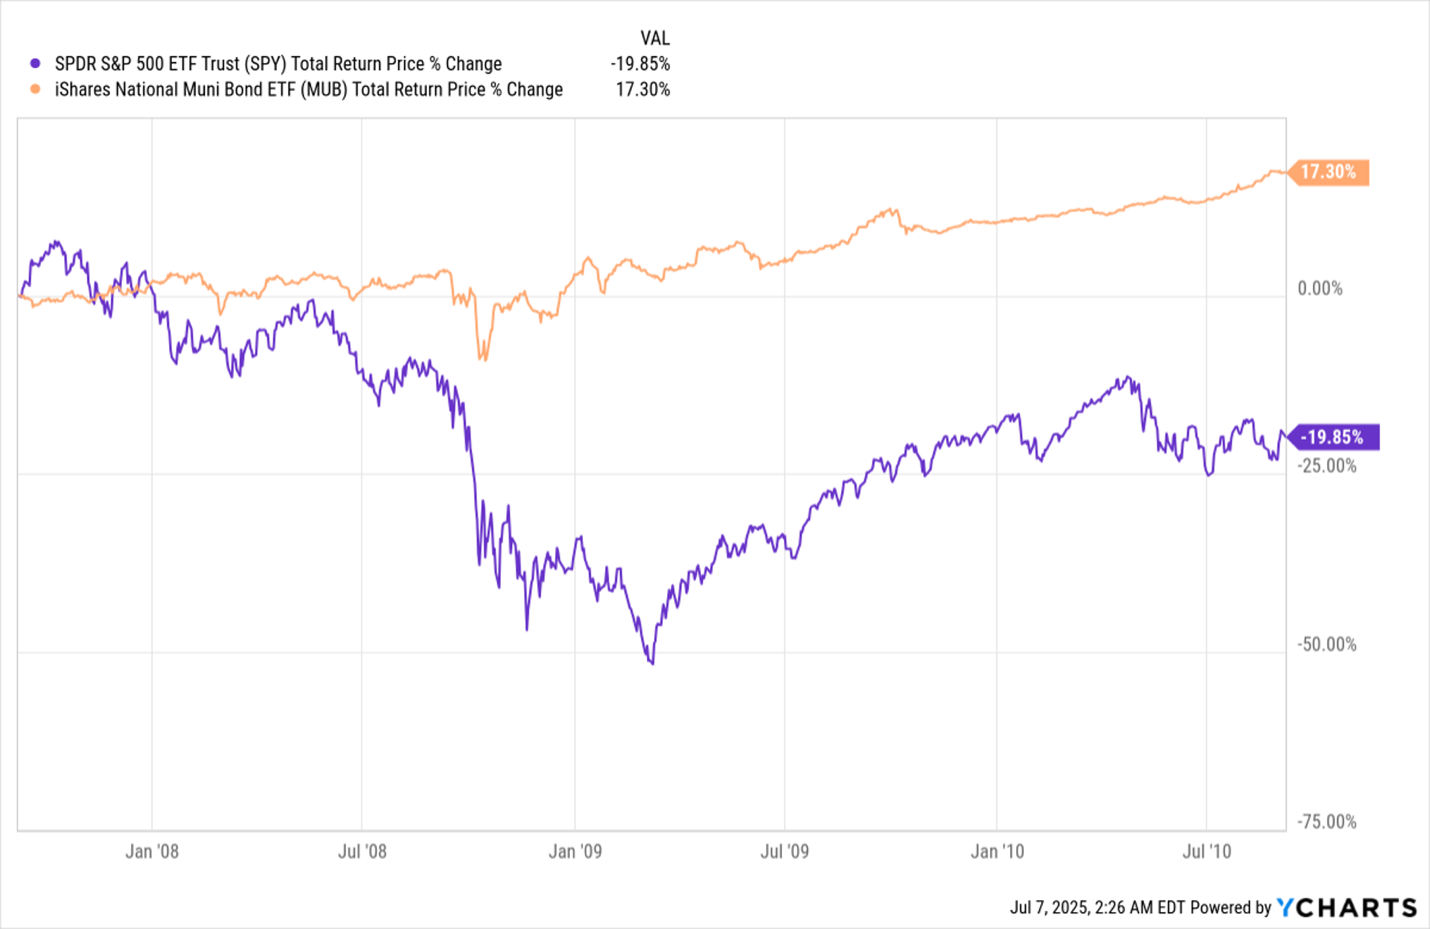
From 2007 to 2009, for example, muni bonds made little progress until the 2008 market selloff sent them to surging (see the orange line above). That gave muni investors an 8.3% annualized return in two years while stocks were crashing.
A (Near) Repeat of History
Fast-forward to the first half of 2025, and it looked like stocks were about to repeat what had happened nearly 20 years ago. But then they recovered, for the simple reason that, despite all the drama, the US economy is doing fine.
The economy’s continued strong growth is something we’ve been stressing at CEF Insider this year, despite the panic. And this is why we’ve held off on muni-bond CEFs instead of leaning into them.
Not everyone has done the same, however.
Top California-Based Muni-Bond CEF Gets Bid to the Moon
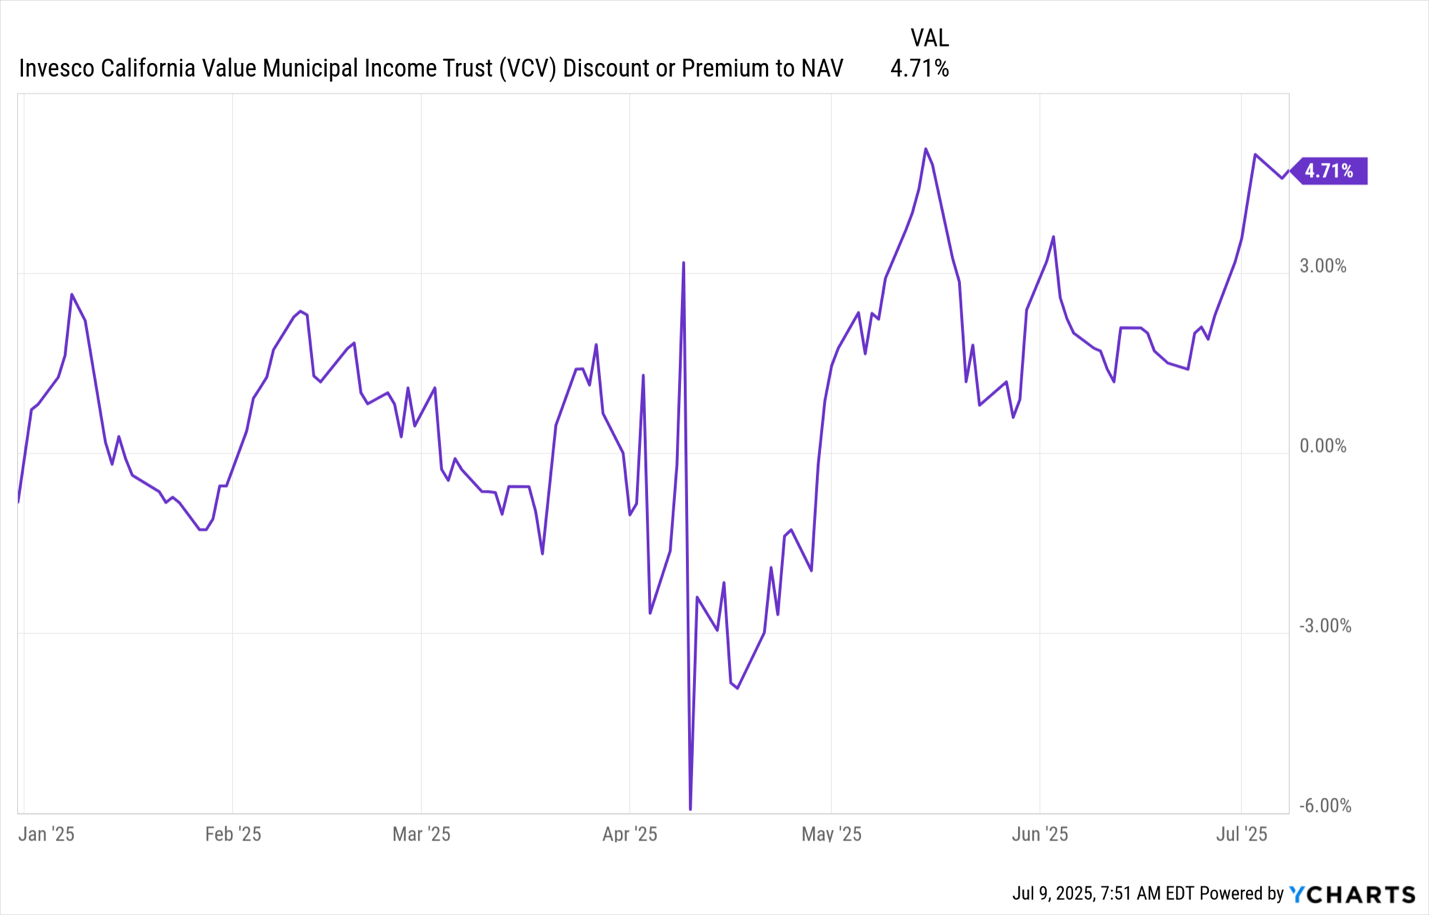
Here we see that the Invesco California Value Municipal Income Trust (VCV) has ranged from a deep discount to net asset value (NAV, or the value of its underlying portfolio) to a nearly 5% premium in 2025. In other words, investors are currently paying almost 5% more than VCV’s portfolio is actually worth!
Trouble is, that stark premium does not reflect growth in the fund’s NAV. Therein lies the problem (and the risk).
VCV’s Portfolio, Market-Price Returns Part Company
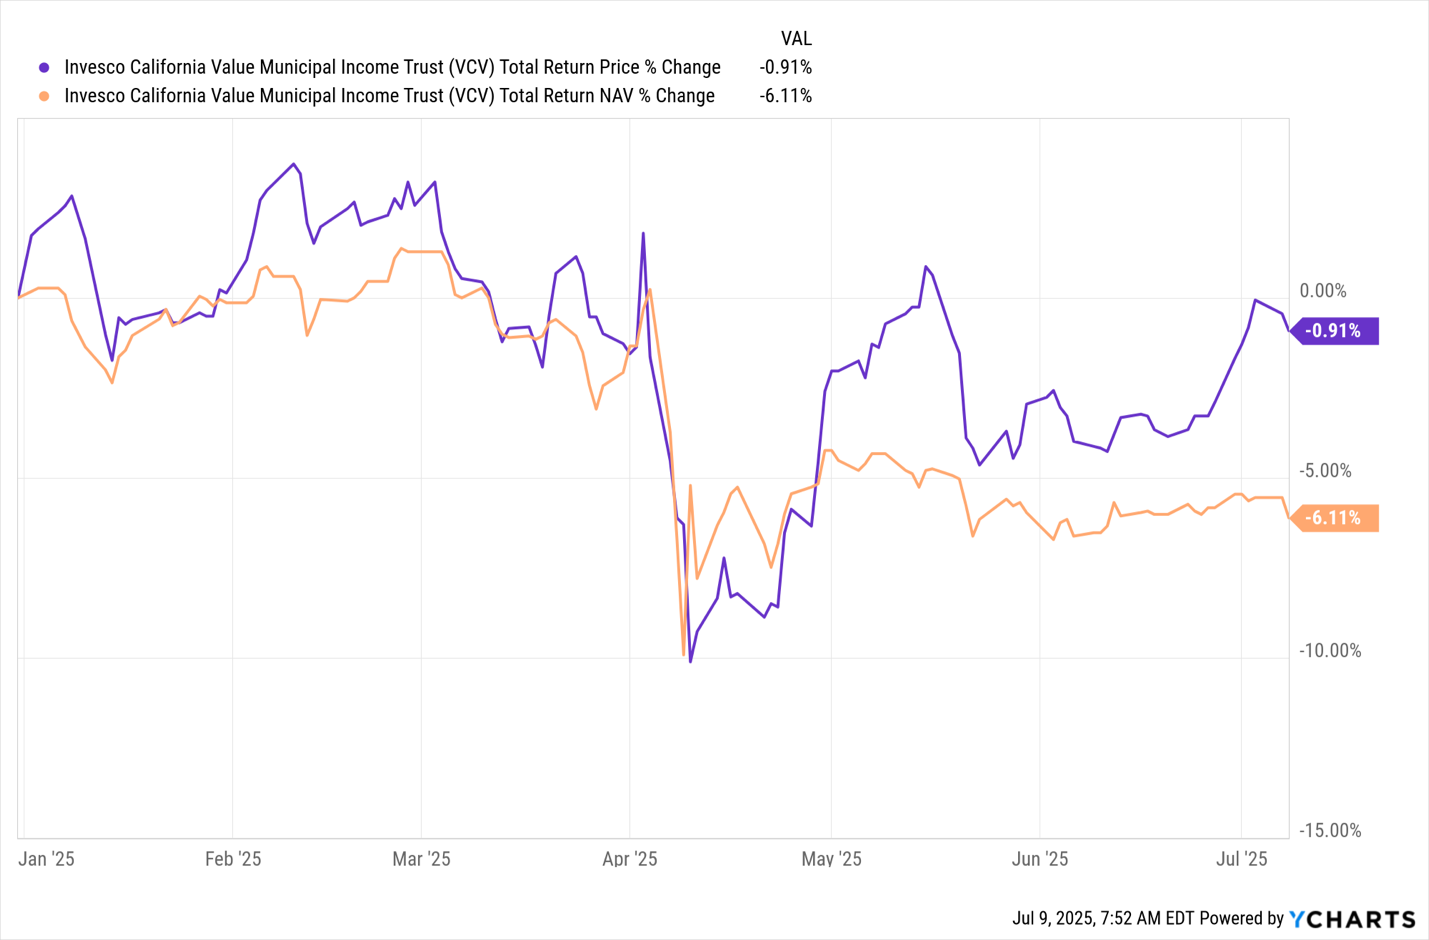
On a total-NAV-return basis, VCV is down more than 6% in 2025, as you can see in orange above. More worrying is the fact that VCV’s total price return is nearly flat, after a rise that’s happened in the last few weeks.
In other words, the fund’s premium has been pushed up by investors not selling it in response to that NAV drop. That lack of a response is why I urge anyone holding VCV to sell now.
To be fair, this is a well-managed fund, and California has booked higher tax revenue in the last decade as industries (tech and media most obviously) have posted profit gains.
Plus, the fund’s 7.4% yield is higher than the average 6.4% yield across muni-bond CEFs tracked by CEF Insider. But that means VCV is a good buy when it’s underpriced, not now, when it’s overpriced.
And we definitely will want to buy underpriced muni-bond CEFs when we can, because this underperformance has lasted too long: Munis have been out of favor for about three years now, way longer than prior lulls.
Plus, stocks have recovered, despite the selloff earlier this year, and another selloff could cause selling in other markets, too. That would make muni bonds a good option for hedging risk elsewhere. VCV would be high on our list, but only when it swings to a discount.
But what if VCV doesn’t swing to a discount or keeps losing value, like it has been? In that case, we might consider a CEF like the abrdn National Municipal Income Fund (VFL), a 6.2% yielder trading at a 10.3% discount to NAV.
This discount is strange, since VFL holds bonds from several states, so it’s well diversified. Plus, munis are one of the world’s safest asset classes.
In other words, this deal can only stick around for so long.
For that reason, if you’re looking to get into (or add to your holdings of) muni bonds, take a look at VFL—or one of the other high-yielding muni-bond CEFs out there that aren’t trading for more than their portfolios are worth.
Contrarians Are Shifting, But NOT Into Munis—Yet (Here’s Where They’re Going Instead)
Muni-bond CEFs are hands-down one of the best ways to diversify your portfolio. They give you income. Stability. High yields. And a tax break that can be a game-changer.
But, of course, they’re only one option for diversifying. And as I said above, now is a good time to buy them. But it’s not yet the best time.


QuotedData


Thursday 24 July
Aberdeen Asian Income Fund Ltd ex-dividend date
Bankers Investment Trust PLC ex-dividend date
BlackRock Income & Growth Investment Trust PLC ex-dividend date
City of London Investment Trust PLC ex-dividend date
Foresight Solar Fund Ltd ex-dividend date
Henderson Far East Income Ltd ex-dividend date
International Biotechnology Trust PLC ex-dividend date
Invesco Global Equity Income Trust PLC ex-dividend date
JPMorgan Claverhouse Investment Trust PLC ex-dividend date
Supermarket Income REIT PLC ex-dividend date
Apax Global Alpha Limited (“AGA”)
by
Janus Bidco Limited (“Bidco”)
a newly-formed Guernsey limited company indirectly owned by an investment vehicle to be advised by Apax Partners LLP (“Apax”)
to be effected by means of a Court-sanctioned scheme of arrangement under Part VIII of the Companies (Guernsey) Law, 2008, as amended
Summary
· The boards of Bidco and AGA are pleased to announce that they have agreed the terms of a recommended cash acquisition of the entire issued and to be issued ordinary share capital of AGA by Bidco (the “Acquisition“).
· Bidco shall be equity funded by one or more funds, accounts or persons managed, advised or sub-advised by Ares Management LLC and/or its Affiliates (“Ares“).
· The Acquisition is intended to be effected by means of a Court-sanctioned scheme of arrangement under Part VIII of the Companies Law.
Cash Offer
· Under the terms of the Acquisition, which shall be subject to the Conditions and further terms set out in Appendix I to this Announcement and to the full terms and conditions that will be set out in the Scheme Document, each Scheme Shareholder shall be entitled to receive:
for each Scheme Share: €1.90 in cash (the “Cash Offer”)
· The Cash Offer represents:
o a premium of approximately 18.8 per cent. to the closing price per AGA Share of 138.6 pence on 18 July 2025 (being the last Business Day prior to the commencement of the Offer Period);
o a premium of approximately 30.6 per cent. to the volume weighted average price per AGA Share of 126.1 pence for the one-month period ended 18 July 2025 (being the last Business Day prior to the commencement of the Offer Period);
o a premium of approximately 36.5 per cent. to the volume weighted average price per AGA Share of 120.6 pence for the three-month period ended 18 July 2025 (being the last Business Day prior to the commencement of the Offer Period); and
o a discount of approximately 17.1 per cent. to AGA’s preliminary unaudited Q2 2025 net asset value (“NAV“) per AGA Share of €2.29,
in each case, where applicable, based on the Announcement Exchange Rate.
· The Cash Offer represents a price of £1.65 per Scheme Share, based on the Announcement Exchange Rate, and values the entire issued and to be issued ordinary share capital of AGA at approximately EUR 916.5 million (approximately £794.5 million) on a fully diluted basis.

APAX will leave the Watch List after the next update.
I’ve bought for the Snowball 254 shares in QYLP > Global X Nasdaq 100 Covered Call UCITS ETF for 3k

One way of learning more about a share is to have a financial interest in it.
Let’s monitor the progress and either add to or not as the dividends roll in.
If the market crashes it will have to be sold. High risk as the chart below shows.


© 2026 Passive Income Live
Theme by Anders Noren — Up ↑
 Progressive dividend from investment in environmental infrastructure assets.