I’ve bought for the SNOWBALL 20711 shares in SDCL Efficiency Income for 10k, mainly for the dividend and as a possible future pair trade for the SNOWBALL
Investment Trust Dividends
I’ve bought for the SNOWBALL 20711 shares in SDCL Efficiency Income for 10k, mainly for the dividend and as a possible future pair trade for the SNOWBALL
We consider the outlook for energy, diversifers such as gold, inflation and valuations.
9th March 2026
by Dave Baxter from interactive investor
Escalating conflict in the Middle East comes with a huge humanitarian cost but it also, unavoidably, raises big questions for markets.
And while we might feel reluctant to trade too much in response to such an event, it’s at least worth understanding how it can affect your portfolio, now and in future.
US and Israeli forces first launched air strikes in Iran on 28 February and we’ve seen some massive gyrations in markets since then. The potential knock-on effects for portfolios deserve consideration.

The most eye-catching move so far has been for the oil price, which has soared amid concerns of disruption to supply. The price of Brent Crude oil surged as high as $119 a barrel in early trading today, marking its highest level since 2022. Ahead of the air strikes, it was trading at just below $70 a barrel.
This has a few effects. It is, of course, good for conventional energy funds. Performance data from 28 February to 6 March 2026 shows the
iShares Oil & Gas Explr&Prod ETF USD Acc GBP SPOG
having returned around 5%, with
Guinness Global Energy Y GBP Acc on 3.7%.
It also offers a sliver of hope for beaten-up renewable energy funds, such as ii investor favourite Greencoat UK Wind UKW
A higher energy price, and a fresh focus on investing in renewables to secure energy independence for the likes of UK, could drive better sentiment (and returns) for the sector.
But if it lasts, a higher oil price becomes a problem if it feeds into higher inflation.
I should note that some specialists have so far dismissed this as a major worry. But if things worsen we could find that further interest rates cuts are off the table for now – something that hurts the prospects for bonds, but also potentially for equity funds with a growth investment style.
Managers on funds such as Scottish Mortgage Ord SMT
will hope the companies in their portfolio have truly adapted to a world of higher rates as they claim they did in 2022.
If inflation and rates stay higher, bond yields also stay higher. This has a knock-on effect for “alternative” assets whose value is pretty closely correlated to government bonds.
A higher energy price could bolster renewables but higher gilt yields are still unhelpful for infrastructure fund
from Renewables Infrastructure Grp TRIG
to HICL Infrastructure PLC Ord HICL
as they are for property investment trusts.
But as with growth companies, we may find that such portfolios are more robust in the wake of 2022: property investment trusts, for one, have undergone significant consolidation in recent years.
I note that fresh inflation talk does not bode well for the likes of government bonds, which explains why they have tended to sell off.
The average fund in the Investment Association’s (IA) UK Gilts sector has lost around 2% over a week or so, while the yield on the 10-year UK government bond has risen from around 4.3% to almost 4.8%. Yields move inversely to prices.
Those who piled into gold and silver in the last few months have also had a rough week. Prices for both tumbled between 28 February and 6 March, while funds such as BlackRock World Mining Trust Ord BRWM
and Jupiter Gold & Silver I GBP Acc (BYVJRH9) suffered double-digit losses.
The sight of bonds and gold selling off alongside stock markets is not exactly welcome, but at least there are explanations.
The US dollar has strengthened, something that doesn’t bode well for gold, while any prospect of higher interest rates would make the opportunity cost of holding the metal greater.
But it’s worth remembering that the drop also likely relates to the fact that some investors need liquidity (or have to meet margin calls after other assets fell in value) – prompting them to take profits on it as a recent winner. Geopolitical uncertainty should also keep driving demand for safe-haven assets like this.
On a similar note, this is a good time to look at how traditional defensive funds, from Ruffer Investment Company RICA
have fared, and how they are positioned.
Last year was a bit of an everything rally, with equities and gold enjoying huge gains. But those gains do leave plenty of room for a fall, meaning some of your favourite markets, funds and shares have seen a big pullback.
We already have a few examples. South Korea’s Kospi index, which delivered phenomenal gains in 2025 and has a notable presence in all manner of global funds (from AVI Global Trust Ord AGT
to Artemis Global Income I Inc), plummeted over the course of a week, although the narrative of corporate reform driving returns there is presumably unchanged.
Shares in Europe, the emerging markets and Japan had a bad week or so, as did the FTSE 100, while some popular funds like Seraphim Space Investment Trust Ord SSIT
suffered surprisingly heavily since the onset of the conflict. Meanwhile, banking shares, a big driver of returns for many funds last year, were showing weakness this morning amid concerns of a knock for economic growth.
We recently noted that investors should avoid knee-jerk reactions when things seem uncertain. That can certainly apply here –although market shifts might also present a small buying opportunity on some of your favourite funds.
I would like to re-position the SNOWBALL for long term growth and dividend growth. There is 40k of cash, which will have to invested otherwise the SNOWBALL will suffer a loss of income of around 3k.
IF the oil price stays high I would like to buy the following shares
MRCH
CTY
SEIT
LWDB
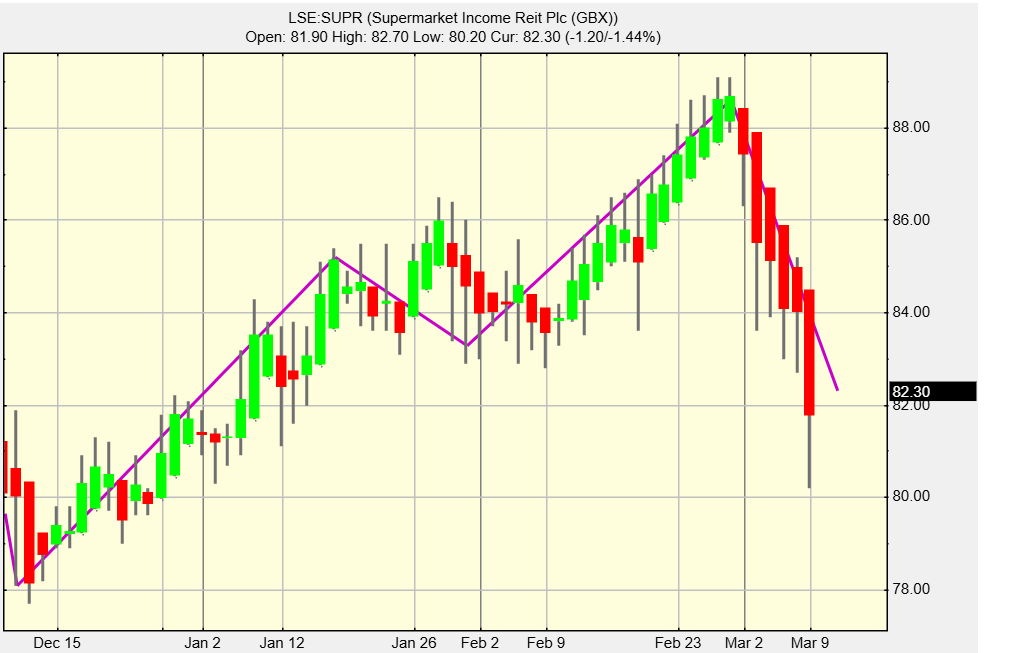
SUPR
IF the oil price stays high the yields on the above may improve and the SNOWBALL could invest at a blended yield of 7%.
The first xd dates, apart from LWDB which is un-important, are a few weeks away, so there is time for the market to fall and the new financial year is also still just under a month away.
I will start to re-invest by buying SEIT and finalise the position in TRIG, which will leave around 26k to re-invest.
Thursday 12 March
abrdn Diversified Income & Growth PLC ex-dividend date
BlackRock Throgmorton Trust PLC ex-dividend date
Gabelli Merchant Partners PLC ex-dividend date
Henderson Smaller Cos Investment Trust PLC ex-dividend date
Real Estate Credit Investments Ltd ex-dividend date
Safestore Holdings PLC ex-dividend date
Schroder Real Estate Investment Trust Ltd ex-dividend date
Tritax Big Box REIT PLC ex-dividend date
VPC Specialty Lending Investments PLC ex-dividend date

I’ve sold the SNOWBALL shares in TFIF for a loss £238.00.
As the new trading year starts next month I can afford to miss out on some income as I re-balance the SNOWBALL into hard assets, rather than loans, especially as April is a thin month for income from dividends.
The situation could change very quickly and then the SNOWBALL would have to be re-assessed.

£40,902 of cash for re-investment of which 4k is for re-investing in TRIG.

I’ve sold the SNOWBALL shares in DIG, for a loss of £347.00.
It was always a high risk trade buying late in a prolonged bull run, the intention is to improve my stable of shares (Cheltenham this week) by buying a dividend hero share as a replacement.

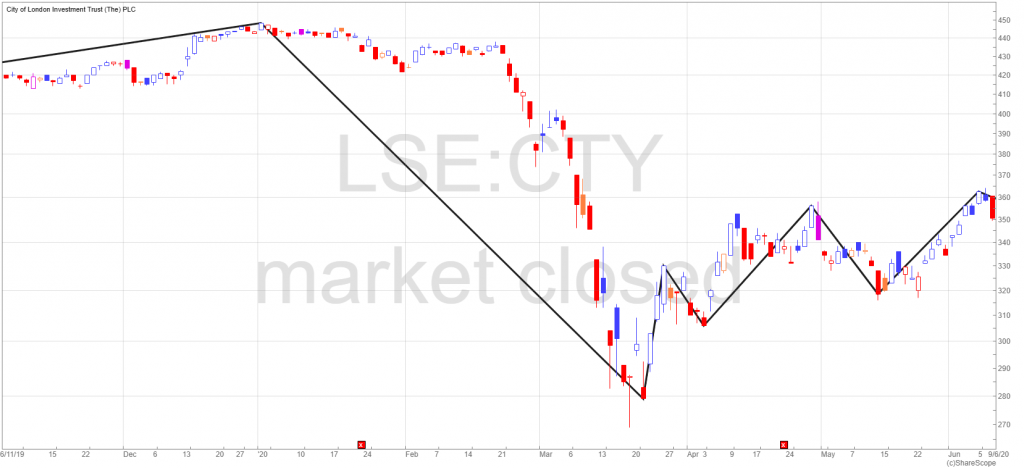
How CTY traded during the Covid market crash.
The worry was that companies would not be able to continue to pay their dividends at the same rate. You must remember that CTY has reserves for that scenario.
The yearly dividend before the crash was 19.0p and the yield 4.3%
The dividend after the crash 19.05p and the yield was 6.75%
The current dividend is 21.3p
To receive a yield of 5% the price would have to fall to around 400p.
The current price is 507p.

The SNOWBALL was going to buy some RECI as they go xd this week, the dividend would have been paid in this tax year and the SNOWBALL already has enough income for the current year and as markets are falling I will continue to watch.
The sale of DIG at a loss will proceed and this will give the SNOWBALL around 30k to re-invest at higher yields than is available in the market today, hopefully.
Maybe a purchase of a dividend hero, subject to Mr. Market being nice.
Brett Owens, Chief Investment Strategist
Updated: February 4, 2026
“Wheel of Fortune”, Sally Ride, heavy metal suicide
Foreign debts, homeless vets, AIDS, crack, Bernie Goetz
Hypodermics on the shore, China’s under martial law
Rock and roller, cola wars, I can’t take it anymore

Billy Joel had had it with, well, everything geopolitical when he belted these lyrics to his latest number one hit in 1989. We Didn’t Start the Fire reached number one on the Billboard Hot 100 chart for two consecutive weeks, teaching listeners:
It was always burning since the world’s been turning.
And while Fall Out Boy gave us a worthy sequel “cover” of Joel’s hit in 2023 (encompassing Harry Potter to Brexit), the headlines have already lapped them. We are in 2026 now, and the fire is burning hotter than ever.
The “Piano Man” himself couldn’t predict the chaos of 2026. But if Billy were still banging on the keys today, the new verse might go something like this:
Venezuela, Davos snow, Iran missiles here we go
Greenland borders, tariff fights, Powell keeping money tight
Credit caps, banking scare, AI bubbles everywhere
Fed is stalling, tensions high, watch the VIX begin to fly!
Joel’s point was that the madness never stops. From Cold War to Trade War. Foreign debts to… even bigger foreign debts.
Most vanilla investors back away from the flame. They panic when the headlines get too hot. They freeze when the Fed fights with the justice department. They melt (sell) when the President threatens tariffs on Europe.
The glaring problem with this knee-jerk approach is that the fire never stops burning. These “first level” investors sell low—when headlines are scariest!
We contrarians take a different approach. We know that the “fire”—market volatility—is actually an asset class. We can tap the madness to create an income stream for ourselves. Here’s how.
When the world gets crazy, fear spikes. When fear spikes, so do option premiums. Which is when we swing into actions and sell options for their sweet premium income.
Sure, we can do this by selling (“writing”) covered call options on individual stocks and ETFs. But that can turn into a fulltime job, and our goal is to retire! So, we prefer the “Easy” button which means we buy covered call funds for yields up to 12.1%. Paid monthly to boot!
Let’s talk about two of my favorite monthly-paying covered call funds today.
First up, we have an assist from a silent partner in Washington working on our side. The administration wants lower long-term yields to boost the economy and unlock the housing market.
One year in, they have been successful. Treasury Secretary Scott Bessent continues to limit the issuance of long bonds, which boosts their price (and keeps yields low). Bessent has unlimited tools at his disposal to keep a lid on yields.
Don’t fight the Treasury!
Bond yields jump every time there is a new headline about Greenland or European tariffs. We’ll gladly fade the hysteria. Our “tariff hedge” is the iShares 20+ Year Treasury Bond BuyWrite Strategy ETF (TLTW).
TLTW holds long bonds and sells options against them for additional income. It turns geopolitical headlines into a 9.9% dividend stream, paid monthly.
Bond Yields Plus Covered Call Income
Think of this as selling “panic insurance” to the herd. When traders freak out about tariffs or a government shutdown, they rush to buy options to protect their portfolios. That spikes the price of premiums. TLTW is on the other side of that trade, selling those expensive options to the nervous masses. The scarier the headlines get, the more income this strategy generates. We are effectively shorting the frenzy.
Sudden geopolitical shocks—like a government extraction in Venezuela or a tariff tweet at 3AM—cause market-wide jitters. The S&P 500 swings wildly. The weak hands get motion sickness.
We take the motion and turn it into a 12.1% income stream with the NEOS S&P 500 High Income ETF (SPYI). This fund holds a basket of S&P 500 stocks to replicate the index, but it adds a “kicker”: it sells (writes) call options on the index to generate meaningful monthly income.
The result is that terrific 12.1% yield. And unlike many other covered call funds, SPYI uses Section 1256 contracts, which means that 60% of the gains are taxed at the favorable long-term capital gains rate.
Fire Burns, Divvies Get Dished
And there is another hidden structural advantage here, too. Most covered call funds cap your upside completely—if the market rips higher, you get left behind. SPYI is smarter. It often uses a “call spread” strategy rather than just simply selling calls blindly for income. This leaves a “skylight” open for the fund to capture some capital appreciation during a relief rally. You get the 12% income floor without crashing into a low ceiling.
Hey, we didn’t start the fire. But as long as it’s burning, we might as well get paid for it.
Brett Owens, Chief Investment Strategist
Updated: March 4, 2026
Last month, we hit the contrarian karaoke bar together. No judgment. It was a good time!
If you’ve got a (ahem, no judgment) fuzzy memory, well, here’s how it went down. We sang some Billy Joel—good start, I know.
A little We Didn’t Start the Fire. We honored his point that the chaos never stops. That was the case in 1989 when the banger topped the Billboard charts. It remains true today.
Ha, we even belted a 2026 verse over our (virtual) beers!
Wow. About that “Iran missiles here we go” line. Even I didn’t expect the sequel to arrive this fast.
But here we have it. I woke up on Saturday, checked my phone (my unhealthy yet common ritual), and see we’ve got US and Israeli forces decapitating Iranian leadership—Khamenei is dead. Iran flailed back at neighbors in the region. Oil is rallying because the Strait of Hormuz is shut down.
The fire is burnin’. The new verse for our next rockin’ night out together practically writes itself:
Tehran burning, bombs at dawn, Hormuz shipping tankers gone
Oil spiking, gold on fire, Treasuries the world’s desire
Vanilla panics, herd is out, we contrarians grab payouts
Billy said it, now it’s real—we don’t flinch, buy dividend deals!
The Piano Man’s lesson hasn’t changed. It was always burning somewhere since the world’s been turning. The fire never stops. Not our fault! Our job is to get paid while it’s burning.
In February, we discussed the iShares 20+ Year Treasury Bond BuyWrite ETF (TLTW). This fund owns long-term government bonds and sells covered calls against them for additional income, a savvy strategy which elevates a pedestrian 4% paying bond fund into an elite 8.9% dividend payer. It also takes advantage of geopolitical panic and morphs that into a monthly dividend machine.
We are selling panic insurance to the broader herd.
Since then, TLTW has continued paying investors. Readers who followed my Contrarian Outlook recommendation now sit pretty. Subscribers to my Dividend Swing Trader service, who got in even earlier, can now boast 11% on the position including dividends in eight months, an annualized 17%. Not bad for a “boring” bond fund!
Here’s why TLTW loves a crisis. When bombs fall and the world panics, money floods into US Treasuries. Bond prices jump and yields drop. Meanwhile, this fear spike also boosts option premiums, and TLTW is on the other side of that trade. As a seller of these expensive options to nervous traders, the income that TLTW generates actually goes up during times of crisis. Good for TLTW investors.
My only issue with TLTW today is that now the world’s talking about Treasuries. As contrarians, we want to buy ahead of the herd, not with it. So, I rate TLTW a Hold over in our DST portfolio. Of course, we’re happy to collect the dividend checks. We’re just not going to chase TLTW here.
If you missed TLTW, consider the Global X S&P 500 Covered Call ETF (XYLD). It’s a perfect complement to TLTW. The fund does the same thing, but in stocks instead of bonds. XYLD holds a basket of S&P 500 stocks and sells covered call options against the index every month. This generates additional income and provides a much higher yield than from buying the S&P 500 index alone.
And here’s where it gets good with the Iranian situation. When market turbulence spikes—which is exactly what’s happening right now—call options get more expensive. And XYLD, as a seller of these call options, collects more. The result is a 10%+ yield, paid monthly, that is well supported. This is real cash that hits our brokerage accounts twelve times a year, regardless of whether the market trends up, down, or sideways.
XYLD is our bomb shelter dividend. We’re getting 500 of America’s biggest companies and collecting a fat monthly income stream no matter how scary the world gets. In fact, the scarier the world gets, the more premium income the fund generates. Crisis alpha, baby!
The underappreciated secret? These S&P 500 firms are best positioned to benefit from AI in the near term. They’re implementing it across their operations right now—cutting costs, boosting margins, trimming headcount (hot off the presses: Jack Dorsey’s Block, formerly known as Square, announced cuts of 4,000—nearly half its workforce—due to AI!). When these efficiency gains show up in quarterly earnings, the recent hysterical selling will fade and XYLD will benefit even more.
Here’s what I want you to understand: TLTW and XYLD aren’t one-off picks. They’re part of a proven system that works for you.
My Contrarian Income Report portfolio holds 25 positions across bonds, energy toll collectors, covered call funds, BDCs, munis, and utilities—yielding 8.3% on average. When the world catches fire (and it always does, somewhere), this portfolio doesn’t flinch. It keeps paying, month after month!
The fire never stops. Billy Joel told us that in 1989. I reminded you last month. Tehran is reminding you right now.
So, let me ask you: when the next crisis hits (and it will), do you want to be panicking with the herd? Or collecting your monthly dividends with us?
© 2026 Passive Income Live
Theme by Anders Noren — Up ↑