Declares 2.25p first interim dividend, vs 2.20p YoY
Update on Formal Sale Process
The Strategic Review and Formal Sale Process announced by the Company on 5 November 2025 continues in line with the Board’s expectations. The Company will provide a further update when it issues its interim results in early March 2026 unless there are any material developments in the meantime.
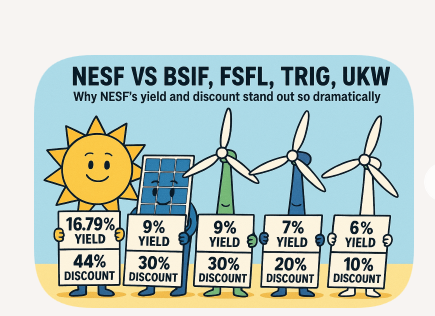
The current discount to NAV is 40%, so when there is corporate action in the sector, hopefully the Snowball will harvest some of the discount, although transactions at NAV are very unlikely in the current climate.
Bluefield Solar (LON: BSIF), the London listed UK income fund focused primarily on acquiring and managing solar energy assets, is pleased to announce the Company’s first interim dividend for the financial year ending 30 June 2026 (the ‘First Interim Dividend’).
The First Interim Dividend of 2.25 pence per Ordinary Share (January 2025: 2.20 pence per Ordinary Share) will be payable to Shareholders on the register as at 6 February 2026, with an associated ex-dividend date of 5 February 2026 and a payment date on or around 6 March 2026.
You’re reading a free article with opinions that may differ from The Motley Fool’s Premium Investing Services.
Some investors may view mining giant Rio Tinto (LSE: RIO) more as a dividend play than a growth share. That’s forgivable, given poor recent performance. The shares are up less than 10% over five years. Now they’ve sprung into life.
Over the past 12 months, the Rio Tinto share price has climbed around 26%, most of which came in the last three months. Is this the opening salvo of an explosive recovery
First, it’s worth revisiting why Rio Tinto has struggled. The biggest issue is its heavy reliance on iron ore, which typically generates well over half of group profits. Prices have fallen sharply from post-pandemic highs as China’s property sector slumps, hitting demand, revenues, and earnings.
Rio Tinto recovery potential
China still faces serious challenges, but the outlook is a little brighter. Goldman Sachs recently upgraded the country’s GDP growth forecast to 4.8% for 2026, citing stronger-than-expected exports and greater focus on advanced manufacturing.
Rio has also had to contend with post-pandemic supply chain disruption and high inflation, which has pushed up labour, energy, and input costs, while squeezing margins. Operational issues have added to the pressure. In Australia, cyclones and flooding hit iron ore output, while the board cut production at the Yarwun Alumina Refinery to extend its life.
In October, Rio said it remains on track to meet its 2025 production targets. Bauxite and copper production rose 9%, but iron ore output was flat. That mixed picture helps explain why confidence has been slow to return.
FTSE 100 dividend play
The balance sheet deserves close attention. Net debt stood at roughly $14.6bn at the end of June 2025, up sharply from around $5.5bn at the end of 2024. That reflects major investment activity, including the Arcadium lithium acquisition and increased project financing. Even so, Rio remains financially robust, with around $9bn of cash and strong overall liquidity.
The board cheered investors in December, by announcing plans to release up to $10bn of capital through cost cuts and asset sales. Investors liked that but those who worried they may have missed the recovery shouldn’t be too alarmed. The valuation still looks reasonable, with the price-to-earnings ratio at around 12, albeit up from eight or nine for much of last year.
As the share price has risen, the trailing dividend yield has eased, but it’s still a healthy 5.1%. However, Rio’s recent dividend track record is scrappy. In 2021, it paid a bumper total dividend of 793 US cents per share. It followed that with cuts of 38%, 11.5%, and 7.6% over the subsequent three years, shrinking the 2024 payout down to just 402 cents.
Those buying today are betting that the recent rally marks the start of a more durable recovery. The P/E suggests some value remains, but a lot still depends on the global economy and China in particular.
I think Rio Tinto is worth considering for income-seekers who fancy some recovery potential on top. Especially for those who lack natural resources exposure. This is a cyclical sector, so the best time to invest is when sentiment is low. Despite the recent recovery, we’re still near that point today. Investors should take a long-term view, as ever.
You’re reading a free article with opinions that may differ from The Motley Fool’s Premium Investing Services. Become a Motley Fool member today to get instant access to our top analyst recommendations, in-depth research, investing resources, and more.
The FTSE 100‘s roared past 10,000 for the first time this year, amd gained almost 22% in 2025. In fact, it was its best year since 2009. The rapid growth may leave some UK investors wondering if they’ve missed the boat. Spoiler: they haven’t.
Last year’s rally was powered by three standout sectors: mining, aerospace and finance. Together, they drove over 70% of the index’s gains – and they don’t appear to be slowing any time soon.
Let’s take a look at the mechanisms behind the rally, and why they signal opportunity for investors aiming to bolster their portfolio in 2026.
Soaring sectors
Precious metals have surged 190% on China demand in 2025, inflation hedges and renewable energy’s insatiable appetite for copper and lithium. Almost all mining stocks delivered stellar returns and this year could see the world’s biggest miner emerge with unstoppable copper dominance (more of that later).
Aerospace and defence giants Rolls-Royce, Babcock and BAE all surged on soaring NATO spending amid Ukraine and Middle East tensions. Order books stretch years ahead – predictable, sticky earnings perfect for retirement stability. Investing in defence comes with ethical concerns, depending on the individual, but the sector’s performance can’t be overlooked.
And finally, finance. Thanks to elevated net interest margins and no Autumn Budget windfall tax, banks had a great year. Lloyds, Barclays, HSBC and Standard Chartered all benefitted, gaining between 50% and 80%. Plus, with yields between 4%-6% and rising, they’re a dividend dream. But here’s the catch: if the Bank of England cuts rates further, those margins will come under pressure. They look good for now, but it’s worth keeping an eye on.
Mining: the sector to watch in 2026?
Glencore and Rio Tinto (LSE: RIO) – two mining titans – have just restarted merger talks that could create the world’s biggest mining group. Rio’s reportedly preparing an all-share bid worth around £260bn, and Glencore shares jumped 10% on the news alone.
Both stocks have been stellar performers, with Glencore achieving strong trading profits with copper exposure and Rio leading on iron ore. A merged entity would dominate copper supply, a critical component in electric vehicles and renewable energy implementations. Plus, each company yields between 3% and 5%, making them attractive for both growth and income.
But the deal still faces regulatory hurdles such as antitrust concerns. If it clears, the combined company’s scale and cost savings could drive earnings upgrades for years. If it fails, both stocks could nosedive sharply. Either way, it’s a story worth monitoring in 2026.
The bigger picture
Not long ago, the ‘boring’ FTSE 100 was full of companies eyeing a US listing. Now, it’s quietly printing money through exposure to commodities, defence budgets and financial repricing.
As we head into 2026, it’s becoming an increasingly exciting growth story — with Glencore and Rio Tinto leading the charge.
Valuation-wise, Rio looks like the more compelling option, with a forward price-to-earnings (P/E) ratio of only 12.5. It also boasts a higher yield than Glencore, has twice the market-cap and almost half the debt.
While the upcoming merger threatens volatility, the potential for growth outweighs the risk, in my opinion. For me, that makes Rio a top stock to consider this month — and one I’ll be watching with an eagle eye.
You’re reading a free article with opinions that may differ from The Motley Fool’s Premium Investing Services.
One of the best-performing stocks in the FTSE 100 over the past month is Glencore (LSE:GLEN). The Glencore share price is up an impressive 23% over this period, and 27% over the past year. From my research, there are several reasons behind this move, which could dictate the direction of travel for the coming months.
Reasons for the move
Recent reports suggest Rio Tinto is exploring a potential acquisition or merger with Glencore that could create one of the largest mining giants globally. Earlier this month, Rio Tinto put out a statement saying that “Rio Tinto and Glencore have been engaging in preliminary discussions about a possible combination of some or all of their businesses”.
Of course, it’s early days, with a deal this size taking months to get things moving. But it’s clear there’s intent on both sides to make something happen, which has naturally driven a spike in interest in the Glencore share price.
Another factor helping the business in recent weeks is the move in key commodity markets. Base metals have surged in January, particularly copper. Glencore has large exposure to copper and other metals, including gold and silver. The rise in raw material prices, it means the business can benefit from selling at higher prices. This should translate into higher profits.
The direction from here
I’m very much in the camp that certain metals, such as gold and silver, are in a long-term move higher. There are plenty of reasons that support a continued price increase. These include lower interest rates globally, continued geopolitical uncertainty and higher industrial demand (particularly relating to silver and copper).
As a result, I think commodity stocks like Glencore could do well as the business grows profits amid elevated commodity prices. This really works in its favour due to operational leverage. This refers to how revenue can increase faster than costs. For example, gold prices could jump 10% tomorrow, but the cost of production hasn’t changed. This is why companies like Glencore do very well during boom periods for raw materials.
The merger with Rio Tinto is definitely something that will dominate conversations in the coming months. If things proceed, there’s the risk that Glencore gets delisted, with the combined company trading under the Rio Tinto brand. Ultimately, this could make any investment in Glencore short-lived, which is something that needs to be noted. Another risk is that if the deal falls apart or gets messy, Glencore shares could slump as optimism quickly fades.
Therefore, although the strong performance over the past month is partly due to fundamentals, I’m cautious about buying now given the uncertainty around the Rio Tinto deal. I’d prefer to consider other commodity stocks that aren’t in merger talks for a cleaner investment opportunity.
You’re reading a free article with opinions that may differ from The Motley Fool’s Premium Investing Services.
British income stocks’ performance has been rather underwhelming over the last 10 years. Between 2016 and 2024, the FTSE UK Dividend+ index lagged the wider stock market, generating only a 48.6% total return compared to the 79.6% of the FTSE 350.
In other words, most British income stock investors have missed out on some substantial gains. However, that all changed in 2025, when the FTSE UK Dividend+ index charged ahead by a massive 33% versus the FTSE 350’s 24.2%.
So with dividend stocks now roaring back into life, are investors looking at a once-in-a-decade chance to lock in phenomenal long-term passive income?
Surging passive income
As a market-cap-weighted index, roughly 23% of last year’s gains came from its top-five constituents:
Since the mining and financial sectors vastly outperformed last year, it isn’t surprising the dividend index did as well when looking at this list. And as 2026 progresses, these stocks continue to drive the bulk of returns. But can the giants outperform again?
Looking at the macroeconomic environment, there’s room for optimism. Rising commodity prices are serving as a powerful tailwind for Rio Tinto.
Meanwhile, structural hedges and robust demand within the pension risk transfer markets bode well for the financial stocks on this list. And even British American Tobacco’s getting a little boost from the regulatory intervention against single-use vapes, driving up demand for its own non-combustible brands.
But with any stock, it’s critical to look at each underlying business. After all, even with favourable macroeconomics, structural operational issues can still lead to lacklustre results. So let’s take a closer look at the biggest company on this list.Zoom1M3M6MYTD1Y5Y10YALL
Is Rio Tinto a good investment in 2026?
One of the biggest headlines within the mining sector this year is the proposed merger of Rio Tinto and Glencore.
If successful, the deal would instantly provide Rio Tinto with new copper assets to capitalise on the electrification trends of global infrastructure while making it the largest diversified mining enterprise worldwide. And it would nicely complement its existing portfolio of iron, aluminium, and lithium projects.
Providing that commodity prices don’t suddenly drop off a cliff (which has happened in the past), this surge in production capacity could pave the way for substantially higher dividends moving forward.
Of course, that’s not guaranteed. Given the size of these businesses, regulators from multiple jurisdictions will undoubtedly demand concessions. And that could translate into forced asset sales, with some analysts already anticipating necessary divestments in China.
Even if that doesn’t happen, mergers of this size are enormously complicated and will most likely encounter unforeseen challenges. That could translate into a sharp rise in one-time expenses that might actually pressure dividends instead of supporting them.
Nevertheless, with an experienced management team at the helm, and the mining sector seemingly well-positioned for a cyclical rebound, Rio Tinto shares could be worth investigating further.
And with more tailwinds supporting the other UK income stocks in the FTSE Dividend+ index, 2026 could be another phenomenal year for dividend investors.
You’re reading a free article with opinions that may differ from The Motley Fool’s Premium Investing Services.
With fears of a looming economic slowdown or even a full-blown recession on the rise, predictions of a new stock market crash in 2026 have once again started to emerge.
It goes without saying that a crash isn’t a particularly pleasant experience, especially for those going through it for the first time. However, with the right strategy, investors can use the volatility to propel their portfolios to record highs and drastically expand their wealth. Here’s how.
Volatility creates opportunity
Let’s assume the worst and say the stock market suddenly falls 20% next week as investors start to panic about the geopolitical and economic climate, selling off their stocks. As a consequence, index fund investors see a large chunk of their portfolios get wiped out quickly while stock pickers likely endure even more volatility with some of their stronger growth positions falling more than 50%.
While not a market crash, that’s precisely what happened during the 2022 US market correction, with growth stocks like Amazon (NASDAQ:AMZN) falling by 55% over the space of a year.
Uncertainty about inflation, combined with a rapid rise in interest rates and a cost-of-living crisis, hit businesses across the board four years ago. And while the catalysts for a potential crash in 2026 are different (tariff inflation, supply chain disruptions, rising unemployment and steep valuations), it would nonetheless create a similar long-term opportunity.
Instead of recognising that Amazon’s long-term strategy and growth potential weren’t compromised by temporary macroeconomic uncertainty, most investors rushed for the exits and sold their Amazon shares.
Yet the intelligent long-term investors who recognised the bargain that the market volatility had created scrambled to buy Amazon shares while everyone else was selling. The result? Since December 2022, Amazon shares have almost tripled as the economies started recovering.
As Amazon demonstrates, while scary, capitalising on these rare and wonderful buying opportunities opens the door to fantastic market-beating returns. And more importantly, it accelerates the wealth-building process, allowing some investors to potentially retire much earlier.
Still worth considering in 2026?
As we enter 2026, Amazon shares are once again looking a bit frothy with a price-to-earning ratio of 35. That’s certainly not as high as it was back in late 2021, but it does open the door to elevated volatility if something goes wrong. And there are a few potential weak spots for investors to dig into.
A big concern is the group’s aggressive capital expenditure plans for upgrading and rolling out new data centres and AI infrastructure. For the time being, AI demand’s proving to be a handy tailwind for its hyperscaler services.
But if companies begin pulling back on AI initiatives due to a lack of tangible value creation, Amazon could end up with capacity underutilisation issues.
As for the e-commerce side of the business, a slowdown in consumer spending equally doesn’t bode well. And we’ve already seen some weakness start to creep in, with its July and October 2025 Prime Day sales failing to meet expectations.
Nevertheless, the latest results show encouraging momentum for its data centre arm, and its long-term e-commerce trajectory still looking strong, Amazon shares could definitely be worth a closer look. Especially if the stock market does indeed decide to throw a tantrum later this year.
During a prolonged downturn re-investing all dividends, would mean you would be buying bargains based on their yield but to make a meaningful trade, you would need one or two positions that fall less than the market to sell and then to buy your shares that you have already decided, you covet but the current yield is not suitable for your Snowball.