Why The 4% Rule Can Quietly Destroy Retirement Portfolios
The problem with retirement index investing via the 4% rule, in which you liquidate 4% of your net worth at retirement every year and adjust it annually for inflation, is that it means that you are forcing yourself to sell an inordinately high number of shares during down markets. Additionally, if your portfolio suffers a major market downturn early in retirement followed by a lost decade, even if the remaining years are very strong in terms of total returns leading to an average long-term total return of 10%, you may end up depleting your portfolio so much in the early going that it is unable to climb out of that hole, and your retirement dream becomes shattered.
If, instead, you are living off of dividend income, you do not have to sell your shares early on. As long as your dividends remain stable and growing in line with inflation over time, you will never have to sell a single share and can live off of your portfolio indefinitely, regardless of how market volatility behaves.
Brett Owens, Chief Investment Strategist Updated: December 30, 2025
Here’s one thing I can say for sure about 2026: This year, we’ll be grateful we’re NOT sitting on “America’s ticker”—my name for the SPDR S&P 500 ETF Trust (SPY).
I call SPY that because pretty well everyone owns it. But its 1% yield makes it more likely that holders will be forced to sell low in the next pullback, if they’re leaning on it to pay the bills.
Not us! We’ll be pocketing the 8%+ cash payouts from the portfolio of my Contrarian Income Report service. So while SPY holders face the next pullback with dread, we’ll be chugging along with our usual “dividends and chill” approach.
When a storm hits, we simply wait for our next big dividend payment to roll in. (And we don’t have to wait long—many of our divvies are paid monthly.)
Today I want to zero in on one attractive 13.4% (!) payer from our portfolio. Then I’ll show you a smart, simple way to forecast that massive dividend (and indeed any payout) with ease.
This 13.4% Payer Loves This “Bearish” Bull Market
We love FS Credit Opportunities (FSCO) for a lot of reasons, but its sky-high—and growing—dividend is right up there. FSCO yields a mammoth 13.4% today (more on that in a second).
Small businesses—the main drivers of US economic growth—love BDCs, too, because they loan money to these firms. BDCs are a godsend for these mom-and-pop shops, who often struggle to get the capital they need from stingy banks.
Most BDC managers sit in their cozy offices, wait for a private-equity sponsor to call, then write a check for a safe but low-paying loan.
Not FSCO. Portfolio manager Andrew Beckman buys distressed loans for dimes—even pennies—on the dollar. His chops in this arena drive the stock’s growing 13.4% payout.
Beckman is the industry’s “credit surgeon.” Forget the safe loan! He wants the patient who’s bleeding out on the table because he can stitch them up—and charge a fortune for doing so.
Before FSCO, he spent the core of his career at Goldman Sachs (GS), in their legendary Special Situations Group. These “credit commandos” thrived buying depressed assets in the 2008/2009 crisis.
FSCO is a BDC in a closed-end fund (CEF) wrapper. As a CEF, it can (and does!) trade at different levels in relation to its value. Today, it trades at a 14.7% discount to NAV because slower jobs numbers are sparking recession worries. That means we’re getting FSCO’s expertly run loan portfolio for just 85 cents on the dollar.
Yes, hiring is slow, but that’s because companies are implementing AI to boost efficiency. And small businesses are the No. 1 users of this tech.
Meantime, the Atlanta Fed’s GDPNow estimate shows that the US economy is still solidly in growth mode: a strong 3.5% rate, to be exact.
The disconnect between investors’ mood and strong growth is our opening to grab FSCO, and its 13.4% payout, at a bargain.
Buy FSCO, Then Do This to Forecast Your Dividends for Years
High, and rising, dividends like this one really are unicorns, and I see a diversified portfolio of them as a far better option than ETFs like SPY.
But the key to getting peace of mind (and dodging the urge to sell when markets fall out of bed) is knowing exactly when your next payout is coming. Truth is, there aren’t many tools out there that do this. And even fewer that do it well.
I know because I’ve tried a lot of dividend-projection tools and haven’t found any I loved (or even liked much). So our IT team created our own. It’s called Income Calendar, and it quickly and easily ensures your dividends are in your account before your bills come out.
The best way to show you how it works is to demo it for you. So let’s go to Income Calendar and plug in monthly paying FSCO, plus a couple other Contrarian Income Report holdings that pay quarterly, so we can see how IC navigates different payout frequencies.
Those would be gas-pipeline operator Antero Midstream (AM), which benefits from the Trump administration’s emphasis on fossil fuels over renewables—and Ares Capital (ARCC), another BDC set to write more loans as small biz boosts its productivity.
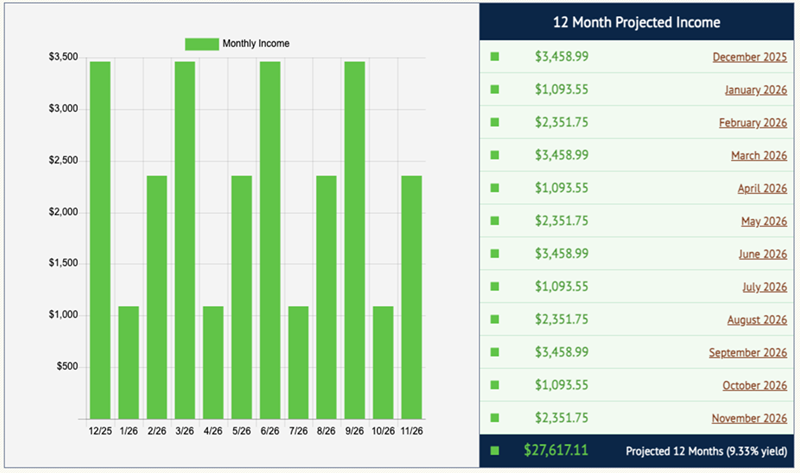
Let’s invest an imaginary $100,000 in each. Income Calendar tells us, immediately, what we can expect in terms of dividends every month from our 3-buy “mini-portfolio”:
As you can see, just these three buys deliver dividends ranging from $1,093.55 in a month up to $3,458.99, and a total of $27,617.11 on the year, on just $300K invested.
That’s a rich 9.3% yield. Sweet! (Bear in mind, too, that to be overly conservative, we don’t project dividend growth, so our “real” payouts could end up higher.)
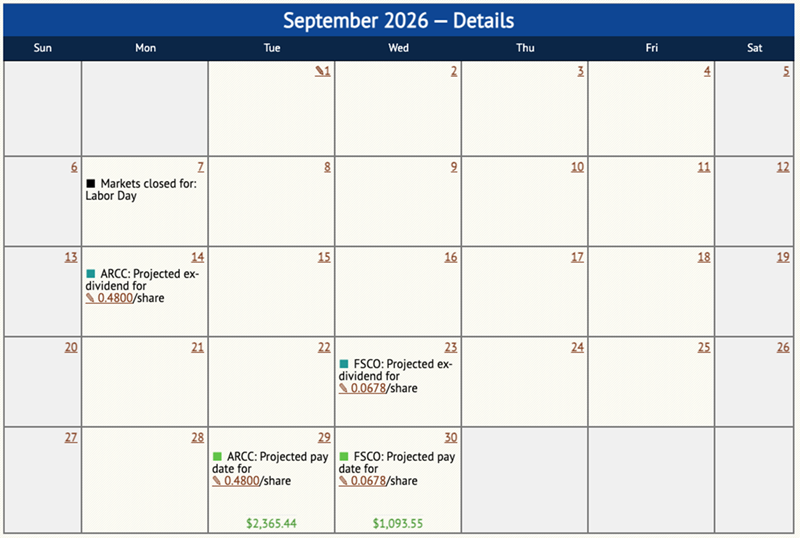
You can get breakdowns by stock, plus a month-by-month calendar showing key dates for every one of your holdings. Check it out. Here’s what our three-buy portfolio shows us for September 2026, one of our highest-paying months:
We can see our projected pay dates, as well as ex-dividend dates (the dates before which we need to be “in” the stock to get the next payout). We also get a heads-up on things like market holidays. We even know when our stocks report earnings—though there are none of these for our trio in September.
With a dividend re-investment plan you fail by the month or each quarter.
Relying on dividend income for life is possible for many, but it could require a large initial investment.
Risks to consider include the possibility of dividend cuts or suspensions and inflation eroding the buying power of your income.
Potential strategies to minimize these risks include diversification and investing in stocks and funds with solid track records of dividend increases.
As always, The Motley Fool cannot and does not provide personalized investing or financial advice. This information is for informational and educational purposes only and is not a substitute for professional financial advice. Always seek the guidance of a qualified financial advisor for any questions regarding your personal financial situation.
Imagine doing the things you love without worrying about money. That’s the dream for many Americans. Some achieve this goal in their 60s when they retire. Others can do it even earlier.
One of the top ways people fulfill this dream is by investing in dividend stocks. But can you rely on dividends for life after quitting your job?
Image source: Getty Images.
How could you live off dividends for life?
The concept of living off dividends for life is a simple one. First, you invest a sum of money in stocks that pay dividends. Second, you use the dividend income to cover your expenses after you quit working. Easy-peasy? Not necessarily.
First, you’ll need a substantial amount of money to invest. Exactly how much depends on the dividend yield the stocks you invest in pay. The dividend yield is the annual dividends per share paid by a company divided by its current share price.
Divide the amount of annual income you require by the dividend yield you expect to make to calculate how much money you’ll need to invest. For example, let’s say you want to make $100,000 per year. If you receive a dividend yield of 3%, you’ll need to invest around $3.33 million ($100,000 divided by 3%) to get that amount. That amount is attainable for some, but it could be a stretch for many people.
If you want to retire on dividend income but don’t have $3.33 million to invest, you have two options. First, you could try to get a higher dividend yield. A dividend yield of 5%, for example, would require only $2 million invested to make $100,000 per year. Second, you could try to live on less money. If you could make ends meet on $70,000, you’d need $2.33 million to invest with a 3% dividend yield.
Risks to consider
There are some risks to keep in mind, though. One biggie is that the dividend yield you receive in the future might not be as high as the yield you get at first.
Some companies cut their dividend payments over time. A few even suspend or eliminate their dividend programs. For example, going into 2020, The Walt Disney Company had paid a dividend for over 40 years. As a result of the COVID-19 pandemic, the company suspended its dividend program for three years.
It’s also possible that a company that has reliably paid dividends for a long time will be acquired, resulting in the elimination of its dividend. Walgreens Boots Alliance is a great case in point. The pharmacy giant had a streak of 47 consecutive years of dividend increases as of late 2023. However, Walgreens cut its dividend in January 2024. It’s now in the process of being acquired and taken private.
Inflation is arguably an even greater threat. It can erode the buying power of your dividend income even if none of the stocks you own reduce or suspend their dividends.
Potential strategies
The good news is that there are potential strategies you can follow to minimize these risks. Probably the most important one is to diversify your investments. If you only own five stocks, and one suspends its dividend, your income would be reduced by 20% assuming they are all paying the same amount. But if you own 25 stocks and it happens, your income would be only 4% lower.
Investing in dividend-focused exchange-traded funds (ETFs) is a great way to diversify. For example, the Schwab U.S. Dividend Equity ETF(SCHD+1.09%) owns 103 dividend stocks. Its top holdings include Coca-Cola, Verizon Communications, Altria Group, Cisco Systems, and Lockheed Martin.
The Schwab U.S. Dividend Equity ETF currently offers a dividend yield of around 4%. This ETF has also delivered an average annual return of roughly 12% since its inception in October 2011.
If you want diversification and an even higher yield, closed-end funds (CEFs) could be an alternative. One CEF that I own is the Cohen & Steers Infrastructure Fund . This fund owns 259 stocks. Its distribution yield is a lofty 7.2%. The CEF’s average annual total return since its inception in March 2004 is 9.5%.
There are two key things to note about closed-end funds, though. Many of them use leverage (borrowing), which increases their risk. The Cohen & Steers Infrastructure Fund’s leverage ratio is 28.5%. Their fees are also typically higher than ETFs.
How can you minimize inflation risk ? Look at the history of dividend increases for the companies and funds you’re considering. Just because a company or fund has increased its dividend consistently at an average rate higher than inflation doesn’t mean it will always do so. However, investing in stocks and funds with strong track records of dividend hikes could increase the odds that your annual dividend income at least keeps up with inflation.
Finally, re-evaluate your holdings regularly. The stocks and funds that are great picks today might not be such great picks a few years from now. Many Americans can quit their jobs and rely on dividends for life. But the sources of those dividends could need to change from time to time.
Most peoples Snowball will not be valued in millions, so concentrate your Snowball on the tail not the body.
The blog’s plan is to have a Snowball that pays a yield of around 18% on seed capital of 100k, with no funds added to the Snowball. The longer you have to re-invest your dividends the higher the yield should be.
Warren Buffett just collected another $204 million from Coca-Cola — a reminder that some of the most powerful returns on Wall Street come from patience, dividends, and owning the right business for decades.
Here’s how that payout breaks down, why Coca-Cola keeps funding Berkshire’s war chest, and what this kind of compounding looks like in real dollars.
Coca-Cola has been one of Warren Buffett’s signature bets since the late 1980s, and it’s still paying like clockwork.
Berkshire Hathaway owns 400 million shares, and Coca-Cola’s $0.51 quarterly dividend just delivered a $204 million payout. Sometimes the biggest wins aren’t dramatic. They’re automatic.
Coca-Cola dividends now bring Berkshire over $800 million a year, far beyond the original $1.3 billion cost. Coca-Cola may have its “secret” headlines, but Buffett only cares about one secret: the dividend arriving every quarter.
Why Coca-Cola Still Matters Coca-Cola isn’t just a dividend machine, it’s still a modern profit engine.
With a market cap around $289 billion and gross margins above 61%, the company keeps doing what it does best: defend pricing power, stay everywhere, and find small ways to sell more. Mini cans. Convenience-store pushes. Product tweaks that look boring up close, but scale fast when you’re global.
That durability is why some Wall Street analysts still see upside, with price targets reaching $80. This implies that Coca-Cola is still being priced as a cash machine with staying power. And for Berkshire, that’s the whole point. No hype. No chasing trends. Just owning a durable cash machine, year after year, and letting dividends and compounding do the heavy lifting.
This is where most investors get caught. They chase the hot stock, the pop, the quick win, and end up trading emotions instead of building wealth.
Buffett plays a different game. He doesn’t need to react to every headline. He owns businesses that pay him, then lets time and dividends do the work.
The difference isn’t access to information. It’s behavior, and the traders who last tend to rely on rules, not emotion, like stop-loss and take-profit orders
Why This Dividend Story Matters That $204 million payout is more than a headline number. It’s what long-term investing looks like when the business is durable and the cash flow is real.
While plenty of investors chase the next spike, Buffett’s Coca-Cola stake shows the quieter path: own a high-quality company, let the dividend stack up, and give compounding time to do its job. You don’t need to love soda to take the point, you just need to respect what consistent payouts can build over decades.
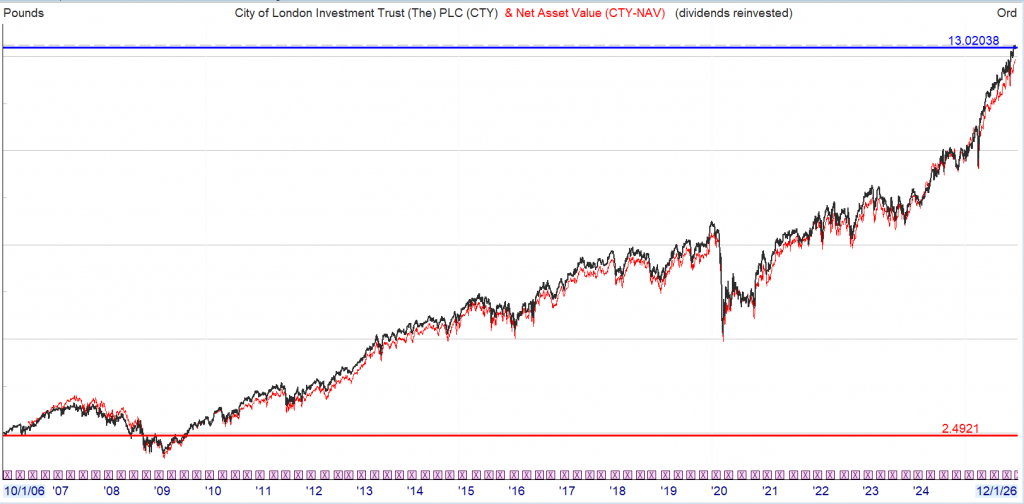
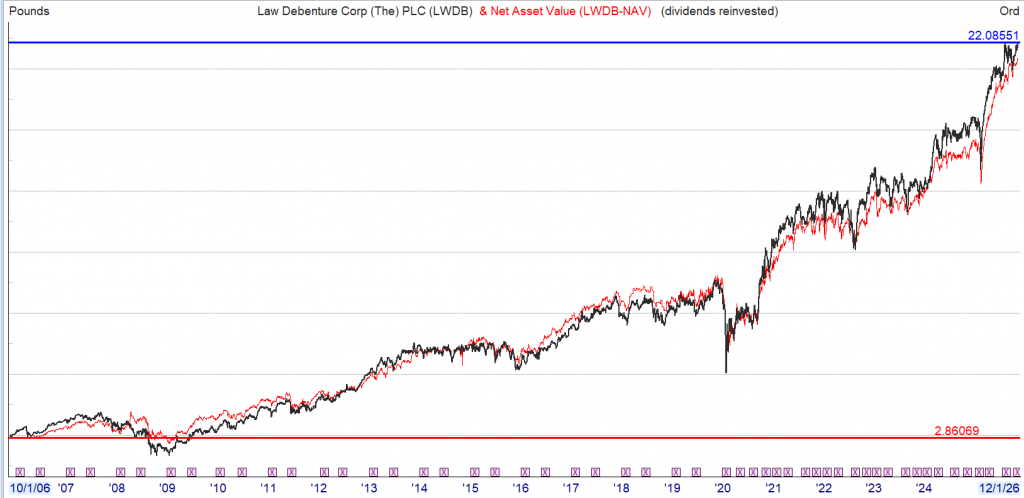
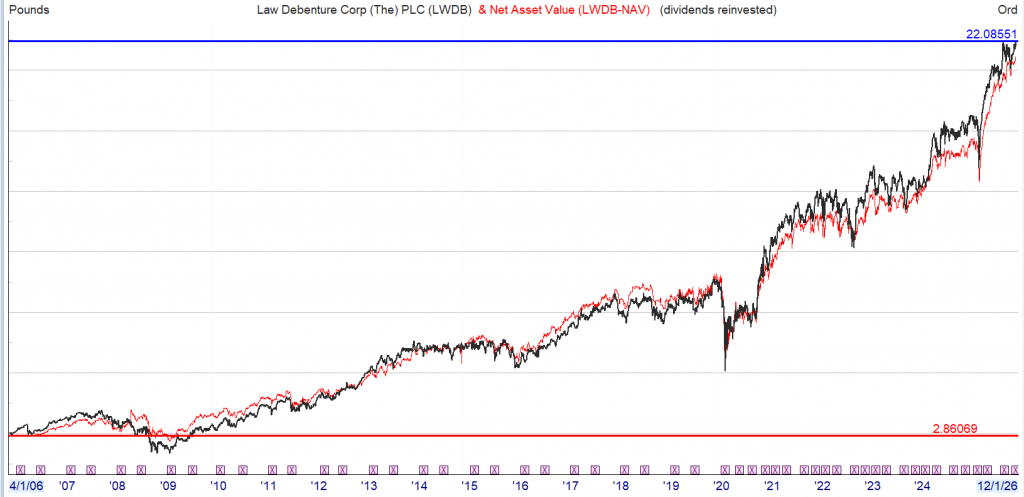
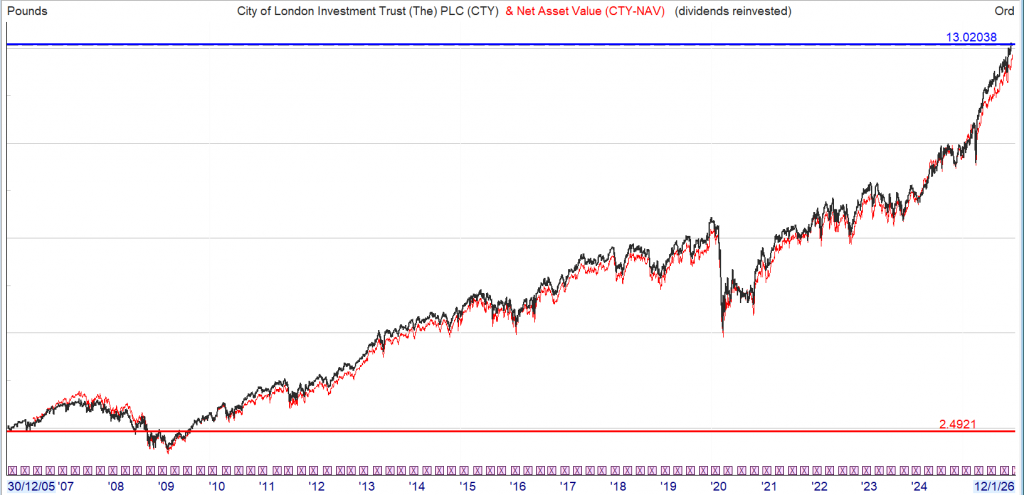
3 Trusts that paid buying dividends around 5%, with a simple strategy of re-investing the dividends back into the Trust.
Current yields.
LWDB 3.15%
CTY 3.75%
AEI 5.69%
The earned dividends could now be re-invested into a money market account or a gilt to build a rainy day fund to buy some bargains when the market next sells off.
Dividends can be more reliable than share prices as they’re driven by the companies performance itself and not by the whim of investors.
As part of a total return / reinvestment strategy, this income could be reinvested into income assets or back into the equity market depending on the relative valuations.
The emotional benefits of dividend re-investment. In fact, with this investment strategy you can actually welcome falling share prices.
There seems to be some perverse human characteristic that likes to make easy things difficult. WB
If I Were To Retire Today, This Is The 20-Stock Portfolio I’d Own
Jan. 02, 2026
Leo Nelissen
Summary
I present a 20-stock model retirement portfolio targeting a balanced 5.6% yield, emphasizing both income and dividend growth.
My approach avoids “sucker yields” by focusing on quality, sustainable payouts rather than chasing unsustainable high-yield stocks.
The portfolio is diversified across BDCs, REITs, energy, and growth names, with allocations reflecting risk, yield, and income stability.
I use the 5% Rule as a guiding principle, aiming for reliable income without excessive risk, tailored for real-life retirement needs.
Wirestock/iStock via Getty Images
Introduction
It’s time to address one of the most asked questions I’ve gotten in recent weeks. I even think it’s the most-asked question if I were to analyze the comment sections of all of my recent articles.
That question is what a “Leo retirement portfolio” would look like.
I really like this question. Although I spend a lot of time discussing higher-yielding stocks, I never discuss them from my point of view, as I do not run a retirement portfolio. That’s because of two reasons that are somewhat related:
I’m 30, which means, God willing, I have many more decades to compound my wealth.
I have zero interest in retiring. If someone were to wire me $10 million today, I would likely still do what I’m doing on a daily basis. On a side note, I’m open to trying this experiment, in case anyone has some spare cash (!!!).
That said, there are reasons why I cover higher-yielding stocks. On top of my belief that value stocks (this group includes many higher-yielding stocks) are very attractive for the current macro environment, I know that many of my readers are retired and/or interested in companies that pay a decent income.
Based on that context, I’m not using this as an opportunity to randomly give you some high-yield picks that I like. As you specifically asked for a “Leo retirement portfolio,” I spent the past few days thinking about an approach that would fit my strategy and my goals, all based on my real life.
So, as we have a lot to discuss, let’s get right to it!
Let’s Talk About (My) Retirement
On Feb. 21, 2025, I wrote an article titled “If I Had To Retire Today, These Are The Dividend Stocks I’d Bet My Future On.” In that article, we discussed some of the fundamentals of retirement.
This includes the question about what amount we need to retire. I used the quote below, which is from a Fidelity article:
Our savings factors are based on the assumption that a person saves 15% of their income annually beginning at age 25 (which includes any employer match), invests more than 50% on average of their savings in stocks over their lifetime, retires at age 67, and plans to maintain their preretirement lifestyle in retirement. – Fidelity
Technically speaking, if you follow the rules above, you’ll be able to retire comfortably at age 67, as you will have saved 10x your pre-retirement income. Again, all else being equal, that should be the goal:
Fidelity
There are unfortunately some problems:
Not everyone is equal. Some of us are blessed with good health. Others aren’t. Some encounter financial problems like unexpected health costs, family members who require care, or employment difficulties that cause prolonged unemployment (this eats away at savings and hurts the ability to invest). Also, some inherit a lot of money. Others don’t.
What if you’re 45 and have never seriously considered how important building a nest egg is? According to simple math, you may now be forced to invest a bigger share of your income in assets with potentially higher returns (this also carries higher risks).
The first client we ever worked for made so much money in a single year as a hedge fund manager; he could have allowed my entire neighborhood to retire early. Meanwhile, other people I know invest $50 each week. That’s their limit.
We’re all different, yet we will all be dependent on retirement income one day.
This also goes for our income and expenses. If you live in West Virginia on a good salary, it may be much easier to retire than for someone who makes an average income in a place like Southern California.
Using the income inequality map below, we see that the odds that someone on a relatively low salary has to deal with somewhat elevated costs are the highest in places like New York, California, Louisiana, Illinois, and even Texas and Florida to some extent. But then again, I’m painting with a broad brush.
The Visual Capitalist
My personal situation is a bit more complex.
I don’t work a 9-5. Since 2020, I have basically been on 24/7, which included various jobs (often with the same team) like advising a hedge fund and providing third-party macro and geopolitical intelligence. Meanwhile, I have, almost without skipping a beat, published at least one Seeking Alpha article a day for more than three years straight.
I’m not complaining. I love my job, which is why I decided to make it even more complex this year, as I am moving to Albania, picking up where I left off as a hedge fund advisor (later in 2026), and I launched a new research platform with one of my closest friends.
And, obviously, I’m not changing anything about what I do here on Seeking Alpha.
There are a few reasons I’m telling you all of this:
I currently live in the Netherlands. Because of my unusual job situation, I’m not building a pension (through an employer), am not insured against unemployment, and am basically dependent on my own income to eventually retire.
I may love my job, but I don’t have the job security someone with a steady 9-5 job may have. I’m not complaining, as it’s by choice. But still…
I’m basically forced to make as much money as possible. So far, that has worked out quite well, as I have been blessed with more-than-decent income. It allowed me to invest in Albanian real estate, and, even more importantly, it also allowed me to build a retirement game plan.
See, while I may not be running a retirement account, I promise you I can turn my portfolio immediately into an income portfolio if, for some reason, I’m forced to do so.
For these plans, I’m using what I have called the 5% Rule in prior articles (like this one). Basically, I’m saying that we should aim for a retirement that comfortably covers our expenses if we get a 5% to 6% yield. This has a number of benefits, including that it keeps many (younger) investors from focusing too much on income.
Here’s what I wrote in the article I just mentioned:
So, what really is the 5% Rule, you may ask?
For starters, if I had to summarize this strategy, it would be something like this: I am convinced that 5% is the sweet spot between buying income and dividend growth without taking on the risks of buying a “sucker yield.”
Or to put it differently, I believe I can build fantastic dividend income portfolios picking from stocks yielding close to 5%.
But even more important, it keeps us from chasing unsustainable dividends.
If there’s one thing I hate, it’s to see people buy into risky, high-yielding stocks just to end up with both capital losses and dividend cuts.
Especially in my situation, there’s no room for those kinds of risks.
Now, let’s look into the portfolio.
My 20-Stock Retirement Model Portfolio
One flaw of my prior articles, which focused on stocks I would buy if I were to retire, is that this article only discussed a few picks, not an entire portfolio.
I’m changing that in this article, as I already mentioned.
Group 1 has the big yields. These basically supercharge my portfolio’s income without the need to trade derivatives, like selling covered calls. Or, to put it differently, without these stocks, there’s no way I can buy growth-focused stocks without failing to reach my target of roughly 5.5% pre-tax income.
After all, even when I retire, I still want to own a few growth-focused dividend stocks, as compounding wealth should still matter, even in retirement.
In my case, I went with two of my favorite business development companies, which are basically entities that lend capital to small- and mid-cap borrowers.
Growth and Income Potential with BDCs (VanEck)
I went with Blue Owl and Capital Southwest as heavy hitters here. They have double-digit yields. Blue Owl is externally managed, while Capital Southwest is internally managed by a team that has done a tremendous job beating the average BDC in recent years, as the chart below shows.
Ares Capital Corp. is one of my favorites as well, as I consider Ares Management (ARES), the manager of ARCC, to be the best private credit growth company in the world. They have excellent management and do a great job managing risks. Someone once called it the “JPMorgan of private credit.” I really like that description.
In future articles, I’ll elaborate on ARES.
OBDC is a bit riskier, yet I like its valuation. To me, OBDC is one of the few BDCs trading below its book value that I expect to rebound substantially.
With that said, the lending business is cyclical. Investing roughly a fifth of the portfolio in these stocks is a somewhat risky move. However, it fits my risk profile, and I trust these BDCs to get the job done.
Then there’s the mixed category, which accounts for roughly half of the portfolio.
And, if you have been a follower of mine for more than a few days, you may not be surprised that I went with REITs and energy, two of my favorite themes for income in 2026 and to buy dividends in general.
It includes Realty Income and VICI Properties. Technically, both are way too boring for my taste, as they have low-to-mid-single-digit annual growth and basic inflation protection (escalators usually capped at 2-3%).
However, for income, I happily own them. Both have net lease structures, where tenants are responsible for insurance, taxes, and maintenance expenses. In the case of Realty Income, which pays monthly dividends, it’s paid by stellar retailers and some industrial/leisure companies (see below).
Realty Income
VICI generates half of its rent from the Las Vegas Strip. It’s not ideal for them right now, given that Las Vegas has some issues, but VICI benefits from owning some of the best assets on the Las Vegas Strip, including the MGM Grand, Mandalay Bay, and Caesars Palace. In November, it also bought the STRAT, which it got in a major sale-leaseback deal to expand its footprint.
VICI Properties
These assets are all protected by master leases, which means even their biggest tenants cannot selectively decide to stop renting certain assets. And even if they could, the major assets are too important for these companies.
On top of that, I went with Agree Realty. It has a lower yield than Realty Income, yet a more favorable spread between investment yields and its weighted average cost of capital. This is mainly because of its size benefit vs. Realty Income, as it can be extremely selective in its deals and use its ultra-safe balance sheet to get attractive deals on debt and equity.
Agree Realty
Then, I would add a bunch of midstream companies, including Enbridge, which basically combines midstream and regulated utility exposure under one roof; TC Energy, which is a pure-play natural gas midstream company with some nuclear energy exposure; Antero Midstream, which is a much smaller player in the Appalachia region, where it generates a free cash flow yield of roughly 10%; and ONEOK as well as Kinder Morgan, which cover the fast-growing natural gas and natural gas liquids industries in areas like the Permian.
Antero Midstream
All of these companies are C-Corps, which means none of them issue K-1s.
Essentially, one could pick just one or two midstream stocks, especially as Enbridge is already so diversified. However, for the sake of building a more robust portfolio, I went with players that cover all main regions to basically build bulletproof income, even in the event of subdued oil and gas prices.
Enbridge
I also added Canadian Natural Resources, which has hiked its dividend for 25 consecutive years with a CAGR of more than 20%. Chevron was added simply for its income and the fact that it’s an integrated oil company that has both upstream and downstream (including chemicals). Although I have often said that I consider Chevron to be too boring (that’s not a bad thing), it makes sense for an income portfolio.
Basically, the mix part of the portfolio is a mix of real estate and energy with a focus on “hard assets.” It’s like buying a midstream and REIT ETF without owning all the weaker players.
In the growth part of the portfolio, I put slightly less than 30% of total capital.
Here, I own some of my favorite companies, including RTX, which has both commercial and defense aerospace exposure; Union Pacific, which is the largest Class I railroad; Prologis, the owner of next-gen warehouses; Ares Management, one of the fastest-growing private credit giants; and Blackstone, a company that covers my alternative asset exposure. I also added Lockheed for its income and conservative profile.
Union Pacific Corp.
Ares, which I already briefly mentioned, is different. It doesn’t have traditional credit risk, as its dividend is paid by its fee income. The company simply allocates customer money to debt deals, on which it earns fees. Credit risk, for Ares itself, is rather subdued. This is my way of benefiting from a rapidly rising private credit market and ARES’s ability to potentially exploit this more than others.
Ares Management
Putting it all together, the portfolio has a yield of roughly 5.6%.
In this article, I wanted to show that it’s possible, without derivatives, to buy a decent income that also provides growth. One thing I could change is to lower my BDC, REIT, and midstream exposure and replace it with a covered-call ETF like the JPMorgan Nasdaq Equity Premium Income ETF (JEPQ). This ETF applies a covered call strategy on the Nasdaq and yields slightly more than 10.0%. By doing so, I could free up some capital to expand my growth-focused exposure.
I could also, if needed, erase some growth exposure and buy high-quality preferred equities. This would obviously hurt the growth profile, but it would help the income profile without increasing the risk. When done properly, it could easily improve the risk profile.
Bonds were not included, as I prefer bond proxies like REITs. If long-term government bond rates were to decline, these assets would likely benefit a lot, as the market would look for other places to buy income. This would apply to high-quality dividend stocks in general.
If I had this portfolio and additional cash, I would likely opt for ultra-short-term bills and low-risk preferred equities to store it.
There are thousands of ways to play this, and I think that this is one way to buy income, decent growth, safety, and a foundation that allows for a lot of adjustments.
After all, this is no complex portfolio.
Takeaway
I’m not retired, and I’m not planning on retiring. At least not anytime soon.
However, in this article, I discussed a portfolio I would love to own if I were to retire. It follows my 5% Rule, consisting of hard-asset gems, safe dividend payers, and some heavy hitters in areas like elevated income and dividend growth.
I think this is the kind of portfolio that could cover my bills for many years to come without causing me to lose sleep at night.
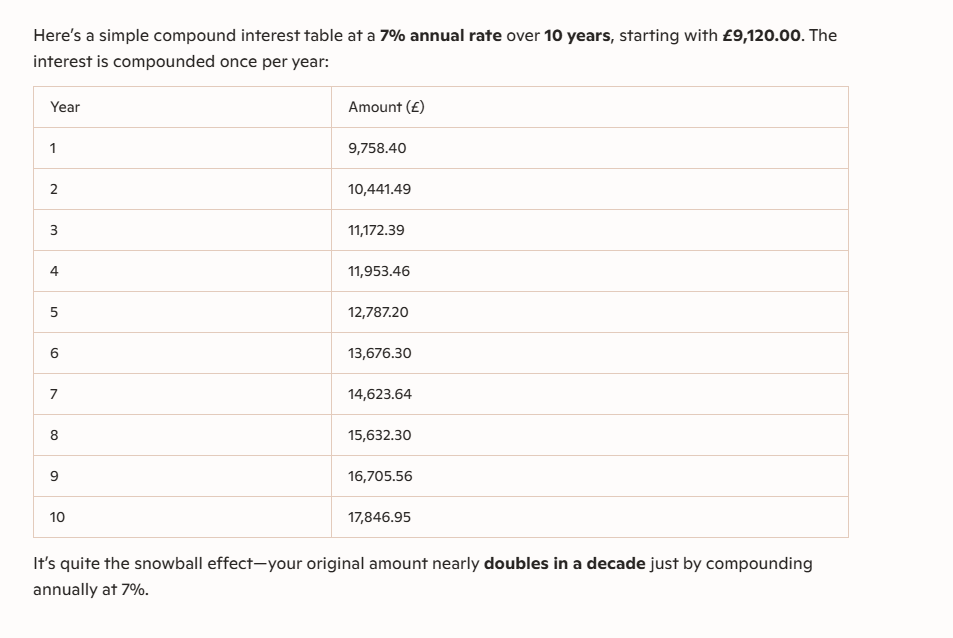
The interesting thing about compound interest is that you stand to make more in compound interest in the later years of your Snowball than in all the early years.
Good news if you only have a modest amount in savings but intend to add to your Snowball when you can.
“The true investor… will do better if he forgets about the stock market and pays attention to his dividend returns.” – Benjamin Graham
How to harness the power of dividends Dividends went out of style in the pandemic. It’s great to see them back, says Rupert Hargreaves
Dividend income has always been one of the key contributors to equity-market returns, especially in periods of volatility or bear markets. In the 1970s and 2000s, both periods of significant market volatility for the S&P 500, virtually all of the index’s returns came from income, according to data compiled by Bloomberg and Guinness Global Investors. In the 1970s, the index recorded growth of 76.9%, with 17.2 points coming from price appreciation and 59.7 from dividend income. In the 2000s, the index fell by 24.1%, but dividends added 15 points for a total return of -9.1%.
The longer one stays invested, the more critical dividends become. Guinness Global’s data, going back to 1940, reveal that, over rolling one-year periods, the total contribution from dividend income to total return was just 27%, but that number grew to 57% over a rolling 20-year period. They also reveal that $100 invested at the end of 1940, with dividends reinvested, would have been worth approximately $525,000 at the end of 2019, versus $30,000 with dividends paid out. In this period, dividends and dividend reinvestments accounted for 94% of the index’s total return.
If you want to be a Warren Buffett mini me.
Warren Buffett just collected another $204 million from Coca-Cola — a reminder that some of the most powerful returns on Wall Street come from patience, dividends, and owning the right business for decades.
Here’s how that payout breaks down, why Coca-Cola keeps funding Berkshire’s war chest, and what this kind of compounding looks like in real dollars.
Coca-Cola has been one of Warren Buffett’s signature bets since the late 1980s, and it’s still paying like clockwork.
Berkshire Hathaway owns 400 million shares, and Coca-Cola’s $0.51 quarterly dividend just delivered a $204 million payout. Sometimes the biggest wins aren’t dramatic. They’re automatic.
Coca-Cola dividends now bring Berkshire over $800 million a year, far beyond the original $1.3 billion cost. Coca-Cola may have its “secret” headlines, but Buffett only cares about one secret: the dividend arriving every quarter.
Why Coca-Cola Still Matters Coca-Cola isn’t just a dividend machine, it’s still a modern profit engine.
With a market cap around $289 billion and gross margins above 61%, the company keeps doing what it does best: defend pricing power, stay everywhere, and find small ways to sell more. Mini cans. Convenience-store pushes. Product tweaks that look boring up close, but scale fast when you’re global.
That durability is why some Wall Street analysts still see upside, with price targets reaching $80. This implies that Coca-Cola is still being priced as a cash machine with staying power. And for Berkshire, that’s the whole point. No hype. No chasing trends. Just owning a durable cash machine, year after year, and letting dividends and compounding do the heavy lifting.
This is where most investors get caught. They chase the hot stock, the pop, the quick win, and end up trading emotions instead of building wealth.
Buffett plays a different game. He doesn’t need to react to every headline. He owns businesses that pay him, then lets time and dividends do the work.
The difference isn’t access to information. It’s behavior, and the traders who last tend to rely on rules, not emotion, like stop-loss and take-profit orders
Why This Dividend Story Matters That $204 million payout is more than a headline number. It’s what long-term investing looks like when the business is durable and the cash flow is real.
While plenty of investors chase the next spike, Buffett’s Coca-Cola stake shows the quieter path: own a high-quality company, let the dividend stack up, and give compounding time to do its job. You don’t need to love soda to take the point, you just need to respect what consistent payouts can build over decades.
You do not need to take high risks with your hard earned, above the dividends have been re-invested, where because of the lower yield you might have re-invested elsewhere in your Snowball.
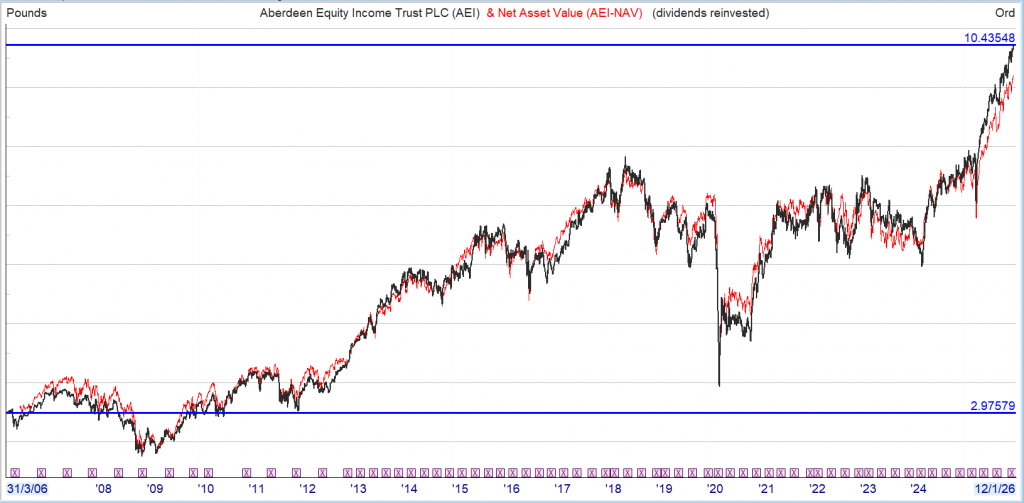
If you had bought at £2.50 the yield was around 4% and the current yield on buying price is 8.5%
An option for your Snowball might be to squirrel away some of your dividends, especially if you have a long time before you want to spend your dividends, in a quasi tracker as markets will always go higher because of inflation although near the end of a bull run, maybe is not the best time to start a position.
Finally the rules for the Snowball for any new readers. There are only 3.
Rule one. Buy shares that pay a ‘secure’ dividend and use those dividends to buy more shares that pay a ‘secure’ dividend.
Rule two. Any share that drastically changes its dividend policy mist be sold, even at a loss.