


Investment Trust Dividends
Michael Foster, Investment Strategist
Updated: December 15, 2025

One thing I’ve always been astonished by is how fast a winning strategy (in investing and in life!) can suddenly slam into a wall—and start causing a lot of pain.
Consider, for example, the life of a mortgage banker in the 2000s: They made easy money for years, then the subprime-mortgage crisis threw them out of work overnight.
This happens in investing, too, which is why it’s always good to stay humble and well-diversified. Some high-yielding closed-end funds (CEFs), for example, look like big winners at any given moment. But if you buy without looking under the hood, you’re risking sharp losses.
Which brings me to …
The Top-Performing CEF of 2025
The year isn’t over, but the ASA Gold & Precious Metals Fund (ASA) is so far ahead of other CEFs that it would take a miracle for it to be overtaken by year-end.
ASA’s Unbelievable Year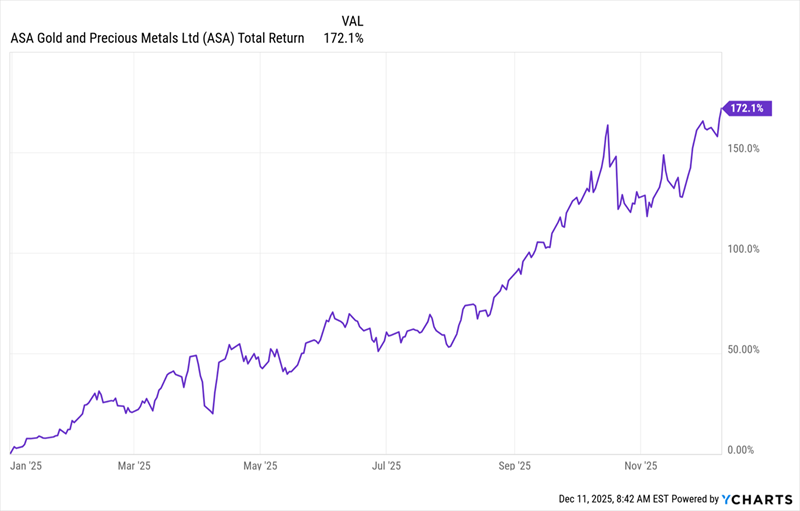
ASA is up 172% (!) in 2025, and it’s easy to see why: The CEF invests in miners of gold and precious metals, and gold has been on a tear. But the scale of its run is still breathtaking, as none of the 5 CEF subsectors tracked by my CEF Insider service have even cracked 15%.
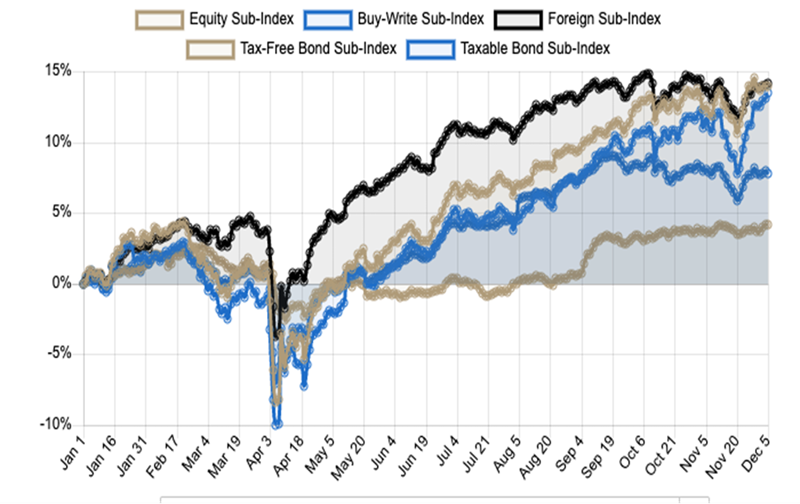
Source: CEF Insider
So with that in mind, is ASA a buy now?
No way. For one, the fund yields just 0.1%, while the average CEF pays over 8.3%. So for us income investors, ASA is a no-go. Second, since gold miners’ share prices are tied directly to gold, ASA does well when gold soars, which happens every so often (such as in the past year), but these surges tend not to stick around.
We can see that last point in ASA’s long-term performance, in purple below, in relation to a popular S&P 500 ETF (in orange).
This Gold Fund Trails Stocks …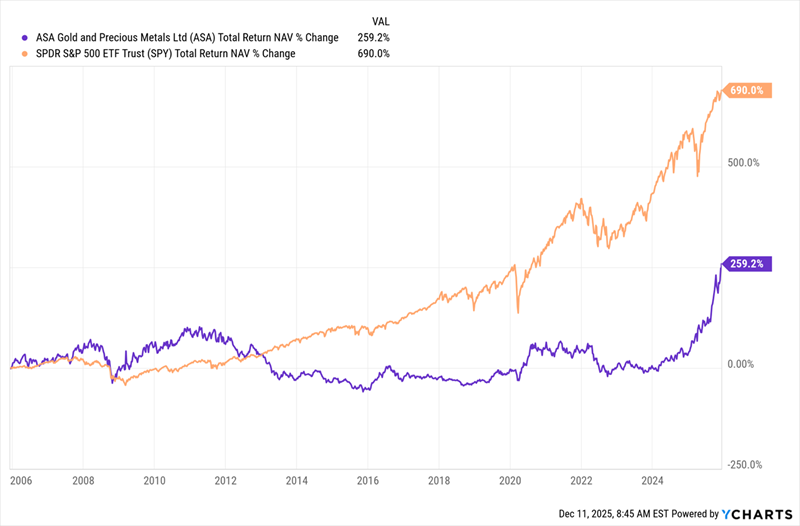
Over the last two decades, ASA has badly trailed the S&P 500 on a total-NAV-return basis (that is, by the performance of its portfolio, not its market-price-based return).
Worse, if you retired 20 years ago and bought ASA at that time with the intention of relying on it, many of your withdrawals would’ve cost you money, especially during the seven-year period in the 2010s when ASA (again in purple below) would’ve been mostly underwater for you.
Moreover, not only does ASA lag stocks in the long run, but it trails gold prices, too, shown in orange above by the performance of the gold-price-tracking SPDR Gold Shares (GLD) ETF, in orange, since that fund’s inception in late 2004.
… and Gold Prices, Too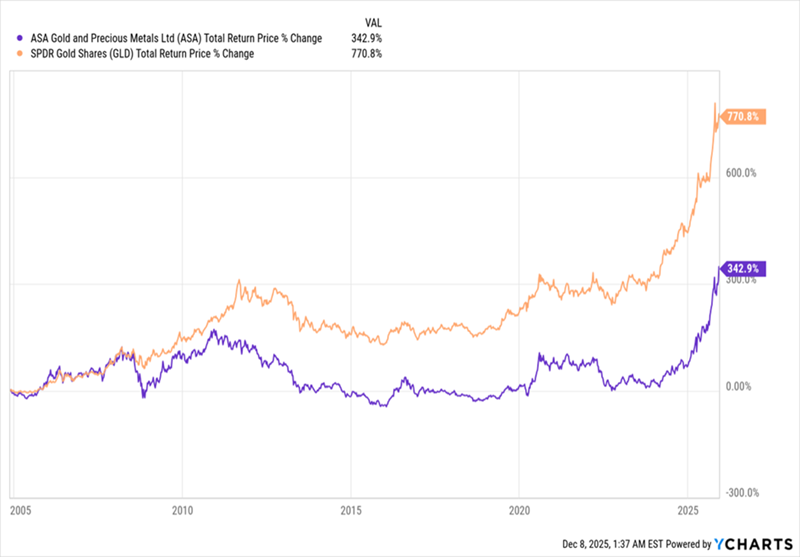
The bottom line? If you’re looking for gold exposure, ASA is not the way to do it. In addition, the fund is a good illustration of why we avoid gold at CEF Insider: We’re looking for high current income first and foremost (our portfolio yields 9.5% on average), and there aren’t enough gold investments with yields high enough to excite us.

3 High-Yield Stock CEFs That Beat ASA
Looking beyond gold, there are many CEFs—on the stock and bond side, specifically—that beat ASA in terms of long-term outperformance and income. Below are three that all trade at attractive valuations, as well.
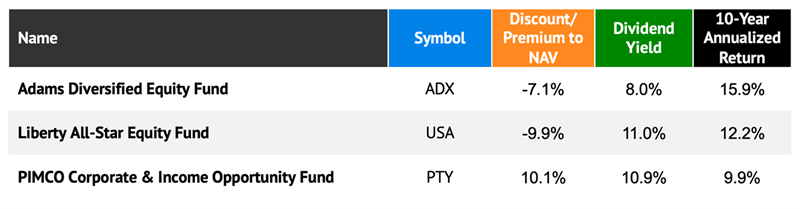
Both the Adams Diversified Equity Fund (ADX) and Liberty All-Star Equity Fund (USA) focus on stocks, including key blue chips like Nvidia (NVDA), Microsoft (MSFT) and Visa (V). And they give us those stocks at attractive discounts, with ADX sporting a 7.1% discount to NAV and USA trading about 10% below its portfolio value.
The 10.9%-yielding PIMCO Corporate & Income Opportunity Fund (PTY), meanwhile, is a corporate-bond fund that’s maintained a strong, and monthly paid, dividend since inception in 2002 (with regular special dividends).
PTY does trade at a 10.1% premium to NAV now, but that’s because it’s a PIMCO fund, and the firm has a sterling reputation in the small CEF world. And that 10.1% premium is actually a bargain, as it’s traded at a 19.7% average premium over the last 52 weeks.
These three funds get you a “mini-portfolio” yielding 10% on average, or roughly 90 times more than ASA. They’ve outperformed the gold CEF (in orange below) going back to 2003, the year that the youngest of these funds, USA, went through its IPO:
Top Bond and Stock CEFs Outrun ASA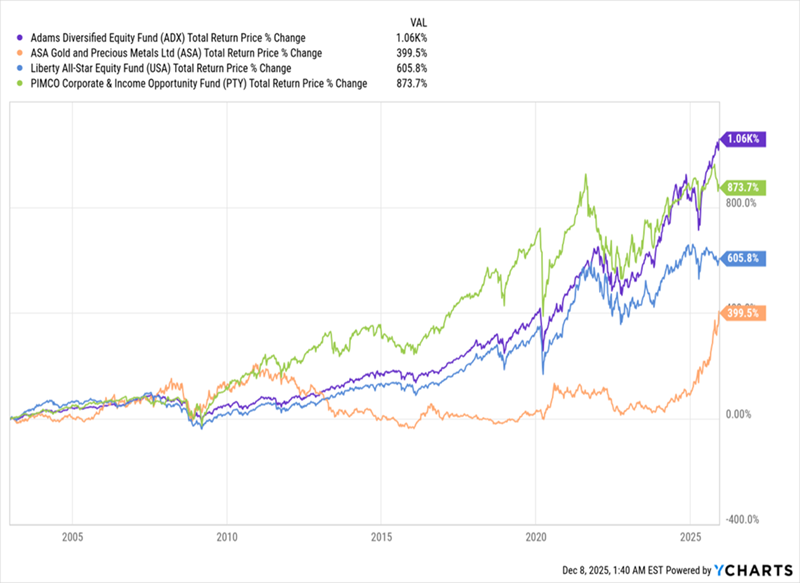
Since then, ASA (in orange above) has delivered a return less than half the size of the other three, on average, while yielding basically nothing.
Of course, if we look only at 2025, we don’t see this: ASA looks like a big winner that is crushing the other three funds. That’s the risk investors face when they ignore history: a recency bias that can cost a lot of money.
Anyone making big profits today with ASA might feel like a big winner, and they are—for now. But over the long term, they have a strong chance of underperforming, especially if the fund reverts to the trend line it’s been on for decades. Worse, there’s no real income to tide shareholders over while they wait for ASA’s next rise.
Contrarians: These 8%+ “AI-Powered” Dividends Are My Top 2026 Buys
As we just discussed, gold, and gold-focused funds like ASA, are long overdue for a breather (or worse!). So we’re NOT chasing them as 2026 dawns.
But the sector we ARE buying as the new year breaks will likely surprise you: AI.
Not just AI stocks, but AI stocks (CEFs, to be specific) kicking out huge dividends! I’m talking about 4 specific funds throwing off 8%+ dividends as I write this.
Look, it’s impossible to ignore all the chatter about an AI bubble right now. I get it. But the bottom line is, corporate profits are still rising and American GDP is growing. This is NOT the opening act of a recession—it’s a boom in productivity!
And it’s still early days, too.
The trouble for us income investors is that “classic” AI stocks, like NVIDIA (NVDA), pay low (or no) dividends. Which is why we look to CEFs for our AI buys.

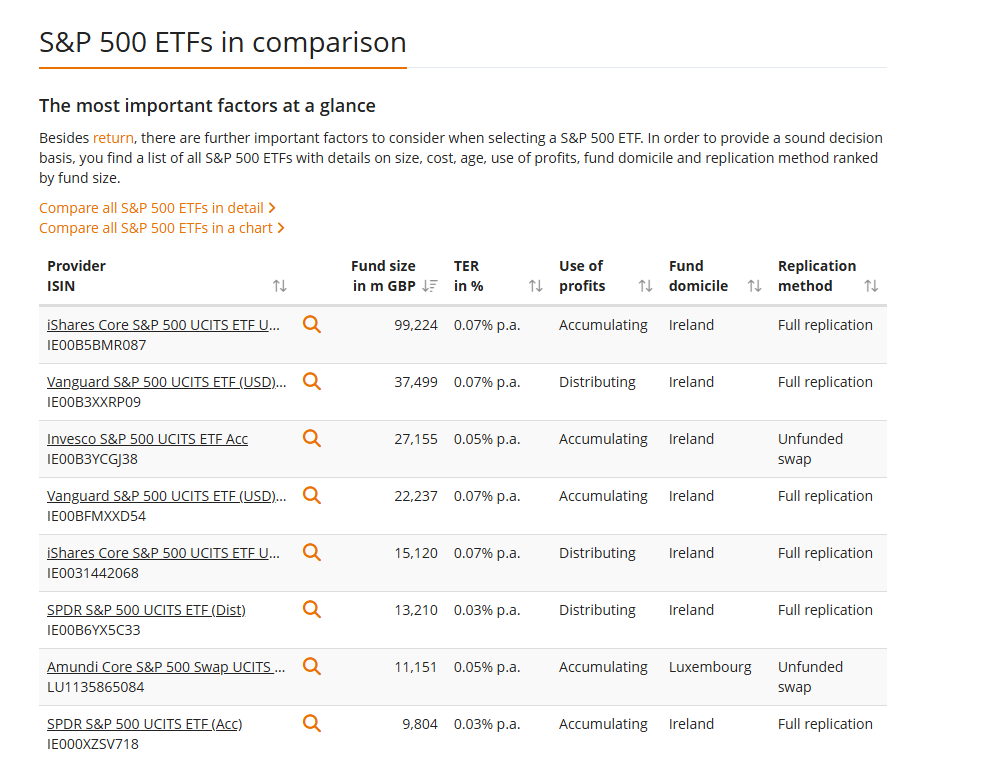
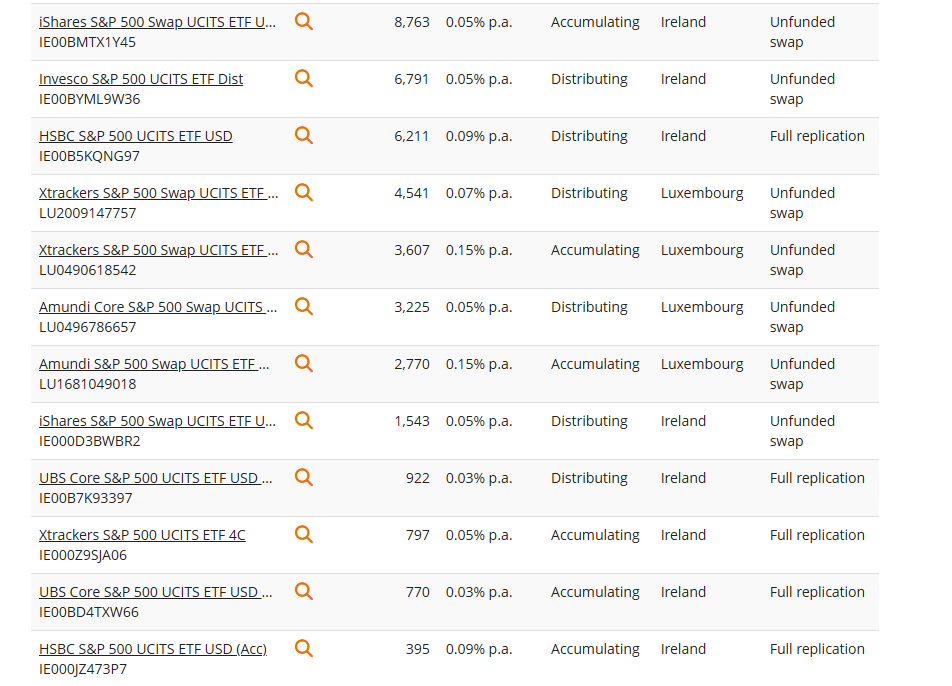
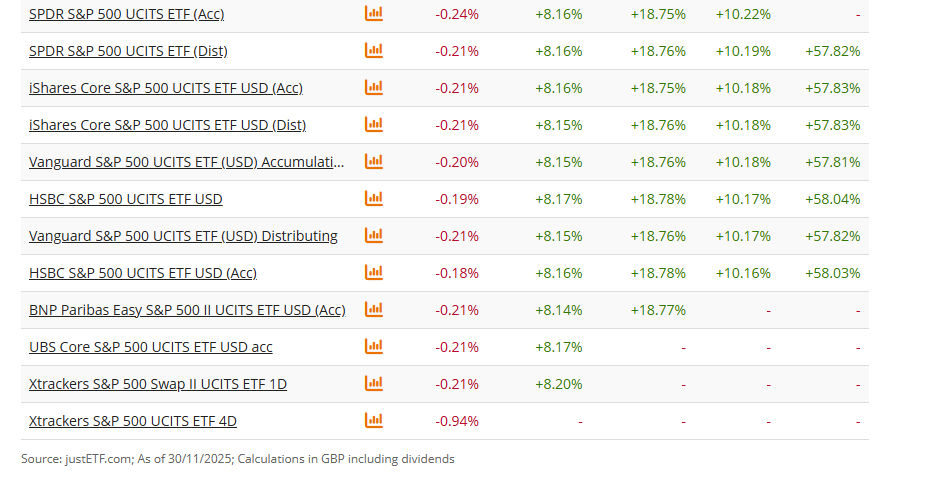
The S&P 500® is the major US stock market index. It tracks the 500 largest US companies. The S&P 500 index weights its constituents by free float market capitalisation.
ETF investors can benefit from price gains and dividends of the S&P 500 constituents. Currently, the S&P 500 index is tracked by 24 ETFs.
0.03% p.a. – 0.15% p.a.
annual total expense ratio
track the S&P 500®
+11.57%
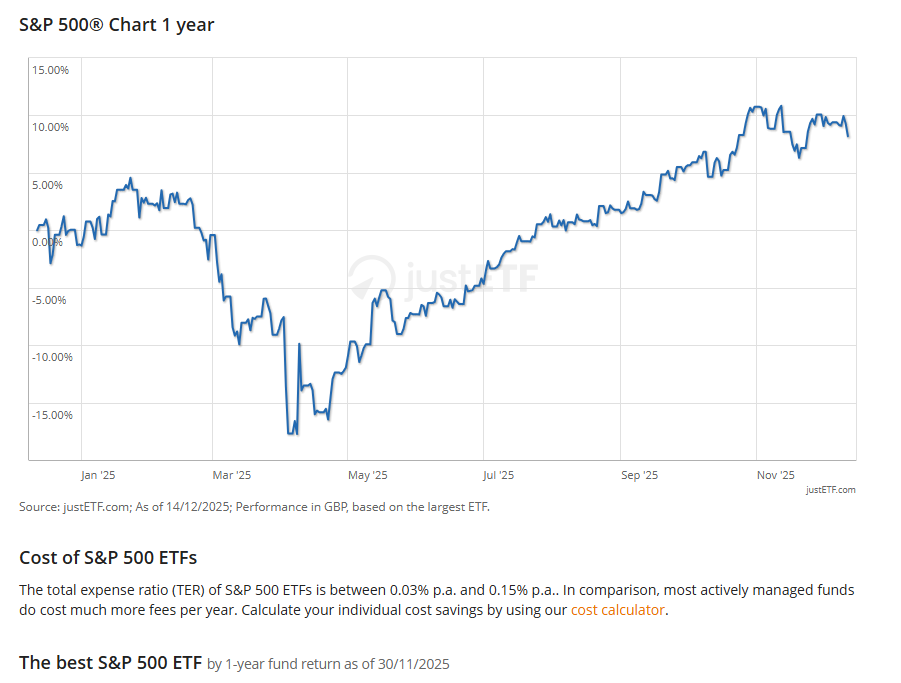
return in GBP in 2025 per 30/11/2025

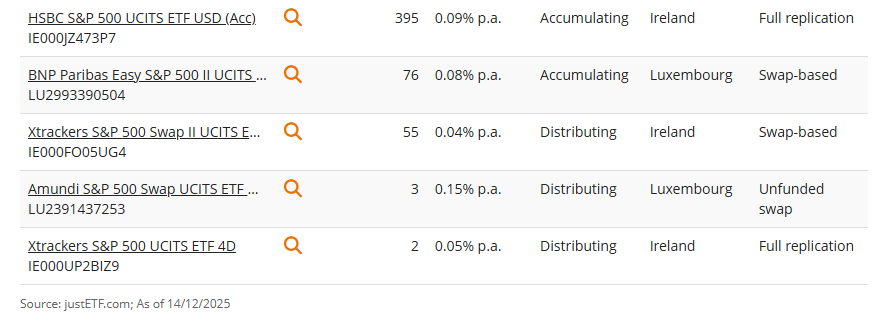
Source: justETF.com; As of 14/12/2025; Performance in GBP, based on the largest ETF.
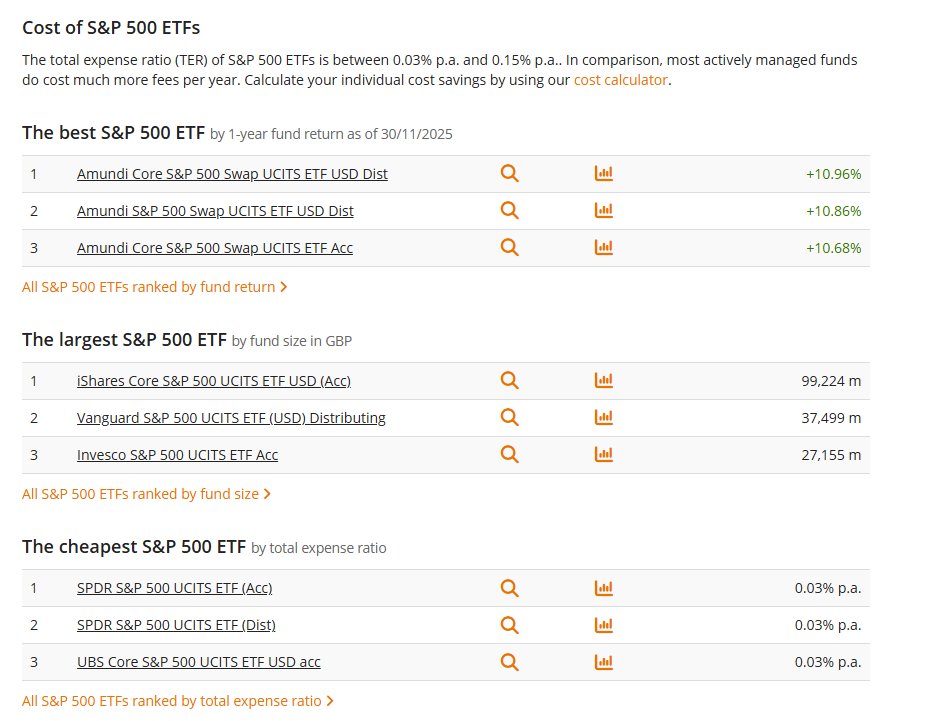
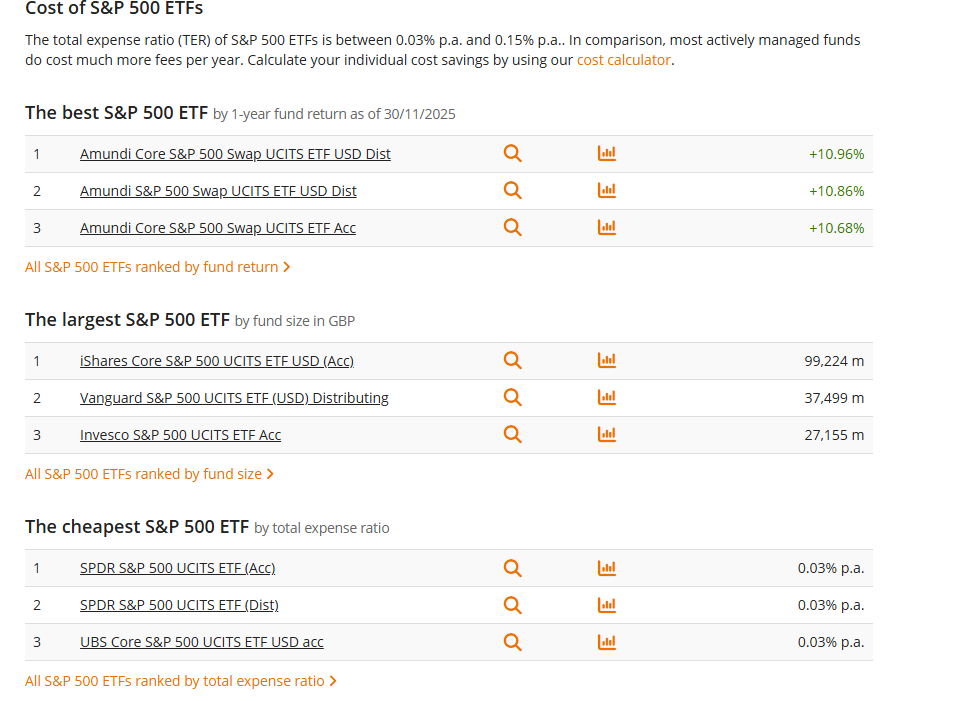
The total expense ratio (TER) of S&P 500 ETFs is between 0.03% p.a. and 0.15% p.a.. In comparison, most actively managed funds do cost much more fees per year. Calculate your individual cost savings by using our cost calculator.
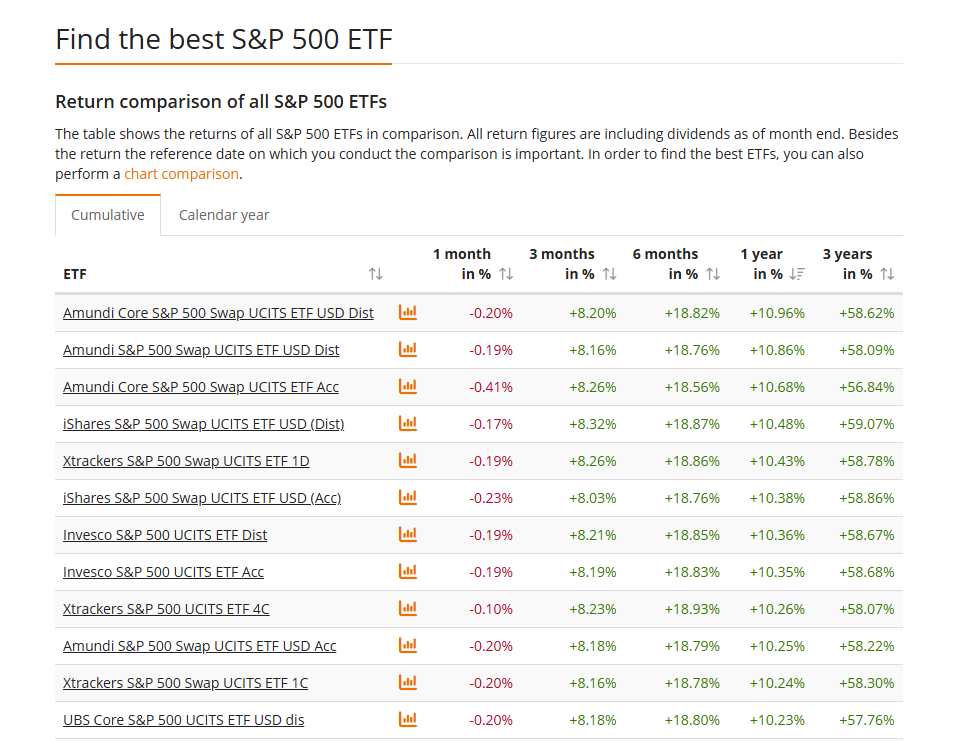
| 1 | Amundi Core S&P 500 Swap UCITS ETF USD Dist | +10.96% | ||
| 2 | Amundi S&P 500 Swap UCITS ETF USD Dist | +10.86% | ||
| 3 | Amundi Core S&P 500 Swap UCITS ETF Acc | +10.68% |
All S&P 500 ETFs ranked by fund return
Thursday 18 December
Barings Emerging EMEA Opportunities PLC ex-dividend date
Diverse Income Trust PLC ex-dividend date
Invesco Asia Dragon Trust PLC ex-dividend date
JPMorgan European Discovery Trust PLC ex-dividend date
Mercantile Investment Trust PLC ex-dividend date
Northern Venture Trust PLC ex-dividend date
Palace Capital PLC ex-dividend date
Real Estate Investors PLC ex-dividend date
SDCL Efficiency Income Trust PLC ex-dividend date
STS Global Income & Growth Trust PLC ex-dividend date
Templeton Emerging Markets IT PLC ex-dividend date
Town Centre Securities PLC ex-dividend date
Volta Finance Ltd ex-dividend date

I’ve bought as the replacement pair trade 1336 shares in BRAI Black Rock American Investment Trust.
BRAI are paying an enhanced dividend of 6% based on the latest NAV, so will be more variable than most dividends.
3 November 2025
The Board of BlackRock American Income Trust plc is pleased to announce the fourth quarterly interim dividend in respect of the financial year ended 31 October 2025 of 3.44 pence per ordinary share. The dividend is payable on 12 December 2025 to holders of ordinary shares on the register at the close of business on 14 November 2025 (ex-dividend date is 13 November 2025). The quarterly dividend has been calculated based on 1.5% of the Company’s NAV at close of business on 31 October 2025 (being the last business day of the calendar quarter) which was 229.56 pence per ordinary share.

If you type BRAI in the search box there is further research on the share there.

I’ve sold the Snowball’s shares in TMPL for a profit of £57, including the earned dividend but not yet received.


That unpredictability is exactly what led Ray Dalio, founder of Bridgewater Associates and an influential voice in macro investing, to develop what’s widely known as the All-Weather Portfolio. It’s designed to be balanced enough to survive different economic climates without requiring constant adjustments. And while his exact institutional strategy is more complex than the simplified version shared publicly, the core idea is accessible to everyday investors: diversify across environments instead of trying to forecast them.
This approach does not promise to outperform every year. What it does promise is resilience. When the market is hot, it participates. When the market turns, it cushions. And in a world where volatility isn’t going away anytime soon, building a portfolio that can handle multiple scenarios is not optional.
Traditional investing advice tends to lean on forecasting. Analysts try to predict the next recession, the next bull run, the next interest rate cycle, or the next geopolitical shock. But the reality, supported by decades of economic research, is that even expert predictions are often wrong.
Rob Pitts
Little investment, big gains (secret to entrepreneurship)
Studies from organizations such as the National Bureau of Economic Research (NBER) show that macroeconomic forecasting consistently struggles with accuracy, especially around turning points like recessions or rapid recoveries.
Markets move quickly, and by the time a trend becomes obvious, it may already be priced in. The All-Weather philosophy avoids predictions altogether. Instead, it accepts a simple reality:
Economic conditions move through cycles like growth, recession, inflation, and deflation — and no single asset performs well in all of them.
Much of the All-Weather strategy is built around understanding how assets behave in different macro environments. The four main environments investors face are:
Companies earn more, consumers spend more, and equity markets typically perform well. Investors feel confident. Risk assets flourish.
Recessions, slowdowns, and contractions. Corporate profits drop. Investors seek safety. Bonds and defensive assets become more attractive.
Money loses value faster, and commodities like gold, energy, and broad commodity indices generally improve. Inflation-linked bonds also offer protection.
Prices stabilize or decrease. Long-term government bonds tend to outperform because interest rates often fall in these conditions.
While the true institutional version is proprietary, the simplified version popularized by Dalio includes:
But understanding the logic behind each piece matters far more than memorizing percentages.
Equities are still the most reliable long-term driver of returns. They perform best when:
Multiple studies, including long-term analyses from Credit Suisse Global Investment Returns Yearbook, consistently show that equities outperform most asset classes over decades but do so with significant volatility.
In an all-weather structure, stocks are essential but intentionally not dominant. You want enough to benefit during expansions but not so much that your portfolio collapses during recessions.
Long-term Treasury bonds (or their equivalent in your country) shine during:
During market stress, investors tend to move money into government-backed securities, which boosts bond prices. Historically, long-term Treasuries have often delivered some of their strongest performances when equities sold off sharply.
The key is that long-duration bonds are extremely sensitive to interest rate changes, which is both a risk and an advantage. In an all-weather approach, that sensitivity works as protection against deflation and slowdowns.
These bonds don’t swing as dramatically as long-term bonds, making them a useful buffer. They hold value during mild recessions, moderate inflation shifts, and periods where rates fluctuate without strong direction.
Their purpose is to provide consistent ballast so the portfolio doesn’t feel like a rollercoaster.
Commodities (such as oil, agricultural products, and industrial metals) are tightly linked to global supply and demand. When inflation rises, commodity prices often follow the same upward trend.
Modern analyses from the International Monetary Fund (IMF) show a strong historical correlation between inflation surprises and commodity price increases.
Including commodities helps prevent inflation from quietly eroding your real returns.
Gold behaves differently from traditional commodities. It’s influenced by:
During crises, gold often rises when stocks fall — making it a valuable diversifier. Analysis from the World Gold Council highlights its historical role in improving risk-adjusted returns when added to a diversified portfolio.
In an All-Weather context, gold protects against monetary instability and unexpected shocks.
The All-Weather portfolio became popular long before today’s concerns around:
You might wonder whether the strategy still holds up.
So far, it suggests that diversification across economic regimes remains effective, even in unpredictable global environments. Research from firms like BlackRock, Vanguard, and Bridgewater continues to support risk-parity-inspired structures (the foundation of All-Weather logic).
However, the modern market calls for slight adaptations, which we’ll cover shortly.
Market timing requires being right twice:
Very few investors consistently achieve that. Studies repeatedly show that most individual investors underperform the broader market because they react emotionally instead of strategically.
The All-Weather approach removes emotion. You’re not trying to guess what’s next, you’re building resilience so the “next” doesn’t break you.

While the classic version offers a good foundation, your modern adaptation should take into account:
Here’s how to construct a practical version:
Use the principles, not the exact percentages. Your goal is to spread across:
Think of it as a balancing act where no single piece dominates the portfolio.
ETFs make the All-Weather structure accessible. Look for:
Focus on low fees because the strategy already relies on holding long-term.
U.S. investors tend to use U.S. Treasuries; other countries can use their local sovereign bonds or global bond ETFs. Inflation dynamics also vary by region, so commodity exposure can play a slightly bigger or smaller role depending on your environment.
This is crucial. Rebalancing ensures:
It forces disciplined behavior without needing to predict anything.
Cash isn’t part of the traditional All-Weather structure, but it is part of real-life investing. Maintaining an emergency fund (typically 3–6 months of expenses) keeps you from liquidating assets during market downturns.
Resources from the Consumer Financial Protection Bureau (CFPB) reinforce the importance of cash buffers for long-term financial stability.
Some investors adapt the All-Weather idea with additional assets that didn’t exist or weren’t widely available decades ago:
They adjust with inflation, offering more targeted protection.
Examples include:
These offer additional diversification in some regions.
Low-volatility, value, or quality-focused funds can complement your equity exposure.
Global stocks have different economic drivers than U.S. only or region-specific stocks.
These enhancements are optional but can help fine-tune your all-weather structure for a more modern financial landscape.
It’s important to be realistic.
An All-Weather portfolio will not:
The goal is durability, not dominance. You trade some upside for far less downside, and for many investors, especially long-term planners, that trade-off is worth it.
You don’t need to be Ray Dalio to apply the principles of an All-Weather Portfolio. You just need an honest understanding of the cycles that drive the market and the humility to accept that nobody can predict them perfectly. Instead of betting on the right cycle, you prepare for all of them.
Economic patterns today move faster than they did decades ago. Information spreads instantly, central bank policies shift more frequently, and global supply chains adjust in real time.
If you build a balanced structure, rebalance consistently, and stay disciplined, your portfolio can survive inflation spikes, recessions, growth booms, and everything in between. Over time, consistency becomes your advantage.
The All-Weather philosophy absorbs shocks, adapts through balance, and removes the emotional guesswork that derails so many investors.

You could do all or some of the above and hope to right more times than you are wrong. Or you could have a dividend re-investment plan and check to see if the next and future dividends will be paid.
The S&P 500® is the major US stock market index. It tracks the 500 largest US companies. The S&P 500 index weights its constituents by free float market capitalisation.
ETF investors can benefit from price gains and dividends of the S&P 500 constituents. Currently, the S&P 500 index is tracked by 24 ETFs.
0.03% p.a. – 0.15% p.a.
annual total expense ratio
track the S&P 500®
+11.57%
return in GBP in 2025 per 30/11/2025

Renewable energy funds were hit hard by the government’s consultation on subsidy changes, but they have only themselves to blame for their failure to build trust with investors, says Bruce Packard

(Image credit: Getty Images)
By Bruce Packard
The UK renewable energy sector cannot catch a break. At the end of October, the government launched a consultation on changing the Renewables Obligation Certificate (ROC) scheme that subsidises some renewable-energy production. At present, the subsidies are linked to inflation using the retail price index (RPI) measure, but they may now be switched to the consumer price index (CPI). RPI usually rises faster than CPI (the gap varies, but one percentage point is a rough rule of thumb), and so this would mean that subsidies rise more slowly in future.
The government has proposed two options for this. One is to switch to CPI in 2026. The other is backdate the change to 2002 (when ROCs were introduced) by freezing the current price until a new “shadow price” linked to CPI since 2002 catches up with today’s RPI-linked price, and thereafter increase with CPI. Neither are good, but the latter option is clearly worse. Hence shares in listed renewable energy investment funds (REIFs) slumped further, having already been battered by a series of setbacks and problems in recent years.
The changes would have no direct impact on new investments – the ROC schemes closed to most new applications in 2017. However, existing wind and solar farms have been promised subsidy payments until 2037 in some cases, so the changes will affect their earnings. More broadly, making retrospective changes undermines the assumptions on which existing investments have been made. That will erode investors’ confidence in committing future capital.
Stay ahead of the curve with MoneyWeek magazine and enjoy the latest financial news and expert analysis, plus 58% off after your trial.

While the subsidies are ultimately paid by users as part of their energy bill, the change from indexing on RPI to using CPI is likely to mean a minimal reduction in the average household bill. At the same time, it will probably raise the cost of capital for future projects, making it ultimately self-defeating, argue infrastructure funds. Certainly, one has to feel that the government’s Clean Power 2030 (CP30) plan – which assumes £40 billion of private investment a year in green energy between now and 2030 – now seems wildly optimistic.
The direct impact of the change on listed REIFs will depend on which option is chosen (and on how much ROCs contribute to their income – typically 40%-50%). For many investors, this may feel like the final straw – yet more evidence that the sector is both unlucky and dysfunctional. While the government is clearly to blame for this particular shock, the way that the REIF sector has developed in recent years hasn’t encouraged investors to give it the benefit of the doubt. One can’t treat all REIFs as exactly the same and I’m going to focus largely on the solar funds here, but many of the problems apply more widely.
Bluefield Solar Income Fund (LSE: BSIF), Foresight Solar Fund (LSE: FSFL) and NextEnergy Solar Fund (LSE: NESF) put out statements saying that the impact on net asset value (NAV) would be around 2%, 1.6% and 2% respectively under option one and 10%, 10.2% and 9% under option two. This sounds manageable. However, we immediately get onto the question of how much investors trust these reported NAVs, which are based on fair value accounting and “mark to model” assumptions. The fact that most REIFs trade on 30%-40% discounts to NAV implies some scepticism about these valuations, while the fact that dividend yields are in the 10%-15% range suggests some concerns about their sustainability.
The original sin in the REIF model is that it was built around being able consistently to issue shares at premiums to NAV to fund new projects. REIFs were marketed as a growing income story in a low-yield world, with the added bonus of a green angle during the economic, social and governance (ESG) boom. Yet they were always paying out cash with one hand while taking it in with the other (hence NESF’s shares outstanding have doubled from 278 million 10 years ago to 555 million currently). This model only worked when the shares traded at a premium to NAV – now that they don’t, the REIFs no longer have access to cheap equity. Debt is no longer cheap either. It might make sense to cut dividends and reinvest the cash, but that would alienate investors who bought for income.
While this explains their growth problem, the opaqueness of returns explains why many investors are wary of them even as a limited-life income asset. In theory, the NAV represents the current value of future expected cash flows. The focus on this – and on paying steady dividends – makes it look as if REIFs have very simple, predictable economics. Reality is more complicated. Projected revenues depend on power price forecasts that come from third-party forecasters. When these change, so do NAVs. Meanwhile, actual performance has plenty of real-world complications.
For solar, there’s the amount of sun that falls on the panels. There’s whether it all gets used or whether grid outages means some gets wasted (FSFL had UK production 8.9% above budget in the first half, but would have been 13% higher without outages). On sunny summer days, there will be points when a surplus of solar power floods the system and sets the marginal price (at extremes the unsubsidised price can even go negative). Hence the “capture price” that solar farms get can sometimes be less the base load price (the price for steady, always-on power) – this summer, capture rates have frequently dropped to 80%. And if the grid physically can’t cope with the power being supplied, producers may be curtailed (turned off) by the system operator, meaning lost revenue.
Since the REIFs’ lenders and shareholders prioritise stability, the managers fix prices for much of their output in advance with power purchase agreements (PPAs). However, this means that they don’t capture much upside from spikes in spot prices (driven by higher gas prices, which set the marginal UK power price most of the time). All these factors come together in a bewildering series of assumptions. To take just one example, NESF’s short-term power price assumptions have fallen 56% from £139 per megawatt hour (MWh) in September 2022 to £61/MWh in September 2025. Longer-term power price assumption has risen 22% over the same three-year period. Yet its 20-year average price forecast has halved since it floated in 2014, pointing to long-term downward pressure.
What is the result of trying to distil such complexity into a single NAV that constantly changes? It is doubt about whether management are trying to mask poor economics with financial engineering, unconsolidated statements, fair value accounting and unverified assumptions. The accounting might technically be correct, but it is opaque and hard to compare between funds. Each time forecasts prove too optimistic and NAVs get downgraded, scepticism grows. This is why the REIFs now trade at huge discounts to NAV. (Policy risk – as demonstrated by the government’s proposed ROC change – may be another factor.)
Most of the REIFs seem to have little idea of how to get investors to trust them. They have tried to address the discount to NAV with share buyback programmes, but these have been too insignificant to counter the wave of selling. What’s more, buybacks often increase leverage: in May this year, NESF had to pause its buyback as leverage would have increased beyond its 50% debt-to-gross asset value policy limit. Rising debt is exactly what nervous investors don’t want to see.
Many have tried to sell assets, which would raise cash to pay down debt and fund buybacks while also validating NAV through real-world selling prices. This process has been slow, suggesting it may be hard to achieve prices respectably close to NAV. For example, in April 2023 NESF said it would sell 246MW of UK subsidy-free solar capacity across five separate projects. At present, there are still two project with 100MW yet to be sold. Last year, FSFL said it would sell its Australian portfolio (170MW across four sites), but the process has now been paused. A small number of bids for the portfolio were received, but none were deemed deliverable. In March this year, it earmarked a further 75MW for sale, with no results so far.
More recently, Bluefield proposed merging with its manager to focus on developing a 1.4GW pipeline of projects. However, that model implied a cut to the dividend and was quickly rejected by shareholders (if they were sceptical about the potential returns on capital, it is not surprising given the sector’s record). The fund was forced to ditch this and put itself up for sale. This has not steadied the decline in the share price, which has fallen to new lows below 70p, with a yield of 13% and a discount to NAV of 39%.
Until now, REIFs that have faced continuation votes have largely won them despite these woes – probably because investors are sceptical that they can sell their assets, pay back the debt and achieve a decent return for shareholders. This detente may be changing as investors get more anxious. The chairs of NESF, FSFL and BSIF have all stepped down in the past year and new brooms may be minded to sweep clean.
We could be reaching the point of maximum pessimism, as seems to have happened with battery funds. I have a position in NESF, bought on the basis that the dividend could well be cut, but that much of the bad news was already in the price with a yield in the mid-teens. Still, if the REIFs’ accounts clearly told us how much cash is being generated per pound invested per MW and whether it is declining, it would be much easier for investors to decide whether they still want to back these “sustainable” investments.
The current fcast quarterly dividends for the Snowball are £2,383.00.
To be added to the to the total is around £40.00 a quarter from cash to be re-invested this year and the cash buffer to be received in January. There will be a cash return, hopefully, from VPC next year, for re-investment but as it’s a known unknown its not included in the total.

As always some dividends may be cut, some dividends may be increased and as the dividends are earned and the cash re-invested it should provide more dividends to be used as a contingency for the Snowball’s 10k total.

© 2026 Passive Income Live
Theme by Anders Noren — Up ↑