BlackRock Energy & Resources Inc Trust PLC ex-dividend date British Land Company PLC ex-dividend date Caledonia Investments PLC ex-dividend date Cordiant Digital Infrastructure Ltd ex-dividend date Foresight Environmental Infrastructure Ltd ex-dividend date GCP Asset Backed Income Fund Ltd ex-dividend date Montanaro European Smaller Cos Trust PLC ex-dividend date Riverstone Credit Opportunities Income PLC ex-dividend date US Solar Fund PLC ex-dividend date Utilico Emerging Markets Trust PLC ex-dividend date VH Global Energy Infrastructure PLC ex-dividend date
Disclosure – Non-Independent Marketing Communication
This is a non-independent marketing communication commissioned by Sequoia Economic Infrastructure Income (SEQI). The report has not been prepared in accordance with legal requirements designed to promote the independence of investment research and is not subject to any prohibition on the dealing ahead of the dissemination of investment research.
Sequoia Economic Infrastructure Income (SEQI) has reported strong results for the half year ending 30/09/2025. The NAV total return when annualised was 10.1%, well in excess of the targeted gross portfolio return of 8-9%.
The NAV per share itself was up 1.2% to 93.67p, and dividends of 3.44p were paid or declared, consistent with the full year target of 6.875p. These dividends are fully cash covered and as of 27/11/2025 the prospective yield on the shares was 8.6%. Meanwhile, there is pull-to-par upside of 3.1p per share within the current portfolio valuation.
Share price total returns were 7.7%; despite dividends delivering a high share price yield, the price itself fell slightly from 78.3p to 77.9p as the discount widened from 15.4% to 16.8%.
The management team have continued to invest in new loans at highly attractive rates, recycling £213m into new investments at a weighted average yield-to-maturity of 8.9%.
One shift has been to reduce the weighting to the US in the light of policy uncertainty on renewables and tariffs. New loans have been made in the EU and the UK instead. Meanwhile, exposure to data centres has come down as the team react to weakening covenants in a crowded trade and look to reallocate to areas more attractive on a risk/reward basis.
Kepler View
Sequoia Economic Infrastructure Income’s (SEQI) portfolio of conservatively managed infrastructure loans looks like an attractive source of yield in the current environment. With economic risks front and centre, we think a portfolio mostly invested in senior secured loans (57%) and in non-cyclical but economically-vital sectors looks likely to prove resilient. Looking forward, the huge demand for infrastructure in a low growth world is not currently being satisfied by the supply of capital, creating a strong technical picture for an investment via a specialist-managed portfolio with the scale to participate in large projects while being highly diversified across assets, industries and themes.
We think the portfolio is benefitting from the relatively short maturity of the loans the team make, with the current weighted average life being just 3.2 years. Lending at shorter maturities has allowed agility in portfolio positioning. As well as the geographical move from the US to Europe, it has facilitated first entry into the data centre market, and more recently a dialling back of exposure as investors crowd in. The team highlight the weakening of covenants as the key to their decision to reduce exposure to data centres during the AI craze, which speaks to the defensiveness of approach which we think should appeal to income investors looking to invest in the private debt markets.
At the end of the year, the trust held £84.9m in cash and had drawn down just £33.2m of its revolving credit facility of £300m. The team thus have plenty of liquidity and it is worth noting that the high yield of 8.6% is being delivered without the structural use of gearing, in contrast to many other high-yield options in the closed-ended fund space. The average yield-to-maturity of 8.9% on new loans during the year is in line with the targeted gross portfolio return of 8-9%, although it is slightly down on the current overall portfolio yield of 9.7% (itself down marginally from 9.9% at 31/03/2025). Falling base rates present a challenge, but with a high proportion of investments fixed rate or hedged and the team reporting spreads remaining at healthy levels, the outlook for the dividend looks stable to us, particularly when considering the uninvested cash and gearing, and the spend on buybacks which could be redirected.
For new investors we think the 16% discount adds to the attractions, boosting the dividend yield and providing scope for a capital return over time on top of the pull-to-par effect in the NAV which is expected to deliver a gain to NAV of 3.1p by 2028.
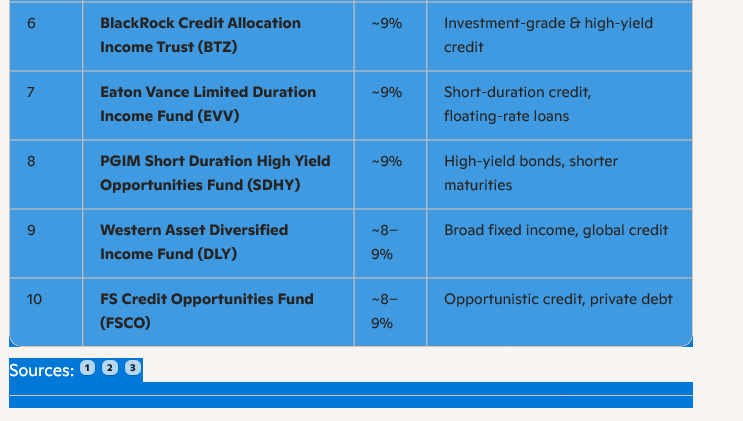
FSCO (12.8% yield, –11.8% discount) and DLY (9.7% yield, –8.1% discount) stand out as “fallen giants”—offering strong income but trading at steep discounts, reflecting investor caution.
Premium pricing:
PTY (10.7% yield, +11.8% premium) and PDI (14.7% yield, +6.4% premium) show investors are willing to pay above NAV for PIMCO’s reputation and aggressive credit strategies.
Moderate yield, near parity:
FOF (8.1% yield, +1.1% premium) and NZF (7.7% yield, –2.5% discount) hover close to NAV, suggesting balanced sentiment.
Discounted but steady:
BTZ (9.2% yield, –3.6% discount) and EVV (8.7% yield, –3.6% discount) provide solid yields with modest discounts, appealing to value‑oriented investors.
Short duration caution:
SDHY (7.9% yield, –7.1% discount) reflects investor skepticism about short‑duration high‑yield bonds in the current rate environment.
🔑
Premium funds like PTY/PDI are the “heroes on pedestals,” commanding loyalty despite risks.
Discounted funds like FSCO/DLY are “fallen banners,” offering rich income but trading below their worth, embodying resilience under doubt.
Middle‑ground funds (FOF, NZF, BTZ, EVV) are the “steady beams,” neither exalted nor shunned, symbolizing cautious balance.
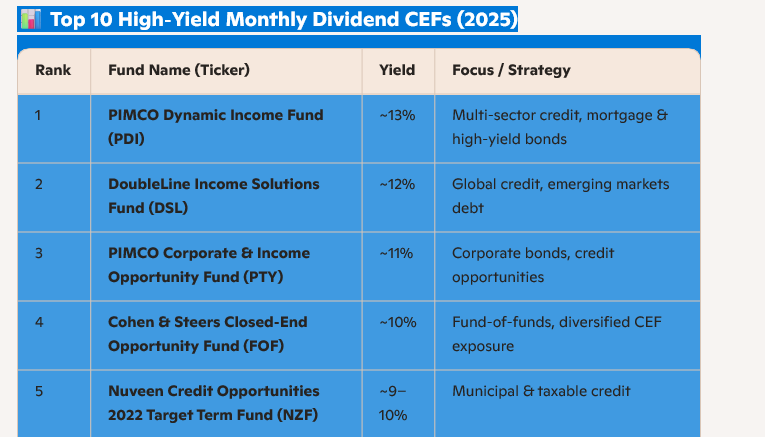
Here are ten of the highest-yielding closed‑end funds (CEFs) that currently pay monthly dividends in 2025. These stand out for their double‑digit yields and steady income focus.
📊 Top 10 High‑Yield Monthly Dividend CEFs (2025)
Sources:
🔑 Key Takeaways
Yields range from ~8% to 13%, far above typical ETFs or mutual funds.
Monthly payouts make these attractive for retirees or anyone seeking regular cash flow.
Credit‑heavy portfolios (PIMCO, DoubleLine, Nuveen, BlackRock) dominate the list, meaning performance is sensitive to interest rates and credit spreads.
Diversification options exist: FOF spreads risk across many CEFs, while DLY and EVV balance duration and sector exposure.
Risks: High yields often mean leverage, exposure to distressed credit, and potential NAV erosion. Discounts/premiums to NAV can swing sharply.
⚖️ How to Use This List
Think of these funds as income engines rather than growth vehicles. For your metaphorical work on institutional cycles, they embody the “Dividend Hero” archetype: resilient monthly cash flow, but often at the cost of volatility and leverage risk.
This list is AI generated and may be quoting outdated information.
On the bright side of the phone ledger, we have no landline. The cell bill is it. But don’t fall asleep, bank account. All the other cord cutting exacts its pound of flesh!
For example, we “cut the cable cord” years ago. And replaced it with an equally pricey version, albeit a wireless one!
YouTube TV has a base plan of $82.99. However, my monthly tab will be $131.95 plus tax.
How’d I manage a 50%+ premium? By demanding sports in 4K (+$9.99/month). And refusing to live a Sunday in the fall without NFL RedZone and its 6+ hours of live look-ins across football games (+$10.99/month).
Oh, and the WNBA season ticket that I watch with my daughters during the summer.
But the big one, the mortgage payment, dwarfs all. And oh yes, automatically deducted from our account on the first of each month.
“Just” eleven years to go on the mortgage! We shortened to 15-years when we refi’d in 2021. My “basketball dad” car is paid off (2019 Acura MDX) and, while motivated to drive it “into the ground,” the odds are this car won’t be my last.
So the big monthly payment wheel keeps on spinning. I am sure you can relate to a few of these regular drains in your own life.
For which we have a solution: plug these monthly drains with monthly dividends.
But you observe, “Brett! You said only 6% pay monthly. How can I find them?”
Glad you asked! Our Contrarian Income Report has a “virtual monopoly” on the sector. We have 19 monthly payers yielding an average 9.1%. Think about that. A million bucks in the CIR monthly payer lineup generates $7,583.33 per month in passive income.
Plus, the original million invested in these “elite 19” stays intact. Or better yet, grinds higher! Since inception 10 years ago, our entire CIR portfolio has generated 9.6% in annual returns. And that’s mostly paid in cash dividends, with the majority dishing monthly.
Our CIR monthly dividend GOAT (greatest of all time) is DoubleLine Income Solutions Fund (DSL). In April 2016, we added DSL to the CIR portfolio at a price of $16.99 per share.
Since then we have collected 115 monthly dividends that have totaled $15.71. That’s 92% of our initial buy price in payouts. It’s almost house money now!
Imagine investing in a simple fund that trades just like any blue-chip stock—and earning your entire investment back within 10 years via monthly dividends. With the regular payout stream still rolling strong!
And DSL is not a mere annuity. It’s way better. DSL is a bond fund run by the “bond god” himself Jeffrey Gundlach. The modern-day deity of fixed-income investing scours the globe to collect deals that power DSL’s monthly 11-cent divvie.
11 Cents on the Month, Every Month
DSL yields 11.8% today. Investors with $100,000 invested in DSL shares enjoy $11,800 per year in passive dividend income. That’s $983.33 in monthly deposits and—oh!—that’s right: it’s autopay, but to you!
Enough to pay Verizon, YouTube TV and internet while heating the house—with extra cash left over for a nice dinner!
And a $50,000 stake in DSL delivers $491.66 in monthly payouts. That’s still meaningful income to cover those every-30-day expenses.
Now, I wouldn’t pile everything into DSL today, when savvy investors can spread risk among 18 more solid monthly payers that deliver a green cash river too. This is diversification without di-worseification (thank you, Peter Lynch!). We want to retire on dividends, and the best way is to bulletproof our payout streams across asset classes, sectors and national borders.
And that’s our elite 19!
We are not hanging on the Federal Reserve’s next word. Nor are we glued to policymaker decisions. We are insulated from this noise by assembling an elite 9.1% paying portfolio of monthly dividend payers.
If this monthly dividend discussion sparked an “ah ha!” moment for you, well, welcome! Wall Street has been feeding you the equivalent of “junk food” financial advice your entire life.
The 4% withdrawal rule? C’mon man.
None of the vanilla maxims generate passive income. Annually, monthly or quarterly!
It’s time to clean up the financial diet. Trim down the “buy and hope” desperation and beef up the dividends.
Mastercard (MA) is a near-perfect dividend stock. Its payout is always climbing, having nearly doubled over the last five years. (MA shareholders, you can thank every business that accepts Mastercard for your “pennies on every dollar” rake.)
Tap, tap, tap. Remember cash? Me neither. Another 2020 casualty, with Mastercard making a few dimes or dollars on every plastic transaction.
The cashless trend has been in motion for years. But international growth prospects remain huge. Just a few years ago, 80%+ of transactions in Spain, Italy and even tech-savvy Japan were in cash.
We expect more dividend hikes as more cash turns to plastic. Or skips plastic entirely and goes straight to e-transfers. Mastercard and close cousin Visa (V) nab a nice piece of that action, too.
The only chink in MA’s armor? Everyone knows it is a dynamic dividend stock. So it only yields 0.5%. Investors keep bidding it higher, knowing that the next dividend raise is just around the corner.
So, the compounding of those hikes makes MA a great stock for our kids and grandkids. You and I, however, don’t have the time to wait for 0.5% to grow. And $2,500 on a $500K investment simply won’t get it done.
Let’s instead consider top-notch closed-end fund (CEF) Gabelli Dividend & Income Trust (GDV), managed by legendary value investor Mario Gabelli.
Mastercard is one of Gabelli’s largest holdings. But we income investors would prefer GDV because it boasts a healthy dividend right around 6.4%, paid monthly, nearly 13 times what Mastercard pays (and this is low in CEF-land; other funds, like the next one we’ll talk about, pay nearly double that).
And as I write this, thanks to the conservative folks who buy CEFs, we have a rare opportunity to buy Mario’s portfolio for just 89 cents on the dollar.
Yup, GDV trades at an 11% discount to its net asset value, or NAV. It’s a way to boost MA’s payout and snag a discount, too.
Where does this discount come from?
CEFs are like their mutual fund cousins, with one exception: they have fixed pools of shares, so they can (and do) trade higher and lower than their NAVs, or “fair” values (the value of their holdings minus any debt).
As contrarians, we can step in when they are temporarily out of favor, like after a pullback, when liquidity is low, and buy them at generous discounts.
GDV holds more blue-chip dividend payers alongside MA, such as American Express (AXP), Microsoft (MSFT) and JPMorgan Chase & Co. (JPM). And with GDV, we have an opportunity to purchase them at an 11% discount.
Hi fantastic blog! Does running a blog like this require a massive amount work? I have no understanding of coding but I was hoping to start my own blog in the near future. Anyhow, should you have any suggestions or techniques for new blog owners please share. I know this is off subject but I simply had to ask. Thanks a lot!
No coding experience necessary, if you can copy and paste you are good to go.
You will need to moderate all commentS.
I use Word Press thru Fast Hosts, there are modest costs involved.
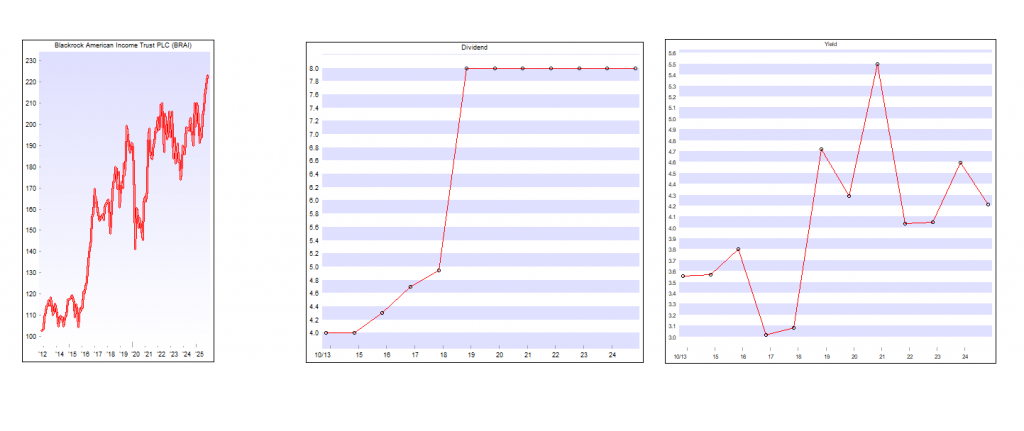
Earlier this year, BlackRock American Income (BRAI) announced a radical shake up. It asked shareholders to approve a new investment objective and policy, announced a new enhanced dividend policy, cut management fees drastically, and offered shareholders a 20% tender at a 2% discount to NAV (after costs).
The proposals were welcomed by investors, with more than 99% of those voting giving their approval. The tender offer was undersubscribed, with just 16.15% of BRAI’s shares validly tendered.
In its new form, the trust is following an investment approach distinct from any other investment company listed in the UK – investing using a systematic active equity approach devised by BlackRock (which uses data-driven insights to identify and take advantage of mispriced stocks). This note seeks to explain BRAI’s new approach and the corporate structure that supports that. Whilst we have included some historical performance data for reference in the charts on this page, further analysis of it feels redundant. Instead, we have focused on BRAI’s returns since the strategy change.
The portfolio continues to focus on income and capital growth from US value stocks, offering diversification for investors mainly exposed to large US tech stocks. There has been a major change in how investments are chosen, detailed further below.
Attractive income and growth from US value stocks, using a systematic active equity approach
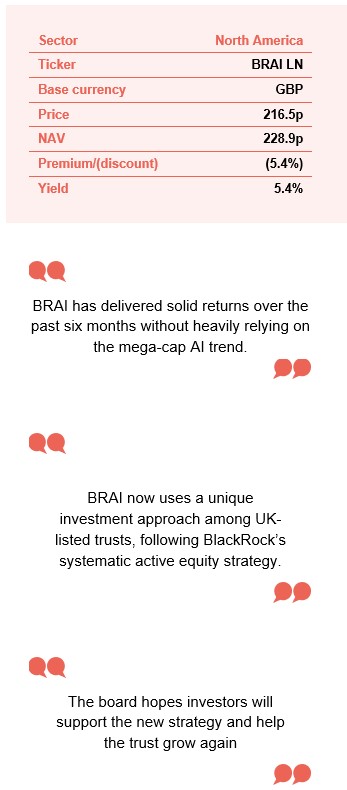
BRAI aims to provide long-term capital growth, whilst paying an attractive level of income (1.5% of NAV per quarter, around 6% of NAV per annum). BRAI follows a systematic active equity approach that aims to provide consistent outperformance of the Russell 1000 Value Index (the benchmark).
At a glance
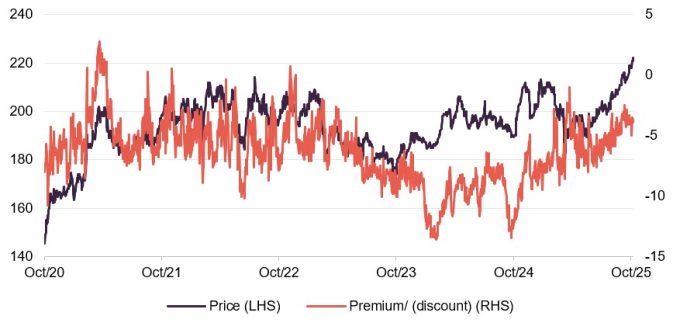
Share price and discount
Over the 12 months to 31 October 2025, BRAI’s shares traded at a discount to NAV ranging from 11.9% to 1.0%, averaging 6.3%. As of 26 November 2025, the discount stood at 5.4%.
The discount increased during 2023 as markets were led by the Magnificent Seven and value stocks lagged. BRAI’s rating started to recover in October, helped by the expected tender offer, and is now at a more reasonable level. The board hopes investors will support the new strategy and help the trust grow again.
Time period 31 October 2020 to 25 November 2025
Source: Bloomberg, Marten & Co
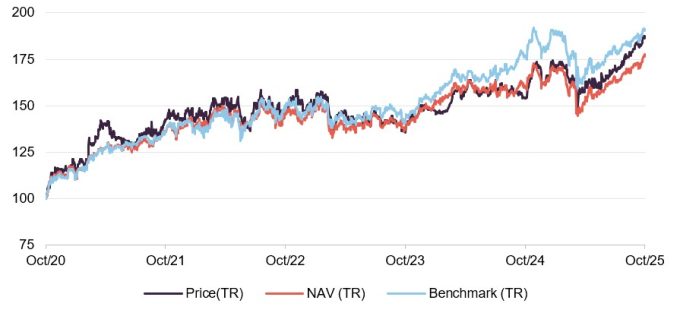
Performance over five years
As mentioned earlier, we do not consider BRAI’s returns before the strategy change relevant, however the graph here shows BRAI’s share price and NAV performance compared to its benchmark over the past five years. Figure 7 on page 9 illustrates BRAI’s strong start, regularly outperforming its objective. The S&P 500’s gains have been driven by a few large AI-related companies, while BRAI’s benchmark is more diversified. Notably, BRAI has delivered solid returns over the past six months without heavily relying on the mega-cap AI trend.
Time period 31 October 2020 to 31 October 2025
Source: Bloomberg, Marten & Co
More information is available on the trust’s website
How does new BRAI differ from old BRAI?
The portfolio continues to focus on income and capital growth from US value stocks, offering diversification for investors mainly exposed to large US tech stocks. There has been a major change in how investments are chosen, detailed further below.
The largest holding in any single stock is now capped at 1.5%. The number of stocks has increased from around 60 to 232 as of September 2025, reducing risk from individual companies.
Previously, the investment policy excluded some stocks for ESG reasons, but the new approach allows for a broader range of investments.
Costs have been significantly reduced, with the base management fee halved and a new tiered structure introduced (see page 11). Dividends have also increased to 1.5% per quarter, or about 6% a year (see page 9).
Regular exit opportunities linked to performance have been introduced, and investors will also have an exit option if the trust does not grow (see page 10).
What is systematic active equity?
Data-derived insights to spot mispriced stocks
BlackRock’s Systematic Active Equity (SAE) team uses data-driven insights to identify and take advantage of mispriced stocks. By September 2025, BlackRock managed over $313bn with this strategy across a range of global and regional portfolios, including long-only, partial short, hedge funds, and a London-listed investment company – the first of its kind. The SAE team has over 100 investment professionals in San Francisco and London, drawing on more than 40 years of experience in active investment management. While BRAI’s investment universe is no longer limited by ESG criteria, ESG analysis remains part of the research process.
BRAI’s universe is no longer constrained by ESG criteria
Continuous innovation
The SAE team is constantly innovating to improve results for investors. While quant-driven strategies have existed for years, managers now have access to much more data. Their role is to decide which information is useful, when to use it, how different datasets work together or during specific economic periods, and how much weight to give each insight when making investment decisions.
Few asset managers have the scale to succeed in this area
The SAE team was an early adopter of AI and machine learning
Processing this information requires significant computing power, which only a few asset managers can access at scale. The managers note that while early fundamental value data was structured and easy to analyse, most current datasets are unstructured text. The SAE team adopted AI and machine learning early to interpret this data effectively.
Beyond traditional company analysis, the SAE team uses hundreds of independent data sets, such as analyst reports, news articles, online search trends, transaction volumes, footfall, and app usage. On average, they assess 10 new data sets each month. Macroeconomic indicators are also included, using “now-casting” to gauge the economy’s current state.
Insights are thoroughly tested for their ability to predict company fundamentals and returns, with tools that can run a five-year back test in under two seconds. Managers retain final decision-making, and may delay trades during major market shocks.
The SAE approach leads to higher portfolio turnover (about 100%–200% per year), but trading costs are considered in every decision. Many trades are matched within BlackRock, helping to keep transaction costs down.
The output
The analysis covers:
Company fundamentals, including profitability, growth, financial strength, valuation, and management quality.
Market sentiment, considering analyst and investor views, management outlook, and investment flows. It also looks at whether the wider market environment and similar businesses support the stock.
Macroeconomic themes across industries, countries, and investment styles.
ESG risks, including how a business is exposed and what steps it is taking to manage them, how companies treat their staff, customers, and suppliers, and whether they face risks from the move to a carbon-neutral world.
The managers use a set of signals to score each stock, blending these scores to form an overall view. Stocks with higher scores are expected to deliver better returns, guiding the portfolio’s construction to balance risk and return after costs.
The portfolio usually holds 150 to 250 large- and mid-cap stocks. While BRAI can invest up to 20% of assets outside the US, it is now likely to be fully invested in US equities.
The macroeconomic backdrop
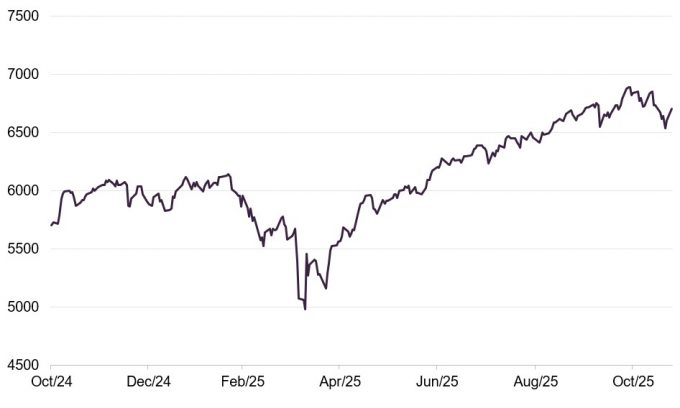
Markets have recovered from the selloff associated with Liberation Day
President Trump’s policy agenda, especially his tariff policy, has had a major impact on global markets. After quickly imposing tariffs on imports from Canada and Mexico, the key moment came on “Liberation Day” (2 April 2025) when tariffs were announced on almost all imports. Markets reacted negatively, prompting a temporary reduction of most tariffs to 10%. This led to a market recovery, helped by announcements of various trade deals, though not all are finalised, which encouraged a return to risk-taking.
The AI investment boom, which started in March 2023 with ChatGPT-4, faced its first major challenge in January 2025 when DeepSeek claimed to have developed a new large language model at much lower cost than US rivals. This caused a sharp sell-off in the Magnificent Seven tech stocks, with money moving into other US stocks and overseas markets. These large US tech companies were also affected by the Liberation Day market falls. Despite this, investment in AI infrastructure continued strongly, helping to restore confidence.
Today, US mega-cap tech stocks once again lead the S&P 500. For investors who want US exposure but prefer not to concentrate too heavily on these giants, BRAI offers useful diversification.
BRAI offers a way of diversifying US exposure away from the Mag 7
Figure 1: S&P 500 Index over 12 months to end October 2025