Source: interactive investor. Performance data to 3 November 2025. Note: the top 10 is based on the number of “buys” during the month of October. Past performance is not a guide to future performance.
Source: FE Analytics. Performance data to 31 October 2025. Note: the top 10 is based on the number of “buys” during the month of October. Past performance is not a guide to future performance.
The Snowball booked a profit of £907.80 with TRIG.
The Snowball only owned the share for one week, sometimes it’s better to be lucky than clever. The intention is to use ‘part’ of the windfall to do some dividend washing, where you buy a share before the xd date and sell either on the day or later, to provide contingency income for 2026, just in case any dividends are cut.
So the Snowball has sold LAND, earning a dividend of £307.00 paid in January, for a loss of £13.00. If you get the timing right, sometimes it can also print a tiny profit.
There are dividends to be received tomorrow of £641.00, 1k to be re-invested in FSFL, maybe.
Among those set to exit the FTSE 250 is Pinewood Technologies Group PLC, rounding off a short stint in the mid-cap index. The provider of software to the automotive retailing sector replaced Warehouse REIT in the index after the logistics warehouses investor was acquired by Blackstone Inc.
Among those set to exit the FTSE 250 is Pinewood Technologies Group PLC, rounding off a short stint in the mid-cap index. The provider of software to the automotive retailing sector replaced Warehouse REIT in the index after the logistics warehouses investor was acquired by Blackstone Inc.
Foresight Solar Fund Ltd, an investor in environmental infrastructure, is also set for relegation.
Real Estate Credit Investments Limited (the “Company”)
Ordinary Dividend for RECI LN (Ordinary shares)
Real Estate Credit Investments Limited announces today that it has declared a second dividend of 3.0 pence per Ordinary Share for the year ending 31 March 2026. The dividend is to be paid on 02 January 2026 to Ordinary Shareholders on the register at the close of business on 05 December 2025. The ex-dividend date is 04 December 2025.
My 2 favourite growth stocks just plunged 25% in a month – time to consider buying more?
Harvey Jones made a big bet on these 2 FTSE 100 growth stocks, but the last month has been brutal. So does he sell, hold or steel himself to buy more?
Posted by Harvey Jones
Published 26 November
Image source: Getty Images
You’re reading a free article with opinions that may differ from The Motley Fool’s Premium Investing Services.
My top two growth stocks have just taken a beating, and I won’t deny it hurts. Both plunged 25% in the last month and are the biggest fallers on the FTSE 100 over that short period. So what do I do?
The first is the private equity and infrastructure specialist 3i Group (LSE: III). Until recently, it was one of my standout investments, more than doubling my money in the two-and-a-bit years after I added it to my SIPP.
Should you buy 3i Group plc shares today?
3i Group shares slump
Since 1945, 3i has built a strong track record of buying underperforming companies, scrubbing them up and selling at a profit. It worked wonders for decades. The shares are still up 200% over five years, but now they’re down 11% over 12 months. Personally, I’m still up 48%, but that’s less than it was.
I was starting to feel uneasy about 3i. Much of the excitement came from one stunningly successful holding, European retailer Action. It’s opened thousands of stores across the continent and has a new growth market in Switzerland, but now accounts for almost three-quarters of 3i’s total assets. That is a lot of concentration risk.
On 13 October the group warned sales growth at Action may fall short of forecasts due to a slowdown in France. The rest of the business is trading well but that was all it took to spark a heavy sell-off.
I have no plans to sell 3i Group. I buy shares with a long-term view and over that time frame, it remains attractive. In fact, I topped up my position last week, and two senior directors did the same, investing far bigger sums than me. I’m now heavily exposed by my modest standards, so I’ll stop here. Action’s monster growth has to slow at some point and the group needs to find new opportunities. Yet I still think it’s worth considering for long-sighted investors.
JD Sports has tripped up
My second falling favourite was struggling rather than thriving when I bought it in January 2024. JD Sports Fashion (LSE: JD.) looked absurdly cheap with a price-to-earnings ratio of around 7.5, and I expected to benefit from a robut share price recovery once trading improved.
The rebound hasn’t come yet. Consumers are still under severe strain across the UK, Europe and the US. On 20 November the board issued another profit warning, blaming rising unemployment and softer spending. Should I take advantage and buy more?
I’ve already averaged down on three occasions since my original purchase, but now I’m wary. JD Sports’ core market is younger people, which spells trouble as youth unemployment climbs. Rapid advances in artificial intelligence may hurt their long-term job prospects and squeeze their spending power harder.
The JD Sports share price is even cheaper now. The P/E stands at 5.95 but a strong Christmas sales period could lift the mood. Contrarian investors may still consider the stock but I’ve decided to hold my position and look elsewhere for recovery plays.
Both growth stocks face different challenges but remain central to my long-term plan. I believe the 3i dip is a great long-term buying opportunity for a share that had outrun itself, which is why I dived in. JD Sports should recover one day but for now I’m sticking rather than twisting.
3i : very dangerous to buy Trusts that trade at a big premium.
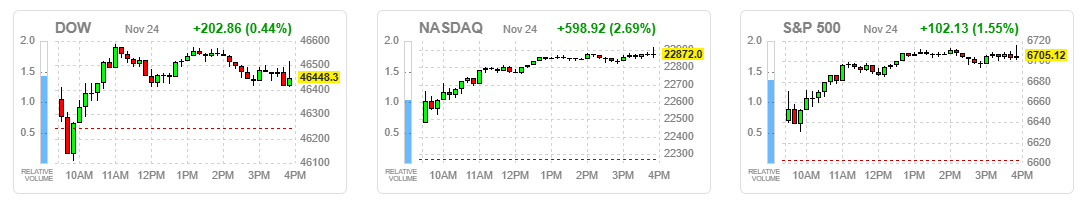
Stocks surged broadly, led by tech, as nine of eleven S&P 500 sectors rose and the Nasdaq posted its best day since May.
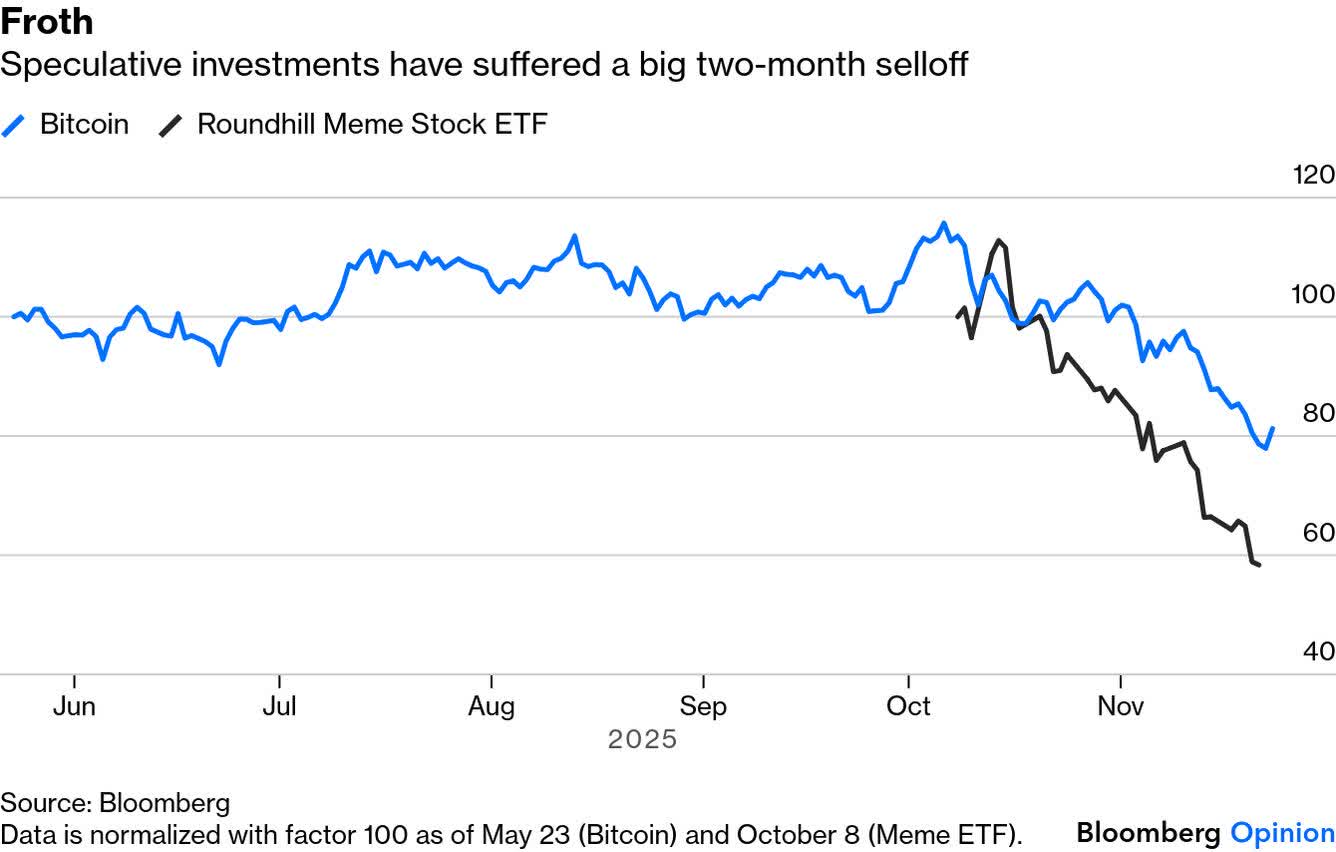
Bitcoin’s rally signaled speculative excess has been reduced, setting the stage for a potential year-end stock market rally.
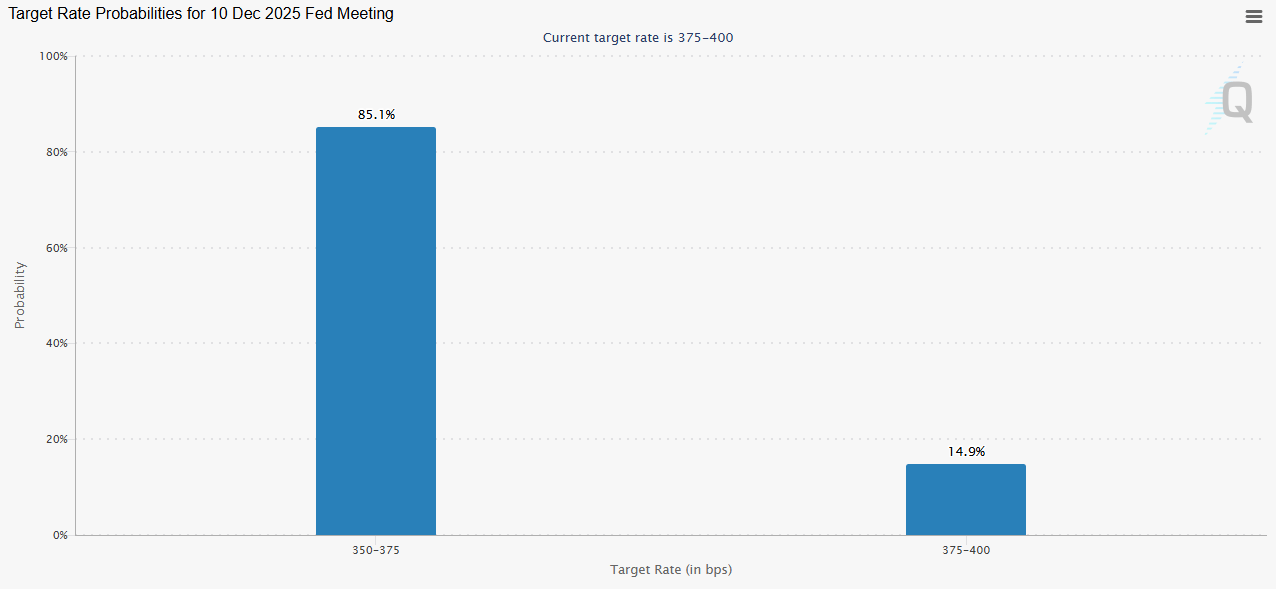
Fed officials’ dovish comments increased expectations for a December rate cut, now seen as 85% likely, supporting further market gains.
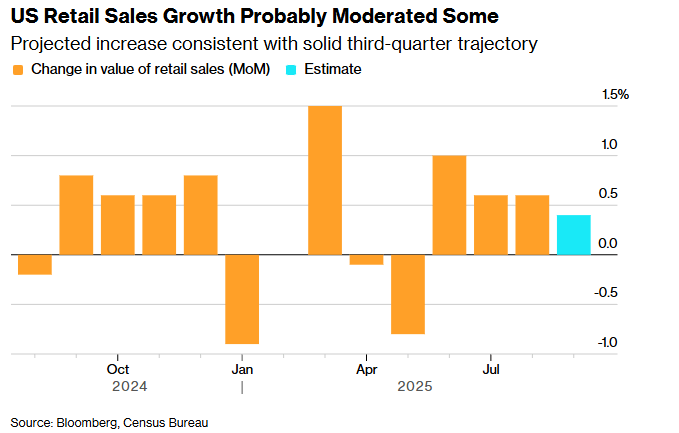
Despite labor market concerns, strong consumer spending and falling inflation expectations point to a soft economic landing and renewed growth in 2026.
DNY59/E+ via Getty Images
Investors returned in force yesterday to buy stocks, led by the beaten up technology sector, but it wasn’t just tech, as nine out of 11 sectors that constitute the S&P 500 index rose. The Nasdaq Composite had its best day since May. It is no coincidence that Bitcoin rallied off its recent low of approximately $80,000 to surpass $88,000, prior to the burst in stock prices, along with the rest of the cryptocurrency space. That tells me that we have wrung out a lot of the speculative excess in this market, which sets the stage for the year-end rally.
Finviz
The selling in crypto land exacerbated the selling in magnificent ones, which collectively soared 3.2% yesterday, led by Alphabet. I am less sanguine about a near-term recovery in these seven names to new all-time highs as I am expecting a broadening of the participation we have seen since the April lows. I think this will be instigated by productivity increases for the 493 companies in the S&P 500, which are just starting to realize the benefits from AI. That should override valuation concerns for the broad market, as higher profit margins support higher valuations for the names left behind in this bull market. This will be the story of 2026 that leads to the next leg up.
Bloomberg
Friday’s rally was instigated by comments from New York Fed President John Williams who sees a rate cut in December as more likely than not. We had further confirmation that another rate cut is coming yesterday from San Francisco Fed President Mary Daly, who indicated that labor market weakness is a higher priority than the rate of inflation right now. Then Boston Fed Governor Christopher Wall repeated that he would like to see the rate lowered at the December 10 meeting. The probability for a rate cut has now risen to 85%.
CME
There are increasing concerns about the weak labor market, which is understandable. This is a risk that should not be ignored. But most investors don’t recognize that the number of jobs created does not go into the calculation for the rate of economic growth, nor is it the primary driving force behind consumer spending, which is the most important input to growth. We will finally have the retail sales number for September this morning, and I suspect it will show that consumers are still spending at a healthy clip, which makes me less concerned about the labor market. Spending is the primary driver of job creation.
Bloomberg
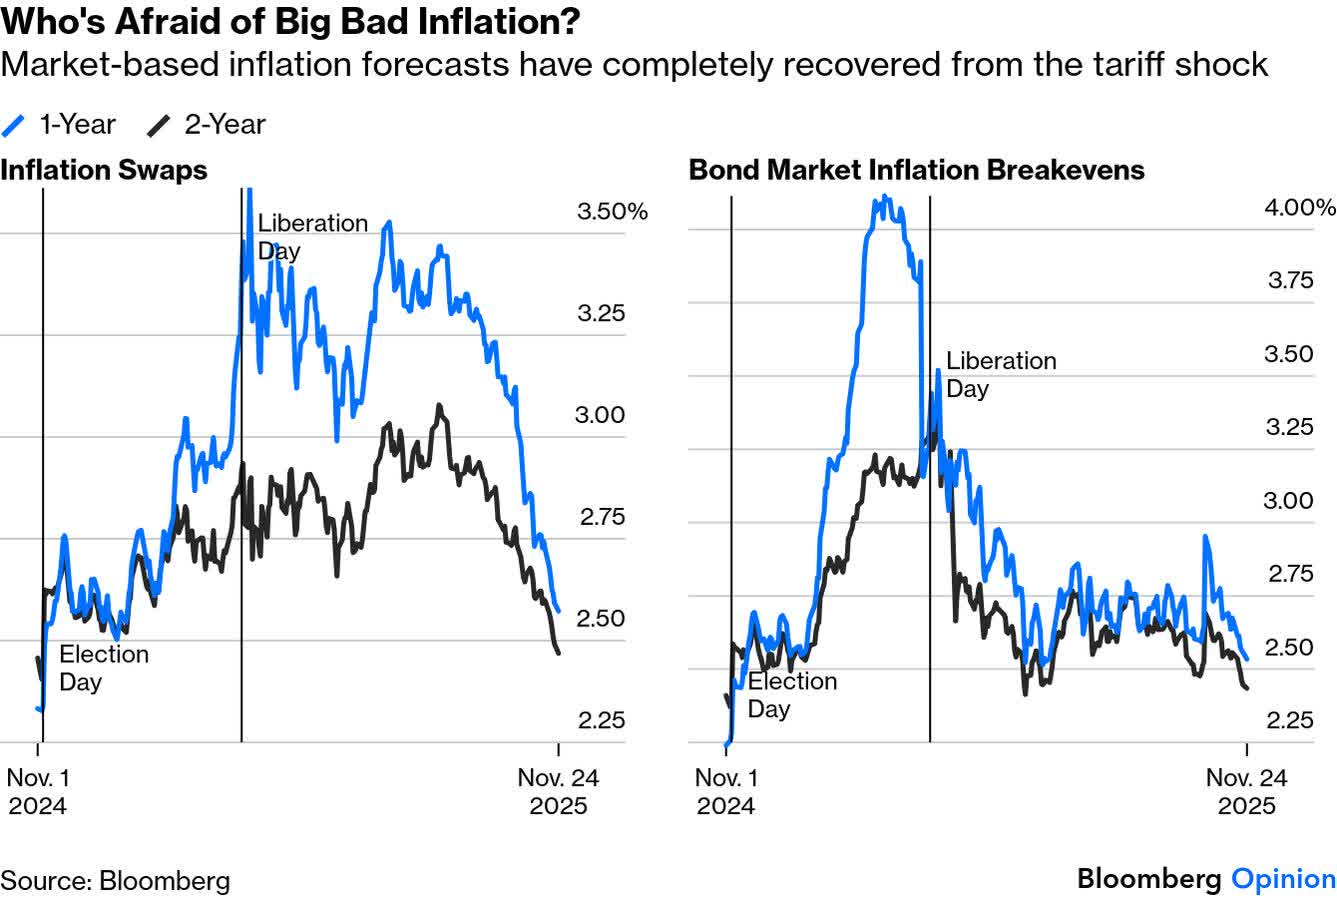
Furthermore, inflation expectations in the marketplace have collapsed from the tariff-tantrum days, which is probably why a growing number of Fed officials are more focused on stimulating growth in 2026 with lower short-term interest rates. This is what a soft landing looks like, which most investors have never seen before unless they were involved in the markets in the mid-1990s. This landing has not been smooth, as the economy bounced off the runway earlier this year in April when the Consumer Price Index (CPI) touched 2.3%. I expect we will take another shot at that landing next year, but this time it will be a successful one.
Backdoor AI Beneficiary Yields 8.8%, Trades at 13% Discount
Brett Owens, Chief Investment Strategist Updated: November 26, 2025
Drug development will never be the same! AI is compressing time-to-market and extending the sales calendar for pharma. More profits from new medications. More new medications, too.
Many pharma and biotech stocks will boom as we enter the “sci-fi” stage of research and development. And this elite 8.8% dividend will directly benefit.
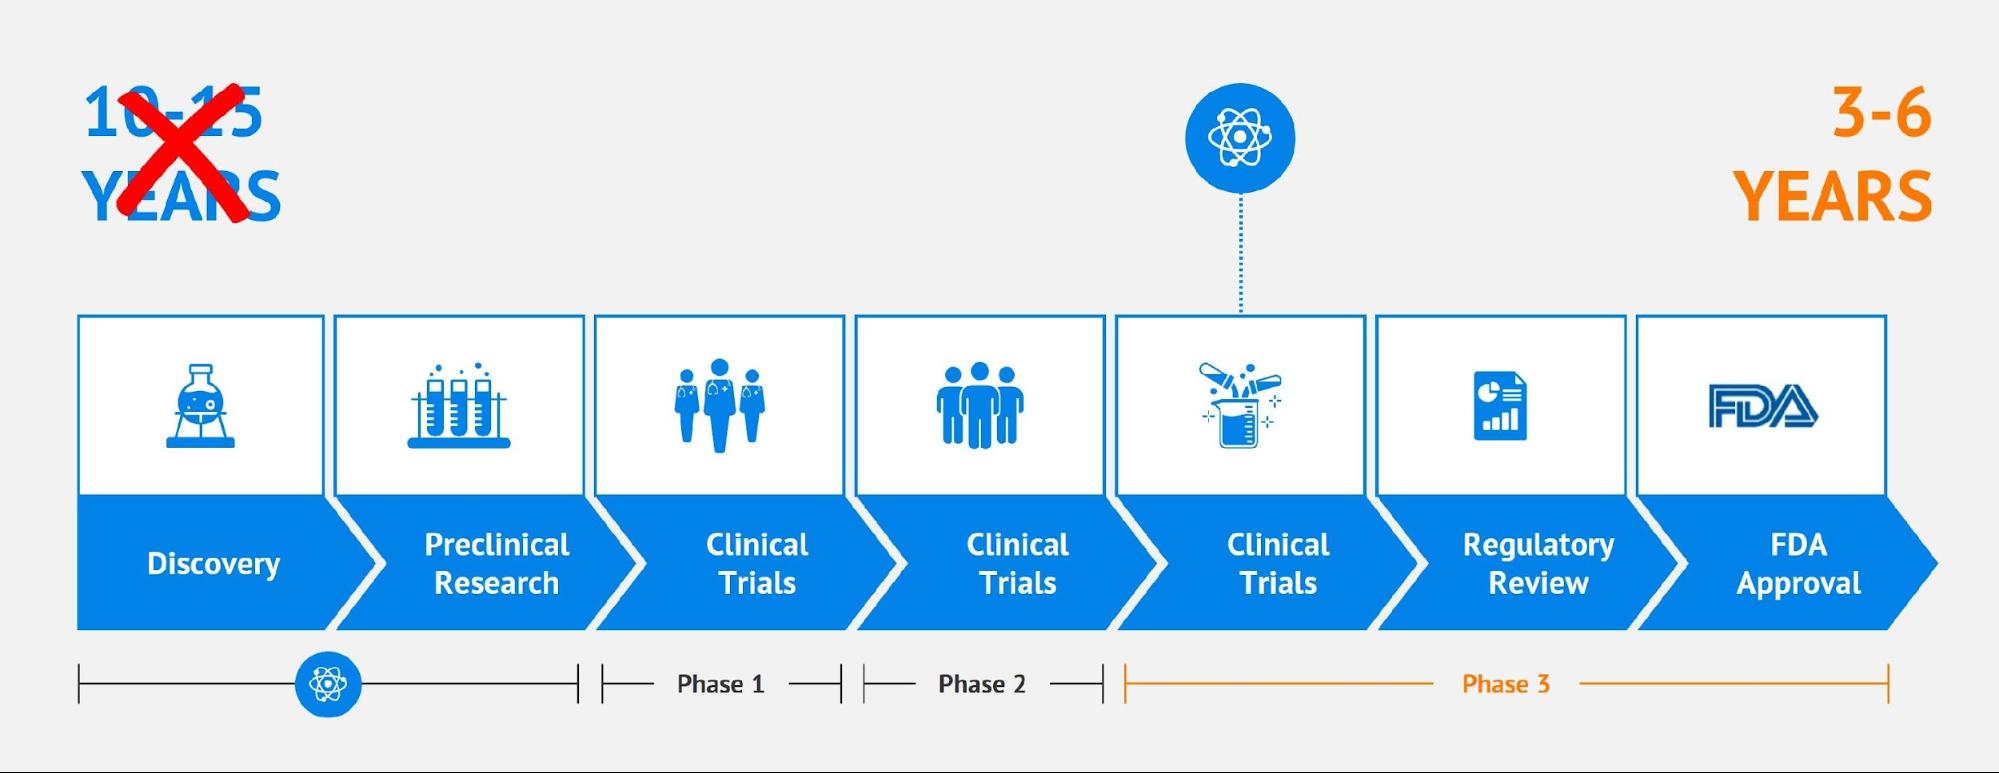
It typically takes 10 to 15 years to develop a new drug. Every month matters because patents last only 20 years. The faster a company gets a drug to market, the more months and years it enjoys with monopoly pricing power.
When patents expire, the generic versions hit the market. And the profit party is over for the original blockbuster.
AI is changing all of this in favor of pharma profits.
Drug discovery cycles are already compressing. From 10 to 15 years, they will soon approach six years or less. Industry experts, in fact, are saying three to six years will be the new normal. Whoa! That shift hands pharma a decade or more monopoly pricing!
No, AI isn’t replacing scientists—it’s multiplying them. These tech models run overnight, on weekends, forever. They eliminate dead ends and push more viable drug candidates into trials.
In the years ahead, pharma will have more shots on goal. Which will result in more drug candidates and approved medications. And by getting these drugs to market faster, these companies will have more time to monetize the winners.
Cash flow is about to compound. So, let’s dial in this 8.8% divvie while we still can.
BlackRock Health Sciences Term Trust (BMEZ) is a closed-end fund (CEF) that owns the companies benefitting directly from pharma’s new sci-fi age. Faster drug development cycles will buoy their bottom lines. Bigger profits will boost stock prices and BMEZ’s net asset value (NAV).
Then, a higher NAV will reward investors with price gains! It will also support BMEZ’s 8.8% payout. And likely reduce or eliminate the CEF’s current 13% discount to NAV.
About that discount. A fun feature of CEFs, unlike ETFs, is that they often trade at discounts to NAV. They have a limited pool of shares, so increased demand for the stock boosts the price. ETFs trade at par—no discount or premium—to NAV. They issue more shares when their funds are in high demand and take shares away when their funds are out of favor.
CEFs “let it ride” with a fixed share count. Which means discounts (and premiums) happen with market emotion. Often. Good for us—buy low and sell high!
As we speak, BMEZ trades at a 13% markdown to its NAV. So, we’re literally paying 87 cents for $1 of assets. A fantastic deal considering the sector’s fundamentals are this strong.
BMEZ’s top holding Alnylam (ALNY) is a pioneer in “RNA interference”—a cutting-edge class of medicine that essentially turns off disease-causing genes. Alnylam’s therapeutics are being explored for treating genetic, heart and neurological diseases.
With AI, these explorations will run faster and better than ever before.
Bad genes? Alnylam fixes them. This company is going to have an R&D “field day” as it deploys AI into its laboratories.
Alnylam’s research also benefits from less regulation. The stock soared under Trump 1.0, racking up 300%+ gains. And the sequel is shaping up to be even bigger with ALNY already up 90% in Trump 2.0.
With holdings like ALNY, why does BMEZ fetch such a large discount? Earlier this year, drug developers were the market’s unwanted stepchild. Wall Street assumed Trump 2.0 would hammer drug prices even harder than Biden’s Inflation Reduction Act (IRA) already did.
Remember, Trump 1.0 kicked off the insulin caps. Biden’s IRA bill followed with price limits on ten blockbusters starting in 2026—a potential $160 billion profit hit to Big Pharma. Then Trump returned and chased Most-Favored-Nation (MFN) pricing, aiming to tie US drug prices to the lowest in the world.
Bad for pharma profit margins, to say the least! Investors dumped healthcare shares across the board in a final selling effort. After five years of underperformance, these stocks were wiped out.
But on cue, pharma did what pharma always does—it lobbied! MFN pricing stalled. The lobbyists slowed the political avalanche.
Meanwhile, the White House struck a headline-friendly deal with Pfizer. Then AstraZeneca. And three more big pharma firms. It looked like pharma was getting squeezed, but the fine print gave drugmakers exactly what they wanted: longer patents, faster reviews and cleaner reimbursement rules.
It’s a public relations win for the Administration. But most notably, it’s a quiet victory for the drugmakers. Firms are already benefiting from softer regulatory gloves and faster review cycles—the fastest ways to cash for any pharma firm.
More drugmakers will cut deals with Washington. More drugs will come to market thanks to AI. More companies will profit from their patent window as drug development times compress.
But BMEZ is still priced as if the 2024-25 pharma washout is ongoing, even though regulatory clouds are parting and AI is supercharging R&D! Let’s take the dividend deal while we can.
REITs have underperformed since 2022 rate hikes, but Hoya Capital’s David Auerbach says fundamentals are strong, especially among small and mid-cap names offering attractive yields.
Interest rate sensitivity in REITs is often overstated.
Earnings season highlights include strength in senior housing, data centers, and retail REITs, while office and lab space face challenges.
Hoya Capital’s HOMZ and RIET ETFs’ diversified exposure, focus on holistic housing and high-yield, low-leverage REITs, respectively.
Kwarkot/iStock via Getty Images
Rena Sherbill: Welcome back, David Auerbach, Chief Investment Officer at Hoya Capital. Great to have you back on Investing Experts talking REITs. Welcome back to the show, David.
So bring us up to date. We’ve seen a lot of underperformance in the previous years from the REIT space. There’s some promise of some higher performing stocks when we look at that space. What are you thinking about? What are you looking at? And maybe bring us up to date about how investors should be thinking contextually about the REIT space.
David Auerbach: A lot to spend right there in that one question we could probably spend an hour just on that alone. Let’s just take a step back here.
If you look back to when the Fed started hiking interest rates back in March of 2022, the REITs have underperformed the S&P (SP500) by about 70 percent. So to say that that’s a massive sell off is an understatement. If you go back to the global financial crisis under performance, that was around 20 percent.
So as a result, REITs are no doubt very cheap, but it does constrain them because it means that there could be high costs of capital. External growth is somewhat difficult to come by. However, if you peel back the layers of the onion, what you’ll see is that by and large, fundamentals are very solid across the board.
If you take the whole REIT asset classes, I like to say in conversations, the REIT sector is like your graduating class of high school. You have the top 10%, the REITs that are in the S&P 500, the valedictorian, the salutatorian of your class. Then you have the other side of the curve, the bottom 10%, the bullies, the troublemakers, the REITs that cut their dividends or the REITs that are over levered.
But what we like to do is focus on that middle part of the curve, the 150 students that go under the radar that don’t draw attention, cause conflicts or anything. And that’s really in the small and mid cap REITs.
That’s where you’re going to see some of these opportunities, especially when you look towards more yielding income oriented investments, where we do see those opportunities.
The end investor wants a company to do four things at the end of the day, really four things. Grow revenues, grow profits, grow dividends, and grow annual guidance. If a company is able to do those four things, regardless of what macroeconomic headlines are being thrown their way, you would assume that that company is on solid footing.
Now, like every other sector that’s out there sure there’s a couple of bad apples as part of this entire bunch but the broad entire scope of the universe most of those four things are happening on a quarter after quarter basis here’s how to look at this we just wrapped up third quarter earnings and i know we’re going to get into it but if the companies that provide 2025 earnings guidance, more than two thirds have raised their guidance.
More than a third of these REITs have raised their dividends this year. And more than 60 % of the companies raised their net operating income guidance for this year. And this is in the wake of tariffs rising at our high interest rates, a 10-year treasury that continues to remain elevated, treasury rates remains elevated. All of these macro factors are being thrown at the company.
So at the end of the day, an investor wants a management team, whether it’s Jensen Huang at Nvidia, Tim Cook at Apple, or David Simon at Simon Property Group. They want that management team to put the blinders on and focus on ways on how they can grow revenues while cutting expenses in the hopes of maximizing profit or net income that is passed through to shareholders in the form of dividends.
Rena Sherbill: I wanna get to the dividends in a second. I’m curious though, because of this rate environment and this questioning, by the way, for a deeper dive into the question of how the rate environment is affecting REITs, on December 9th, you are going to be part of a webinar with Daniel Snyder. So look for that, that’s at 2 p.m. Eastern on December 9th.
But in this rate interest conversation where there’s the promise of lowered interest rates after a couple of years of higher interest rates, how does that figure in and how does that play into how you strategize looking at REITs in general? And then in terms of the dividends, how does that affect things?
David Auerbach: A great question and you know from a very high level I want to start out by saying there’s this misconception that I like to say that REITs are interest rate sensitive.
Going back to what you learned in your finance class we were always taught that REITs are kind of like that contra beta to the market as in when the market is up REITs are down when the market is down REITs are up and now coming out of COVID for the past few years it seems like everything trades a lockstep with each other.
Number two, when they say that REITs are interest rate sensitive, I call BS on that because really when I think about REITs, I think about the end consumers that use these REIT-owned properties every single day.
But I think one other key piece that is kind of getting overlooked is that many of these REITs have, you know, investment grade ratings from a lot of the ratings agencies, Moody’s, S&P, Fitch. So they know what the borrowing environment looks like.
In a given day, the CFO knows what the lending environment looks like. And can I borrow your paper today at five, 5.05, 5.1. It’s not like that that window moves very much on a day to day basis. Again, it’s in those times of volatility where you see those big jumps. But let’s get back to your question.
We know that there is going to be a more, we’ll say dovish incoming Fed chairperson next year. We don’t know who yet, but we know that the goal is to bring in somebody that’s going to be much more favorable and let’s say aggressive in cutting interest rates. Therefore, those tailwinds should benefit the REITs sector as that happens. But it’s more than that. REITs are compared to fixed income.
Thus why REIT yields are always closely scrutinized versus the 10-year treasury because they kind of trade in lockstep with each other. So if the average REIT dividend yield is around 4 % right now, while the 10-year treasury trades north of 4%, that would technically make fixed income a more attractive investment vehicle. But if you, there’s a couple different ways to look at this.
That 4% number that I’m giving you is basically a market cap weighted number. So the biggest of the biggest reads, the American Towers (AMT) of the world, the Prologises (PLD) of the world, frankly, aren’t yielding that much, which is why here at Hoya, again, we find the value in the small and mid cap reads moving down that ladder.
So if you equal cap weight all of those reads, that yield goes towards around 6% or so. And thus, again, on an equal basis, REITs would be more attractive than fixed income. And as Fed cuts rates, one would hope the 10-year Treasury number goes lower as well. And thus, that spread between REIT dividends and fixed income would continue to widen.
Rena Sherbill: Speaking of dividends, we saw a bunch of dividend hikes in October that we just got that report out recently. What would you say to your point about dividends and that there should be improved reasons to be bullish on REITs? What would you say contextually about the dividend hikes that we’ve seen?
David Auerbach: I want to bring in dividends with other things that a lot of the REITs have been doing to unlock value. Again, if we go back to the start of 2022, when the Fed started hiking interest rates, we’ve seen 36 different companies that have basically gone away, merged, liquidated, explored options, trying to unlock value.
In the past quarter alone, we’ve seen 10 different REITs go through that same process. While going back to 2022, we’ve only seen 10 new REITs come to market.
So at this point, management teams are trying to figure out ways to unlock value for shareholders since most of these REITs are trading at discounts to net asset value. But to answer your question about dividends, that’s why this kind of plays hand in hand with what I was just explaining. Because if you go back to pre-COVID, right before COVID started, again, and I know we’re talking about something from five years ago, but a lot of these sectors are still compared about how are they performing versus pre-COVID.
And the way to say about the REITs was, before COVID, the REITs were basically at the top of the market. Leasing wasn’t an all-time high, rental rates were an all-time high, dividends were at an all-time high. The REIT sector was just firing on all cylinders. COVID hits, REIT sector goes in the tank for a variety of reasons. Fed starts hiking interest rates. REITs are out of favor.
But let’s go to the fundamental side of the equation. Here we are five years later. The REITs are putting up fundamentals that surpass what they were doing at their COVID peak, their earnings, their growth, but their dividends have not caught up to where they were pre-COVID for a variety of reasons. But I would say,
One of the specific reasons as to why a lot of the REITs have not gotten so aggressive on hiking is because I feel like some of them are retaining cash for a rainy day. Is it better to raise my dividend by a penny or two pennies across, again, millions of shares of stock, or is it better to retain that capital to find the right opportunity that comes along?
Most, if not almost every single one of these companies, their earnings that they’re making are dramatically covering their dividend payment versus a handful of options where, excuse me, a handful of companies where the dividend is not being covered by earnings.
So the takeaway here is that the REITs that continue to grow still have ample capacity to continue to raise their dividends.
Rena Sherbill: And what names would you put to that? What names would you put in that column and what names would you put in the other column?
David Auerbach: It’s kind of hard to forecast who will continue and all that type of stuff. It’s very hard to kind of gauge. But a couple of that would stand out.
A good example would be like Simon Property Group (SPG). Simon just raised their dividend. I believe it’s for the 11th time coming out of COVID. That’s one example.
You have companies like Welltower (WELL) that have grown their market cap by over 5x in the past half decade and they’re one of the very, very few REIT stocks that’s actually trading at a premium right now.
I think it’s really on a case by case, sector by sector basis. Another company that stands out as far as dividend growth is a small cap health care REIT called Strawberry Fields (STRW).
Strawberry Fields is a company that’s more than doubled the size of their portfolio. And frankly, their dividend has doubled in size as well. I think a good way to look at dividend growth is looking towards the companies and the fundamentals and seeing how they are growing.
Meaning, if we have gone out and acquired, I’m just throwing random numbers out there. If we’ve increased our portfolio revenue by 25, 50%, dot, dot, dot, one would assume that the dividend is going to go up by a corresponding amount as well. So really look towards the internal and external growth of these companies and their earnings to kind of get a gauge on what’s being pushed through.
Then there’s other companies that pay consistent monthly dividends, Realty Income (O), Agree Realty (ADC). The list of the companies are out there, but it’s slow and steady, tried and true.
I interviewed the CEO of AGNC Mortgage (AGNC), a mortgage REIT just a couple of months ago, and he was very transparent saying, look, David, we’re a mortgage REIT. Mortgage REITs go under the radar. They’re always kind of under the gun.
And guess what? We’ve never cut our dividend. We’ve maintained our monthly dividend through COVID and beyond. We’re plotting along because our customers are Fannie and Freddie and government-backed securities. And so we’re able to continue to do business as usual.
So I think we could play this on a case-by-case, company-by-company level. I will say, again, to be fair and balanced, one company to keep an eye on that might cut their dividend, and they’re kind of implying as much, would be Alexandria (ARE).
They had a very disappointing third quarter earnings report. And they are kind of guiding towards a 2026 dividend cut. If you read through some of the materials they’ve published here in the past few weeks.