Figure 9: Top 10 revenue counterparties
| Firm | % of total portfolio |
|---|---|
| Ecotricity Limited | 9.2 |
| Viridian Energy Supply | 7.8 |
| Office of Gas and Electricity Markets | 6.4 |
| Npower Limited | 6.3 |
| Statkraft Markets GmbH | 5.9 |
| Bespoke Supportive Tenancies Limited | 4.6 |
| Smartestenergy Limited | 4.5 |
| Total Gas & Energy Limited | 4.4 |
| Good Energy Limited | 4.4 |
| Gloucestershire County Council | 4.1 |
Source: GCP Infrastructure Investments
Figure 10: Top 10 project service providers
| Firm | % of total portfolio |
|---|---|
| WPO UK Services Limited | 21.0 |
| PSH Operations Limited | 13.0 |
| Vestas Celtic Wind Technology Limited | 11.3 |
| Solar Maintenance Services Limited | 9.7 |
| A Shade Greener Maintenance | 8.7 |
| 2G Energy Limited | 5.9 |
| Pentair | 4.6 |
| Atlantic Biogas Ltd | 4.6 |
| Thyson | 4.6 |
| Cobalt Energy Limited | 4.1 |
Source: GCP Infrastructure Investments
Recent investment activity
Although there were no new investments made over GCP’s 2024 financial year, the company did make one new loan to an existing borrower, totalling £2.6m. Follow-on investments of £24.7m were also made, with these focused on restructuring and management to preserve value and potential future profitability. This was offset by repayments of £39.2m, giving a net repayment from the existing portfolio of £11.9m.
Figure 11: Outflows (investments)
Figure 12: Inflows (repayments)
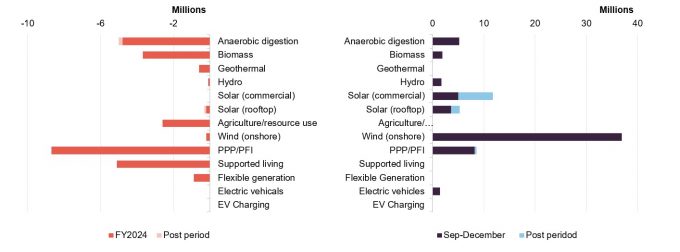
Source: Gravis Capital Partners
Source: Gravis Capital Partners
Conservative assumptions
Figure 13: Valuation assumptions as at 30 September 2024
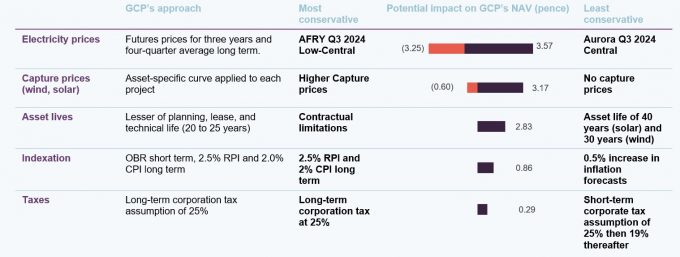
Source: GCP Infrastructure Investments
Figure 13 summarises the key assumptions used in forecasting cash flows from renewable assets in which the company is invested, and the range of assumptions that the investment adviser observes in the market. GCP’s advisers traditionally take a conversative approach, with the chart highlighting alternative, more aggressive valuation assumptions that could be taken. The net effect of this is that, were GCP to assume the most conservative assumptions in every category, the end-September NAV of 105.22p would be reduced to 101.37p. By contrast, were GCP to assume the least conservative assumptions in each category, the NAV would have been 115.94p.
Were GCP to assume the least conservative assumptions in each category, the NAV would have been 115.94p.
Such an approach is admirable, as it reduces the likelihood and severity of any unexpected shocks to GCP’s NAV, e.g. a sharp reversal in wholesale gas prices. It also raises the possibility of further NAV uplifts from portfolio disposals, such as with the Blackcraig wind farm. Note that valuation metrics do not affect either the dividend pay-out or the share price yield.
Sensitivities
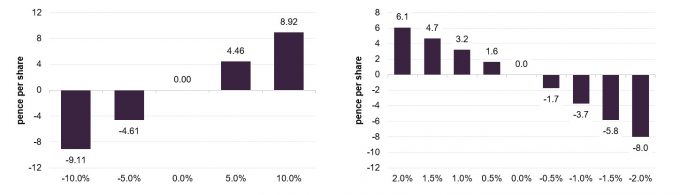
The investment adviser also provides a sensitivity analysis for its cash flows. Figures 14 and 15 show the impact of changes in power prices and changes in its base case inflation forecast.
As noted, one of the main areas of focus for GCP’s capital recycling programme is reducing the impact of power price volatility on its cash flows and NAV. As such, we expect the figures highlighted in Figure 14 to reduce materially going forward.
Figure 14: Impact of change in forecast electricity prices
Figure 15: NAV impact associated with a movement in inflation
Source: GCP Infrastructure Investments
Source: GCP Infrastructure Investments
Performance
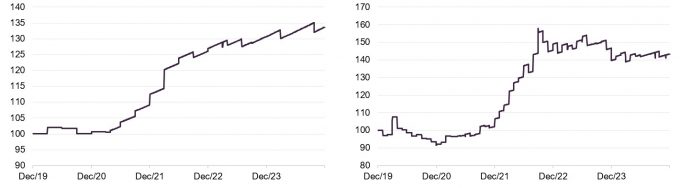
Despite less-favourable market conditions over the last few years, GCP has still managed to deliver a NAV total return of 33.6% since 2019. This supports our view that the market reaction, which has seen shares fall by 22% over the same period, is in no way a fair reflection of the quality of the company’s underlying assets.
Figure 17 illustrates the significant outperformance of GCP over the sterling corporate bond index. This figure provides another illustration of the tangible returns generated by the company above direct market comparables. We believe there exists a clear advantage for investors seeking sustained long-term distributions in GCP’s strategies, particularly in the face of increasing bond market volatility.
Figure 16: GCP NAV total return
Figure 17: GCP NAV total return performance relative to sterling corporate bond performance
Source: Morningstar, Marten & Co
Source: Morningstar, Marten & Co
Whilst the NAV total return has been modest over the past 12 months, the company is yet to fully realise the benefits of its capital recycling efforts due to transaction delays experienced throughout the year. As we have noted, these are now expected to flow through the portfolio over the first half of 2025, suggesting there is a significant amount of potential upside as these positions are realised, bearing in mind the 6.4% premium to NAV at which the Blackcraig windfarm investments were solid. Additional realisations at or above NAV can only work to highlight the irrationality of the current discount, which remains near historical extremes. Coupled with improving market conditions, an impressive policy backdrop, and a long track record of capitalising on changing market dynamics, we believe there is a considerable opportunity for investors at current prices.
Figure 18: Cumulative total return performance over periods ending 31 December 2024
| 3 months (%) | 6 months(%) | 1 year(%) | 3 years (%) | 5 years (%) | |
|---|---|---|---|---|---|
| GCP share price | (7.8) | (8.0) | 7.5 | (16.9) | (22.0) |
| GCP NAV | 0.6 | 1.0 | 2.2 | 18.8 | 33.6 |
| Sterling corporate bonds | (0.3) | 2.8 | 6.8 | (9.9) | (4.9) |
Source: Morningstar, Bloomberg, Marten & Co
Peer group
Figure 19: Infrastructure peer group comparative data as at 31 December 2024
| Premium / (discount) (%) | Dividend yield (%) | Ongoing charge(%) | Market cap (GBPm) | |
|---|---|---|---|---|
| GCP Infrastructure Investments | (33.3) | 10.0 | 1.10 | 609 |
| 3i Infrastructure | (12.8) | 3.9 | 1.65 | 2,988 |
| BBGI Global Infrastructure | (15.1) | 6.8 | 0.93 | 896 |
| Cordiant Digital Infrastructure | (26.2) | 4.4 | 0.90 | 697 |
| Digital 9 Infrastructure | (58.5) | 0.5 | 1.33 | 164 |
| HICL Infrastructure | (23.9) | 6.9 | 1.14 | 2,386 |
| International Public Partnerships | (18.7) | 7.0 | 1.20 | 2,286 |
| Pantheon Infrastructure | (22.1) | 4.7 | – | 416 |
| Sequoia Economic Infrastructure | (17.3) | 8.7 | 0.95 | 1,238 |
| Peer group median | (22.1) | 6.8 | 1.1 | 896.0 |
| GCP rank | 8/9 | 1/9 | 4/8 | 7/9 |
Source: Morningstar, Marten & Co
Up-to-date information on GCP and its peers is available on the QuotedData website
GCP sits within the AIC’s infrastructure sector, which is made up of three companies that invest predominantly in public/private partnership project equity (BBGI, HICL and International Public Partnerships), two companies that have more revenue exposure towards demand driven assets (3i Infrastructure and Pantheon Infrastructure), two digital infrastructure companies (Cordiant Digital Infrastructure and Digital 9 Infrastructure) and one company (Sequoia Economic Infrastructure, which – like GCP – invests primarily in infrastructure debt, but using a much broader definition of what constitutes infrastructure).
Since our last note, median discounts in the infrastructure sector have widened from 15.9% to 22.1%. Unfortunately for GCP, its discount has slipped further, falling to 32.6%.
After a positive re-rating earlier in the year, GCP’s discount is now the second-widest in the sector, behind Digital 9 Infrastructure, a trust in managed wind-down following a number of operational issues. By contrast, as we have highlighted, GCP continues to execute well. We are confident that the discount remains a temporary phenomenon, given the quality of the company’s assets and the reliability of its earnings. Almost two-thirds of GCP’s investments are regulated or contracted, de-risking returns through highly visible and increasingly stable earnings. This structure has provided the foundation for the company’s current capital programs and leaves the adviser in a strong position to rebalance the portfolio when it does begin to make new investments.
GCP also boasts the highest dividend of its immediate peer group, adding additional appeal to the shares.
Figure 20: Infrastructure peer group cumulative NAV TR performance ending 31 December 2024
| 3 months (%) | 6 Months(%) | 1 year(%) | 3 years (%) | 5 years (%) | |
|---|---|---|---|---|---|
| GCP | (0.6) | 1.0 | 2.2 | 18.8 | 33.6 |
| 3i Infrastructure | 0.8 | 5.2 | 10.3 | 39.8 | 80.1 |
| BBGI | 1.4 | 2.5 | 5.4 | 23.0 | 40.7 |
| Cordiant Digital Infrastructure | 2.7 | 3.6 | 14.4 | 35.5 | n/a |
| Digital9 Infrastructure | 0.1 | (42.4) | (55.3) | (52.4) | n/a |
| HICL | 1.3 | 1.6 | 3.5 | 17.5 | 30.6 |
| International Public Partnerships | 1.4 | 0.8 | 1.8 | 17.9 | 28.3 |
| Pantheon Infrastructure | 0.9 | 5.6 | 12.0 | n/a | n/a |
| Sequoia Economic Infrastructure | 0.5 | 2.0 | 8.0 | 14.0 | 23.2 |
| Peer group median | 0.9 | 2.0 | 5.4 | 18.3 | 32.1 |
| GCP rank | 9/9 | 7/9 | 7/9 | 4/8 | 3/6 |
Source: Morningstar, Marten & Co
Alternative peer group – renewable energy companies
Figure 21: Renewable energy peer group comparative data as at 31 December 2024
| Premium / (discount) (%) | Dividend yield (%) | Ongoing charge(%) | Market cap (GBPm) | |
|---|---|---|---|---|
| GCP | (33.3) | 9.9 | 1.10 | 609 |
| Aquila Energy Efficiency Trust | (45.1) | 0 | – | 43 |
| Aquila European Renewables | (27.0) | 8.8 | 1.10 | 207 |
| Bluefield Solar Income | (24.9) | 9.4 | 1.02 | 562 |
| Downing Renewables & Infra. | (32.9) | 7.3 | 1.60 | 135 |
| Ecofin US Renewables | (52.6) | 2.3 | 1.78 | 34 |
| Foresight Environmental Infrastructure Group | (31.0) | 10.3 | 1.24 | 490 |
| Foresight Solar Fund | (32.8) | 10.6 | 1.15 | 428 |
| Gore Street Energy Storage | (51.4) | 14.4 | 1.42 | 245 |
| Greencoat Renewables | (24.6) | 8.1 | 1.18 | 769 |
| Greencoat UK Wind | (17.4) | 7.6 | 0.92 | 2,954 |
| Gresham House Energy Storage | (59.3) | 12.3 | 1.19 | 256 |
| Harmony Energy Income | (26.5) | 0.2 | – | 148 |
| HydrogenOne capital growth | (78.3) | 0 | 2.56 | 28 |
| NextEnergy Solar | (32.6) | 12.8 | 1.11 | 383 |
| Octopus Renewables Infrastructure | (34.5) | 8.9 | 1.16 | 378 |
| SDCL Energy Efficiency Income | (38.3) | 11.2 | 1.02 | 608 |
| The Renewables Infrastructure Group | (27.5) | 8.5 | 1.04 | 2,173 |
| Triple Point Energy Efficiency | (41.5) | 11.9 | 2.06 | 46 |
| US Solar Fund | (42.9) | 5.3 | 1.39 | 105 |
| VH Global Energy Infrastructure | (42.1) | 8.8 | 1.39 | 255 |
| Peer group median | (33.3) | 8.8 | 1.2 | 256.0 |
| GCP rank | 11/22 | 8/22 | 5/21 | 4/22 |
Source: Morningstar, Marten & Co
In light of the increasing importance of renewable energy within GCP’s portfolio, we feel it is also relevant to compare the company to the constituents of the renewable energy infrastructure sector, shown in Figure 21. However, it is worth noting that this encompasses a diverse range of companies which are not all directly comparable to GCP, such as Ecofin US Renewables and the US Solar Fund, which have much-longer-term PPAs and are therefore less exposed to energy price volatility. GCP’s asset base also differs widely from the energy storage companies – Gore Street, Gresham House and Harmony – and the energy efficiency companies – Aquila, SDCL and Triple Point.
We think the best comparators are Bluefield Solar, Foresight Solar, Greencoat UK Wind, Foresight Environmental Infrastructure, NextEnergy Solar, Octopus Renewables and The Renewables Infrastructure Group.
Notably, in contrast to the lower discounts in the infrastructure sector, GCP’s discount is in line with the median for the renewable energy peer group, highlighting the negative sentiment surrounding the sector.
Figure 22: Renewable energy peer group cumulative NAV TR performance ending 31 December 2024
| 3 months (%) | 6 Months(%) | 1 year(%) | 3 years (%) | 5 years (%) | |
|---|---|---|---|---|---|
| GCP | (0.6) | 1.0 | 2.2 | 18.8 | 33.6 |
| Aquila Energy Efficiency Trust | 7.9 | 7.9 | 5.9 | 8.8 | n/a |
| Aquila European Renewables | 0.8 | (2.6) | (10.7) | 1.9 | n/a |
| Bluefield Solar Income | 1.8 | (2.4) | (0.9) | 24.2 | 45.2 |
| Downing Renewables & Infra. | 1.0 | 1.3 | 4.1 | 30.5 | n/a |
| Ecofin US Renewables | 6.4 | (17.8) | (25.0) | (20.3) | n/a |
| Foresight Solar Fund | 1.8 | 1.7 | 2.1 | 25.6 | 50.9 |
| Gore Street Energy Storage | 1.9 | (3.3) | (4.9) | 15.5 | 46.9 |
| Greencoat Renewables | 0.7 | (0.9) | (1.0) | 24.9 | 42.1 |
| Greencoat UK Wind | 1.6 | 2.4 | 2.4 | 40.9 | 74.0 |
| Gresham House Energy Storage | 1.3 | (16.3) | (24.4) | 4.5 | 37.7 |
| Harmony Energy Income | (6.7) | (8.0) | (22.8) | n/a | n/a |
| HydrogenOne Capital Growth | 0.0 | (2.7) | (0.6) | 5.3 | n/a |
| Foresight Environmental Infrastructure Group | (1.2) | 0.1 | (1.8) | 31.6 | 49.7 |
| NextEnergy Solar | (1.5) | (2.6) | (1.8) | 16.2 | 31.5 |
| Octopus Renewables Infrastructure | 1.5 | 2.8 | 2.7 | 18.9 | n/a |
| SDCL Energy Efficiency Income | 1.7 | 3.7 | 7.2 | 4.2 | 25.7 |
| The Renewables Infrastructure Group | 1.6 | 0.4 | (1.5) | 20.5 | 40.8 |
| Triple Point Energy Efficiency | 1.8 | 32.6 | 22.6 | 38.3 | n/a |
| US Solar Fund | 6.9 | 1.1 | (6.0) | (2.8) | 2.7 |
| VH Global Energy Infrastructure | 1.3 | (1.6) | 10.6 | 22.4 | n/a |
| Peer group median | 1.5 | 0.1 | (0.9) | 18.8 | 41.4 |
| GCP rank | 18/21 | 9/21 | 8/21 | 11/20 | 9/12 |
Source: Morningstar, Marten & Co
Quarterly dividend
Dividends are declared and paid quarterly. Shareholders are able to elect to take their dividend as scrip (in shares rather than cash). In its 2024 financial year, GCP’s target dividend remained stable at 7.0p in line with its previous three financial years.
Discount
Over the past 12 months, GCP’s shares have traded on an average discount of 30.2%, a high of 22.2%, and a low of 37.2%. As of publishing, the discount stood at 32.6%. As Figure 23 shows, this narrowed considerably over the first half of 2024 as markets reacted to the expectation of lower interest rates. Unfortunately, as we have noted, financial conditions have steadily tightened in recent months, which has weighed on GCP’s shares. Despite this, on balance we remain confident that the overall policy backdrop remains supportive of the re-rating seen in the first half.
Figure 23: GCP discount over five years ending 31 December 2024
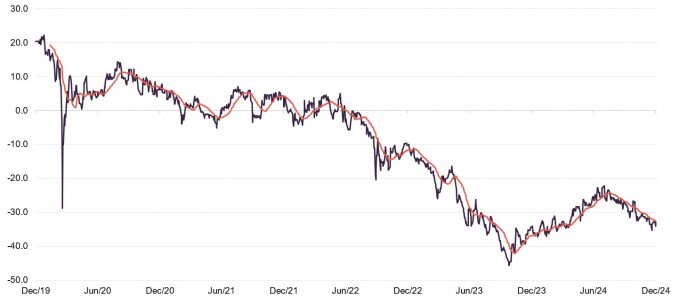
Source: Morningstar, Marten & Co
Fees and costs
The investment adviser receives an investment advisory fee of 0.9% a year of the NAV net of cash. This fee is calculated and payable quarterly in arrears. There is no performance fee. The investment adviser is also entitled to an arrangement fee of up to 1% (at its discretion) of the cost of each asset acquired by GCP. Gravis will generally seek to charge the arrangement fee to borrowers rather than to the company, where possible. To the extent that any arrangement fee negotiated by the investment adviser with a borrower exceeds 1%, the benefit of any such excess shall be paid to the company. The investment adviser also receives a fee of £70,000 (subject to RPI adjustments) a year for acting as AIFM, which was £89,000 for the 2024 FY, after adjustments.
The investment advisory agreement may be terminated by either party on 24 months’ written notice.
Apex Financial Services (Alternative Funds) Limited is GCP’s administrator and company secretary. Depositary services are provided by Apex Financial Services (Corporate) Limited. The fee for the provision of these services during the year was £1.008m (FY23 £1.034m).
The ongoing charges ratio for the year ended 30 September 2024 was 1.1%, unchanged from the prior year.
Capital structure and life
As of 31 December 2024, GCP has 884,797,669 ordinary shares outstanding, of which 18,915,019 are held in treasury. The company’s financial year end is 30 September and AGMs are held in February.
GCP is an evergreen company with no fixed life and no regular continuation vote.
Gearing and derivatives
Structural gearing of investments is permitted up to a maximum of 20% of NAV immediately following drawdown of the relevant debt. At 30 September 2024, GCP’s net gearing was 4.5%, down significantly from 10.8% in FY2023.
As of 30 September 2024, the company has credit arrangements of £150m across four lenders: Lloyds, AIB, Mizuho and Clydesdale. At year end, £57m was drawn.
Major shareholders
Figure 24: Major shareholders
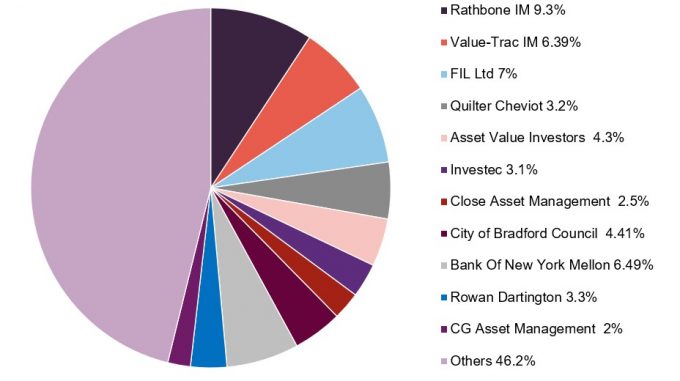
Source: Marten & Co
Leave a Reply