GCP Infrastructure – Substantive progress
Figure 9: GCP’s 10 largest investments as at 31 March 2025
| % of total assets 31/03/25 | Cashflow type | Project type | |
|---|---|---|---|
| Cardale PFI | 13.4 | Unitary charge | PFI/PPP (18 projects) |
| Gravis Solar 1 | 9.4 | ROC/FiT | Commercial solar |
| GCP Programme Funding S14 | 5.7 | ROC/RHI/Merchant | Biomass |
| GCP Bridge Holdings | 5.1 | ROC/PPA | PPE – Energy-from-waste / Energy efficiency |
| GCP Biomass 2 | 5.0 | ROC/PPA | Biomass |
| GCP Programme Funding S10 | 4.9 | Lease | Supported living |
| GCP Social Housing 1 B | 4.0 | Lease | Supported living |
| Gravis Asset Holdings H | 4.0 | ROC/RHI | Onshore wind |
| GCP Green Energy 1 | 3.8 | ROC/PPA | Commercial solar/onshore wind |
| GCP Rooftop Solar Finance | 3.7 | FiT | Rooftop solar |
Source: GCP Infrastructure Investment
The list of revenue counterparties is not much changed since we last published. ENGIE Power Limited has entered the list replacing Total Gas and Energy Limited. In the list of project service providers, Veolia ES (UK) Limited, Urbaser, and Gloucester County Council have replaced Pentair, Atlantic Biogas, and Thyson.
Figure 10: Top 10 revenue counterparties
| Firm | % of total portfolio |
|---|---|
| Ecotricity Limited | 9.4 |
| Npower Limited | 7.3 |
| Viridian Energy Supply | 7.2 |
| Statkraft Markets GmbH | 5.9 |
| Bespoke Supportive Tenancies Limited | 5.1 |
| Office of Gas and Electricity Markets | 4.7 |
| Smartestenergy Limited | 4.5 |
| Good Energy Limited | 4.5 |
| Gloucestershire County Council | 4.2 |
| ENGIE Power Limited | 4.0 |
Source: GCP Infrastructure Investments
| Firm | % of total portfolio |
|---|---|
| WPO UK Services Limited | 20 |
| PSH Operations Limited | 13 |
| Solar Maintenance Services Limited | 10 |
| A Shade Greener Maintenance | 9 |
| Vestas Celtic Wind Technology Limited | 8 |
| Veolia ES (UK) Limited | 5 |
| Cobalt Energy Limited | 5 |
| Urbaser Limited | 4 |
| Gloucester County Council | 4 |
| 2G Energy Limited | 4 |
Source: GCP Infrastructure Investments
Sensitivities
The investment adviser also provides a sensitivity analysis for its cash flows. Based on a total fair value for GCP’s assets, a 0.5% increase in its discount rate would take about 3.0% off the total fair value. A 0.5% decrease in discount rates would add 3.2%.
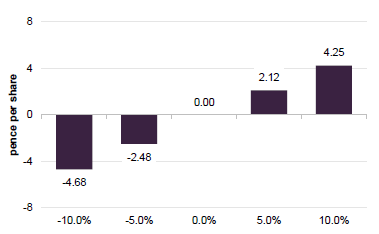
Figure 12: NAV impact of change in forecast electricity prices
Source: GCP Infrastructure Investments
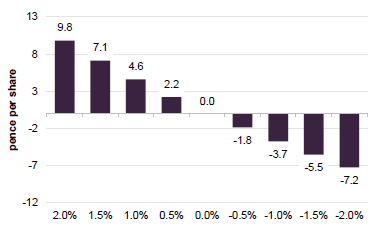
Figure 13: NAV impact associated with a movement in inflation
Source: GCP Infrastructure Investments
Clear evidence of reduced sensitivity to power prices
One of GCP’s aims for its capital recycling efforts is to reduce the portfolio’s sensitivity to fluctuations in power prices. Based on the numbers in Figure 10, it is achieving this. As at end March 205, a 10% fall in power price forecasts would take 4.68p off GCP’s NAV. Back at the end of September 2025, before the rooftop solar and onshore windfarm sales, that figure was 9.11p.
Higher inflation would be good news for GCP. Recent inflation figures suggest things are going its way in this respect. However, the quid pro quo for this tends to be higher for longer interest rates, which influence the discount rate. At end June 2025, the weighted average discount rate on the portfolio was 8.33%, marginally lower than the 8.36% number for end March. That just reflects principal and interest payments across the portfolio.
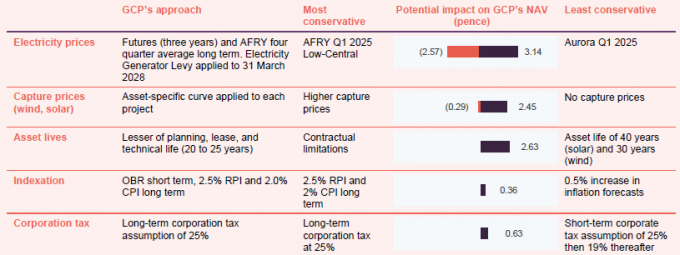
Conservative assumptions
As in previous reports, we have included a table (Figure 14) showing the impact of GCP’s conservative valuation assumptions on its NAV. The range shows what would happen to the NAV were GCP to adopt the most conservative or least conservative assumptions of peers when calculating its NAV. Whilst the sensitivity to power prices has fallen, it is still an important consideration. GCP uses the average of the last four quarterly power price curves produced by AFRY (a specialist consultancy that provides energy market forecasting and modelling used for long-term infrastructure valuations).
Figure 14: Valuation assumptions as at 31 March 2025
Source: GCP Infrastructure Investments
Performance
Despite the many headwinds facing the company in recent years, GCP’s NAV total return has remained positive and has held up fairly well, relative to the return from sterling corporate bonds as shown in Figure 16.
Figure 15: GCP NAV total return
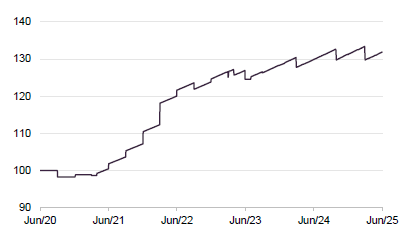
Source: Morningstar, Marten & Co
Figure 16: GCP NAV total return performance relative to sterling corporate bond performance

Source: Morningstar, Marten & Co
It is encouraging to see the impact of a narrower discount on GCP’s share price returns, but there is hopefully even more to come.
Figure 17: Cumulative total return performance over periods ending 30 June 2025
| 3 months (%) | 6 months(%) | 1 year(%) | 3 years (%) | 5 years (%) | |
|---|---|---|---|---|---|
| GCP share price | 5.3 | 8.6 | 0.3 | (13.9) | (3.2) |
| GCP NAV | 1.7 | 0.5 | 1.6 | 8.4 | 31.9 |
| Sterling corporate bonds | 3.1 | 3.5 | 5.6 | 8.7 | (4.7) |
Source: Morningstar, Bloomberg, Marten & Co
The next section looks at what has been driving GCP’s NAV return since we last published.
The largest negative move relates to a change to the assumed life of a portfolio of gas-to-grid anaerobic digestion assets. GCP has an equity exposure to these assets after the borrower experienced problems.
Significant factors affecting NAV over H1 2025
Figure 18: Factors affecting the NAV over H1 25
| Driver | Description | Impact (£m) | Impact (pence per share) |
|---|---|---|---|
| Inflation forecast | Inflation movements in the period | 6.9 | 0.81 |
| O&M budget update | Revised operating budget reflecting improved forecast cash flows | 3.1 | 0.36 |
| Other upward movements | Other upward movements across the portfolio | 5.1 | 0.60 |
| Asset specific revaluations | Revised long-term availability forecast for a gas-to-grid anaerobic digestion portfolio | (24.5) | (2.87) |
| Actual performance | Lower-than-forecast renewables generation | (12.7) | (1.49) |
| Discount rates | Higher discount rates | (3.5) | (0.41) |
| Other | Other, including the impact of hedging | (0.4) | (0.05) |
| Total | (26.0) | (3.05) |
Source: GCP Infrastructure Investments
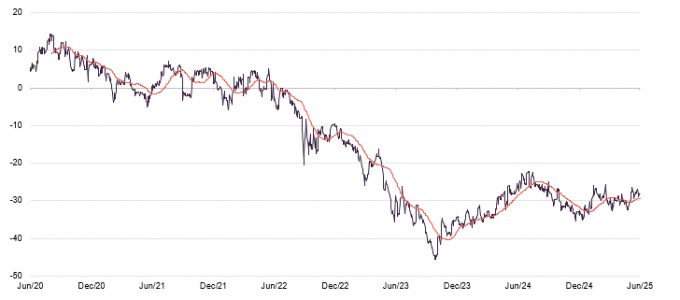
Premium/(discount)
Over the past 12 months, GCP’s shares have traded on an average discount of 29.1%, a high of 22.2%, and a low of 35.3%. As of publishing, the discount stood at 23.6%.
Figure 19: GCP discount over five years ending 30 June 2025
Source: Morningstar, Marten & Co
As discussed in previous notes, GCP’s discount widened over 2021 and 2022 as interest rates began to rise. The discount has narrowed somewhat since helped by share buybacks (as shown in Figure 20) and a capital recycling programme aimed at providing solid evidence of the validity of the NAV; improving the overall quality of the portfolio (in particular, reducing the sensitivity to power price fluctuations); and providing cash to both fund returns to investors and to reduce its floating rate debt. We believe that the discount ought to narrow further from here.
As Figure 20 illustrates, in pursuit of the capital recycling programme, GCP has now bought back over 23.8m shares, worth about £18.8m,
Figure 20: GCP share buybacks over past year
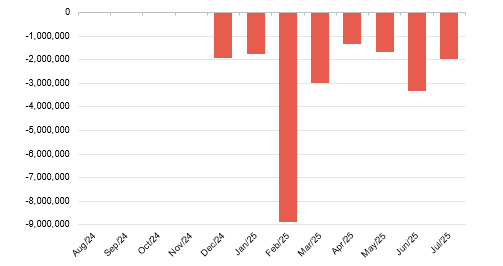
Source: Marten & Co
SWOT and bull vs. bear analysis
| Strengths | Weaknesses |
|---|---|
| Diversified portfolio across a range of infrastructure subsectors and borrowers | Relatively illiquid portfolio |
| Public-sector backed cashflows | Historically, GCP has exhibited more sensitivity to factors such as power prices than might be expected of a debt fund |
| Low gearing | Need to tackle persistent wide discount is preventing it from making new investments |
| Responds positively to higher inflation | |
| Conservative valuation assumptions | |
| Opportunities | Threats |
| Discount narrowing potential | Rising UK interest rates |
| Government needs private capital to fund infrastructure | While discount persists, vulnerable to activist investors |
Source: Marten & Co
| Bull | Bear | |
|---|---|---|
| Performance | Despite the odd setback, NAV has been relatively stable since launch | NAV returns have been on the low side in recent years, dragging down long-term averages |
| Dividends | Dividend looks increasingly reliable and headline yield is very attractive | Dividend cut in 2020 and flat dividend since at odds with rising returns from other debt investments |
| Outlook | Should be set fair if it can continue to deliver on its capital recycling programme | Need to see progress on social housing disposal that was flagged some time ago. Further delay/NAV writedown could undermine confidence |
| Discount | Discount appears to be on narrowing trend and there is more to go for | If confidence in UK economy and government finances was shattered, discount could widen again |
Source: Marten & Co

Leave a Reply