When investing, your capital is at risk. The value of your investments can go down as well as up and you may get back less than you put in.
As a parent, I want to give my daughter every possible advantage for her future. That’s why I decided to open a Junior Self-Invested Personal Pension (SIPP) for her now. That’s despite her retirement being five decades away.
The reason’s simple. The earlier you start investing, the more powerful the effect of compound interest becomes. And the more likely she is to achieve true financial security in later life.
A Junior SIPP allows me to contribute up to £2,880 a year. And with government tax relief, it becomes £3,600 — a 20% boost before the money’s even invested. By starting with her current balance of £3,500 and contributing £3,600 a year, or £300 a month, she’ll benefit from both these tax advantages and the long-term growth potential of the stock market.
Looking at the numbers
Let’s look at the numbers. Assuming an average annual return of 10% — a figure that reflects long-term stock market averages and is achievable with a diversified investment approach —her pension pot could reach over £8m in 50 years (she’d be 51). This projection includes modest annual increases in contributions. I’ve added this due to the likelihood that she’ll be able to pay in more once she starts working herself.
The power of compounding means that the money invested in her early years works hardest, growing exponentially over decades. For example, after 10 years, her pot could already exceed £80,000, and by year 25, it could be over half a million. By year 50, with continued contributions and growth, the total could surpass £8m, providing her with a level of financial independence that few can imagine.
However, starting a SIPP for my daughter is about more than just numbers. It’s about giving her a head start, teaching her the value of long-term investing, and ensuring she has choices and security in the future. In a world where retirement provision is increasingly an individual responsibility, I believe this is one of the best gifts I can give her.
A stock for the job
Scottish MortgageInvestment Trust (LSE:SMT) is a core holding in my daughter’s SIPP. It’s an investment trust with a long-term focus on high-growth, innovative companies across technology, healthcare, and other transformative sectors.
Despite recent volatility, the trust’s strategy of backing world-changing businesses has delivered outsized returns over time. Its managers have a proven track record of identifying winners, and the trust’s diversified approach helps spread risk across dozens of companies. Currently, the portfolio’s top holdings include SpaceX, MercardoLibre and Amazon.
One risk to highlight is Scottish Mortgage’s use of gearing (borrowings to invest). This amplifies both gains and losses, making the trust more volatile than traditional funds. This, combined with its concentration in fast-growing but sometimes unproven businesses, means short-term swings are inevitable.
However, for patient investors with a long-time horizon, Scottish Mortgage is certainly worthy of consideration. It’s diversified while broadly focusing on technology-driven investments, and I believe it will continue to drive strong growth in her SIPP.
How long would it take an owner of Legal & General shares to get their money back in passive income? Our writer looks at the passive income potential of Legal & General, one of the highest-yielding shares on the FTSE 100 (INDEXFTSE:UKX).
Posted by James Beard
Published 11 July
LGEN
When investing, your capital is at risk. The value of your investments can go down as well as up and you may get back less than you put in.
Read More You’re reading a free article with opinions that may differ from The Motley Fool’s Premium Investing Services.
Passive income — earning money from doing very little — is a great way of saving. And buying dividend shares is one of the most popular ways of building a nest egg for later in life, or to help set aside cash for a rainy day.
But it can sometimes be bewildering deciding which stocks to buy. Personally, I like to invest in the largest listed companies. Their strong reputations and global reach means they can be highly profitable. As a result, they tend to pay the biggest dividends. And generally speaking, their earnings are more reliable, making their payouts more predictable.
An example One of the best passive income shares around at the moment is Legal & General (LSE:LGEN), the pensions, life insurance and asset management group.
For 2024, it declared a dividend of 21.36p. Based on its current (11 July) share price of 252p, it means the stock’s yielding 8.5%. This makes it the second-highest-yielding share on the FTSE 100, where the average is 3.5%. It also comfortably beats anything that could be earned on a high-interest savings account.
And if it was able to maintain its payout at this level, anyone buying one of the group’s shares today would get their money back in just under 12 years.
But if the income was reinvested buying more of the company’s shares, the payback period would fall further.
Caution! However, for two reasons, this type of analysis is a little simplistic. Firstly, dividends are never guaranteed. Should Legal & General’s earnings come under pressure then one of the first things likely to be cut will be payments to shareholders.
However, the group has a better record than most when it comes to maintaining its dividend. It was last cut during the 2008-2009 financial crisis and it kept it unchanged during one year of the pandemic. The company’s pledged to increase its payout by 2% per annum from 2025-2027.
The second reason why these numbers must be be treated with caution is that the group’s share price could fall. Of course, it could also go up.
But there’s little point receiving generous dividends if the underlying value of the shares is being constantly eroded. Unfortunately, nobody can see into the future. However, over the past five years, Legal & General’s been a steady performer. Its shares are now changing hands for 14% more than they were in July 2020.
Strong prospects Personally, I think the company’s well placed to benefit from an ageing population and the likelihood of the state retirement age continuing to rise.
But its investments are sensitive to wider macroeconomic conditions. And a sustained downturn in global equities or the bond markets will impact its earnings. It also faces intense competition from some household names as well as some challenger brands.
However, it has a strong pipeline of potential new business. It’s also been around since 1836. Over the past 179 years, it’s come through plenty of difficult times, including financial crises and wars.
In addition, it has a strong balance sheet holding more than twice the level of reserves needed to comply with regulatory requirements. But it’s the group’s generous dividend — supplemented by a share buyback programme — that sets itself apart from most of its peers. Overall, I think it’s one of the best FTSE 100 stocks to consider.
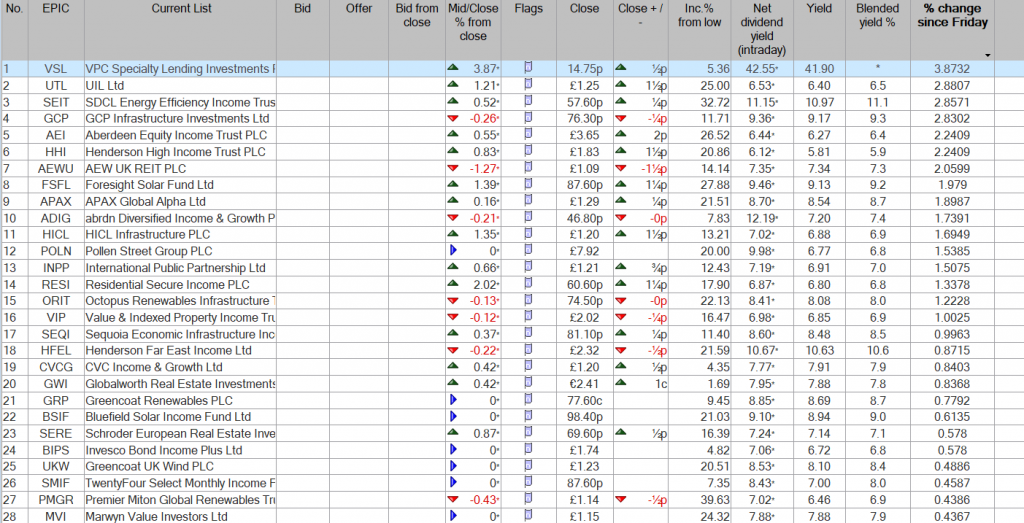
Investors could target £8,840 of annual dividend income from 5,851 shares in this FTSE 250 high-yield star !
Shares in this FTSE 250 stock generate a much higher dividend yield than the index average and can produce potentially life-changing passive income over time.
When investing, your capital is at risk. The value of your investments can go down as well as up and you may get back less than you put in.
You’re reading a free article with opinions that may differ from The Motley Fool’s Premium Investing Services.
FTSE 250 global investment manager aberdeen (LSE: ABDN) is up 53% from its 9 April 12-month traded low of £1.23.
Much of this jump has come from a turnaround in results as it continues with its reorganisation plan. This was instigated after the firm was demoted from the FTSE 100 in August 2023. It broadly aims to reduce middle management levels, cut costs, and improve the customer experience.
A risk to the stock is that this plan falters at some stage. Another is that a renewed surge in the cost of living prompts customers to cancel their policies.
However, 2024 saw an IFRS profit of £251m, compared to a £6m loss the previous year. Its 30 April Q1 trading update saw a reiteration of 2026 targets of a £300m+ operating profit and around £300m of net capital generation.
A further bump in its share price followed June’s upgrading of the stock to Overweight from Neutral by investment bank JP Morgan. The new rating indicates that the bank expects the stock to outperform its sector.
How much dividend income can be made now?
A stock’s yield moves in the opposite direction to its price, if the annual dividend stays the same. As a result, such a price rise has reduced the firm’s dividend yield from well over 10% when I first purchased it.
Nevertheless, it is still delivering an annual payout of 7.8%. By comparison, the current average yield of the FTSE 250 is 3.4% and the FTSE 100 is 3.5%.
Consensus analysts’ forecasts are that aberdeen will keep its dividend at 14.6p until the end of 2027 at minimum. It has been at this level every year since 2020.
Given the same average share price as now, this would continue the 7.8% dividend yield offered by the stock.
At that price, £11,000 — the average UK savings amount – would purchase any interested investor 5,851 shares in aberdeen.
Those shares would make £858 in dividends this year. Over 10 years on the same basis this would rise to £8,580 and over 30 years to £25,740.
That said, if the dividends were reinvested back into the stock – ‘dividend compounding’ – much more would be made.
More specifically, given the same 7.8% average yield, the dividends would be £12,936 after 10 years, not £8,580. And after 30 years they would be £102,332 rather than £25,740.
Including the original £11,000 stake, the total value of the aberdeen holding would be £113,332 by then. And this would be paying an annual dividend income of £8,840 at that point.
Will I buy more of the shares?
I have periodically been adding to my holding in aberdeen since I bought it after its demotion from the top-tier index. Aside from its huge dividend income potential, I thought it was enormously undervalued back then.
Both elements behind my investment decision were proven correct then, and I think both still stand now.
The yield forecast is for 7.8% until 2027 at minimum. And a discounted cash flow valuation shows the stock is 47% undervalued at its present price of £1.88. Therefore, its ‘fair value’ is £3.55.
Updated: SPDR S&P US Energy Select Sector and iShares S&P 500 Energy Sector were among the worst-performing ETFs in Q2 2025.
Bella Albrecht 7 Jul 2025Share
Exchange-traded funds, or ETFs, are often low-cost instruments for investors to track popular indexes or leverage experienced manager choices in an attempt to beat the market. The best ones serve as building blocks for a portfolio, and unlike open-end mutual funds, all ETFs are traded throughout the day on an exchange.
In the second quarter of 2025, the worst performers included SPDR S&P US Energy Select Sector UCITS ETF SXLE and iShares S&P 500 Energy Sector UCITS ETF USD Acc IUES. Data in this article is sourced from Morningstar Direct.
To find the quarter’s worst-performing ETFs, we screened those in Morningstar’s equity, allocation, or fixed-income categories that are available in the UK. We excluded exchange-traded notes, known as ETNs, and ETFs with less than $25 million (£18.3 million) in total assets. We also excluded funds that fall into Morningstar’s “trading” categories, as these funds are designed for active traders and are not suitable for long-term investors.
Among the worst-performing ETFs, five were from the equity healthcare category, where funds fell 4.44% in the second quarter.
The worst-performing ETF in the second quarter was the £490 million SPDR S&P US Energy Select Sector UCITS ETF, which lost 14.03%. The passively managed State Street ETF fell further than the average 3.87% loss on funds in the equity energy category in the second quarter. Over the past 12 months, SPDR S&P US Energy Select Sector fell 11.87%, placing it in the 80th percentile within its category and underperforming the 0.19% return on the average fund.
The SPDR S&P US Energy Select Sector UCITS ETF, launched in July 2015, has a Morningstar Medalist Rating of Bronze.
iShares V PLC – iShares S&P 500 Energy Sector UCITS ETF USD (Acc)
Morningstar Rating: 3 stars
Expense Ratio: 0.15%
Morningstar Category: Equity Energy
With a 14.02% loss, the £513 million iShares S&P 500 Energy Sector UCITS ETF USD (Acc) was the second-worst performing ETF on our list for the second quarter. The passively managed iShares ETF fell further than the average 3.87% loss on funds in the equity energy category. Over the past year, iShares S&P 500 Energy Sector lost 11.97%, placing it in the 83rd percentile within its category and underperforming the 0.19% return on the average fund.
The Bronze-rated iShares S&P 500 Energy Sector UCITS ETF USD (Acc) was launched in November 2015.
Invesco Energy S&P US Select Sector UCITS ETF
Morningstar Rating: 3 stars
Expense Ratio: 0.14%
Morningstar Category: Equity Energy
The third-worst performing ETF in the second quarter was the £53 million Invesco Energy S&P US Select Sector UCITS ETF, which fell 14.01%. The Invesco ETF, which is passively managed, fell further than the average 3.87% loss on funds in the equity energy category. Over the past 12 months, the ETF fell 12.04% to place in the 85th percentile within its category, underperforming the category’s average return of 0.19%.
The Invesco Energy S&P US Select Sector UCITS ETF has a Morningstar Medalist Rating of Bronze. It was launched in December 2009.
Xtrackers MSCI USA Energy UCITS ETF
Morningstar Rating: 3 stars
Expense Ratio: 0.12%
Morningstar Category: Equity Energy
The £54 million Xtrackers MSCI USA Energy UCITS ETF was the fourth-worst performing ETF in the second quarter, with a loss of 13.67%. The passively managed Xtrackers ETF performed worse than the average 3.87% loss on funds in the equity energy category. Over the past year, the ETF dropped 10.40% to land in the 77th percentile within its category, underperforming the category’s average one-year return of 0.19%.
The Bronze-rated Xtrackers MSCI USA Energy UCITS ETF was launched in September 2017.
Invesco Health Care S&P US Select Sector UCITS ETF
Morningstar Rating: 5 stars
Expense Ratio: 0.14%
Morningstar Category: Equity Healthcare
Fifth-worst was the £251 million Invesco Health Care S&P US Select Sector UCITS ETF, which lost 12.66% in the second quarter. The passively managed Invesco ETF fell further than the average 4.44% decline on funds in the equity healthcare category. Over the past 12 months, Invesco Health Care S&P US Select Sector fell 13.54%, finishing in the 56th percentile within its category. It dropped further than the category’s average loss of 9.50%.
The Invesco Health Care S&P US Select Sector UCITS ETF has a Morningstar Medalist Rating of Bronze. It was launched in December 2009.
iShares V PLC – iShares S&P 500 Health Care Sector UCITS ETF USD (Acc)
Morningstar Rating: 4 stars
Expense Ratio: 0.15%
Morningstar Category: Equity Healthcare
The sixth-worst performing ETF in the second quarter was the £1.7 billion iShares S&P 500 Health Care Sector UCITS ETF USD (Acc), which lost 12.66%. The passively managed iShares ETF fell further than the average 4.44% loss on funds in the equity healthcare category. Over the past year, iShares S&P 500 Health Care Sector fell 13.54%, placing it in the 56th percentile within its category and falling further than the 9.50% loss on the average fund.
The iShares S&P 500 Health Care Sector UCITS ETF USD (Acc) has a Morningstar Medalist Rating of Bronze. It was launched in November 2015.
SPDR S&P US Health Care Select Sector UCITS ETF
Morningstar Rating: 4 stars
Expense Ratio: 0.15%
Morningstar Category: Equity Healthcare
With a 12.64% loss, the £242 million SPDR S&P US Health Care Select Sector UCITS ETF was the seventh-worst performing ETF on our list for the second quarter. The passively managed State Street ETF fell further than the average 4.44% loss on funds in the equity healthcare category. Over the past 12 months, the SPDR S&P US Health Care Select Sector UCITS ETF lost 13.52%, placing it in the 55th percentile within its category and putting it down further than the 9.50% loss on the average fund.
The SPDR S&P US Health Care Select Sector UCITS ETF, launched in July 2015, has a Morningstar Medalist Rating of Bronze.
Xtrackers MSCI USA Health Care UCITS ETF
Morningstar Rating: 4 stars
Expense Ratio: 0.12%
Morningstar Category: Equity Healthcare
The eighth-worst performing ETF in the second quarter was the £474 million Xtrackers MSCI USA Health Care UCITS ETF, which fell 12.07%. The Xtrackers ETF, which is passively managed, fell further than the average 4.44% loss on funds in the equity healthcare category. Over the past year, the ETF fell 13.04% to place in the 51st percentile within its category, dropping further than the average one-year loss of 9.50%.
The Xtrackers MSCI USA Health Care UCITS ETF, launched in September 2017, has a Morningstar Medalist Rating of Bronze.
Invesco Markets II PLC – Invesco S&P World Health Care ESG UCITS ETF
Morningstar Rating: N/A
Expense Ratio: 0.18%
Morningstar Category: Equity Healthcare
The £76 million Invesco S&P World Health Care ESG UCITS ETF was the ninth-worst performing ETF in the second quarter, with a decline of 11.58%. The passively managed Invesco ETF performed worse than the average 4.44% loss on funds in the equity healthcare category. Over the past 12 months, the ETF dropped 15.19% to land in the 73rd percentile, falling further than the category’s average loss of 9.50%.
The Invesco S&P World Health Care ESG UCITS ETF has a Morningstar Medalist Rating of Bronze. It was launched in April 2023.
SPDR MSCI World Energy UCITS ETF
Morningstar Rating: 3 stars
Expense Ratio: 0.30%
Morningstar Category: Equity Energy
Tenth-worst was the £258 million SPDR MSCI World Energy UCITS ETF, which lost 10.48% in the second quarter. The passively managed State Street ETF fell further than the average 3.87% loss on funds in the equity energy category for the quarter. Over the past year, SPDR MSCI World Energy fell 8.34%, finishing the 12-month period in the 66th percentile within the equity energy category. It underperformed the category’s average one-year return of 0.19%.
The Gold-rated SPDR MSCI World Energy UCITS ETF was launched in April 2016.
What Are ETFs?
Exchange-traded funds are investments that trade throughout the day on stock exchanges, much like individual stocks. They differ from traditional mutual funds—known as open-end funds—which can only be bought or sold at a single price each day. Historically, ETFs have tracked indexes, but in recent years, more ETFs have been actively managed. ETFs cover a range of asset classes, including stocks, bonds, commodities, and most recently cryptocurrency.
Income ETFs are designed to offer regular, low-volatility dividends, regardless of market conditions
Valerio Baselli 20 May 2024
During this special week of content on income, we’re highlighting five high-yield exchange-traded funds (ETFs), with a Medalist Rating of Silver or Gold
For investors looking for funds that generate a regular income stream funds with exposure to the companies with the highest dividend yields are an attractive option.
These are products designed to offer regular, low-volatility dividends, regardless of market conditions.
What constitutes a good high-dividend strategy for passive funds? Today, income investors are increasingly attracted to ETFs because they’re easy to buy, transparent, and cheap.
Iinvestors should also looking for funds with stable payouts and constant dividend growth anyway, rather than the highest yield.
For dividend stock investors, there’s always the possibility of falling into a “dividend trap”, which is when a high yield masks problems with high debt and profitability and a dividend is cut or scrapped.
Dividend ETFs try to avoid this by balancing their yield from current income with the portfolio’s long-term capital growth. However, strategies may vary from fund to fund, and it’s worth understanding how often the portfolio gets rebalanced and what index the ETF is replicating.
Five Highly Rated Dividend ETFs
Below we list five income ETFs, with a Medalist Rating of Silver and Gold, each for a different geographic region. We’ve highlighted commentary by our team of analysts on passive strategies below:
iShares MSCI Europe Quality Dividend ESG UCITS ETF EUR (QDVX)
• Morningstar Medalist Rating: Gold
• Morningstar Category: Europe Equity Income
• Ongoing Charge: 0.28%
• 12 Month Yield: 3.36%
This strategy earns a Morningstar Medalist Rating of Gold. The analysis of the portfolio shows it has maintained an overweight in liquidity exposure and an underweight in volatility exposure compared with category peers. High liquidity exposure is attributed to stocks with a high trading volume, lending managers more flexibility. Low volatility exposure is rooted in stocks that have a lower standard deviation of returns. This particular ETF is overweight technology by 4.9 percentage points in terms of assets compared with the category average. The portfolio is positioned across 81 holdings and is relatively top-heavy. Of the strategy’s assets, 30.5% are concentrated within the top 10 holdings, compared to the category’s 19.0% average. Fees (0.28%) are among the lowest in the category.
SPDR® S&P US Dividend Aristocrats UCITS ETF (UDVD)
• Morningstar Medalist Rating: Silver
• Morningstar Category: US Equity Income
• Ongoing Charge: 0.35%
• 12 Month Yield: 2.14%
This US-focused strategy shows a greater presence of mid- and small-cap stocks than its peers within the Morningstar category, and the portfolio has maintained an overweight exposure to liquidity and quality stocks. In recent years, this fund has consistently moved towards higher volume stocks than its Morningstar peers. This gives managers greater flexibility during bear markets to sell without adversely affecting prices. In recent months, the strategy has been more exposed to liquidity factors than its direct competitors. The strategy has also had a defensive bias.
Performance-wise, the ETF has been sub-par over the short term but strong over the long term. Over the past five years, the fund slightly underperformed the category index (a benchmark chosen by Morningstar for the peer group) 0.36 percentage points, but outperformed its average peer by 1.4 percentage points. More importantly, on a 10-year basis, this share class led the index by an annualised 0.75%. It has also been leading the index with a higher risk-adjusted return over the trailing 10-year period. Often, higher returns are associated with more risk. However, this strategy stayed in line with the benchmark’s standard deviation. As well as its low cost (0.35%), these factors earn it a Medalist Rating of Silver.
L&G Quality Equity Dividends ESG Exclusions UK UCITS ETF (LDUK)
• Morningstar Medalist Rating: Silver
• Morningstar Category: UK Equity Income
• Ongoing Charge: 0.24%
• 12 Month Yield: 5.00%
The analysis of this strategy’s portfolio shows it has maintained a significant overweight position in quality exposure and yield exposure compared with category peers. It invests in stocks with low financial leverage and strong returns on equity, giving it a high exposure to quality. These holdings also tend to be high dividend-paying or buyback stocks. The portfolio – which is positioned across 37 holdings and is relatively top-heavy – is overweight in financial services and basic materials relative to the category average by 29.9 and 3.6 percentage points, respectively. This ETF maintains a sizeable cost advantage over competitors, priced within the cheapest fee quintile among peers (at 0.24%), and earns a Morningstar Medalist Rating of Silver.
This strategy earns a Morningstar Medalist Rating of Gold. Over the past three-year period, it beat the category index by an annualised 0.65 percentage points and outperformed the category average by 3.1 percentage points. And more importantly, when looking across a longer horizon, the strategy came out ahead. On a five-year basis, it led the index by an annualised 3.8 percentage points.
The fund’s risk-adjusted performance only makes its profile look better. The share class led the index over the trailing five-year period. These strong risk-adjusted results have not resulted in a bumpier ride for investors. This strategy took on similar risk as the benchmark, as measured by standard deviation.
The portfolio is overweight in technology and consumer cyclical relative to the category average by 4.4% and 2.7%, respectively. The sectors with low exposure compared to category peers are consumer defensive and financial services. The ongoing charge is 0.40%.
Fidelity Emerging Markets Quality Income UCITS ETF (FEME)
• Morningstar Medalist Rating: Gold
• Morningstar Category: Global Emerging Markets Equity
• Ongoing Charge: 0.35%
• 12 Month Yield: 3.62%
This fund maintains a sizeable cost advantage over competitors, priced within the second-cheapest fee quintile among peers. The portfolio has allocations in its top two sectors – industrials and basic materials – that are similar to the category. The sectors with low exposure compared to category peers are consumer defensive and communication services; however, the allocations are similar to the category. The portfolio is composed of 179 holdings and is diversified among those holdings. In its most recent portfolio, 20.2% of the portfolio’s assets were concentrated in the top 10 fund holdings, compared to the category average’s 35.5%.
The fund’s long-term track record is largely no longer applicable, as it is not necessarily representative of the current strategy. The new team took the reins in March 2022 and, looking at its performance so far, it has posted admirable results. For the most recent two-year period, the strategy garnered a 1.1% return through month-end, over its peers’ average 1.7% loss and the category index’s 1.0% loss. Taking risk into account, over the past year, the strategy had a similar standard deviation, a measure of variation of returns, to the benchmark. Morningstar analysts assign it a Medalist Rating of Gold.
The Slow and Steady passive portfolio update: Q2 2025
by The Accumulator on July 8, 2025
This time three months ago, the Slow & Steady passive portfolio was suffering under the strain of Trump’s one-man assault on the global trade system. But we’ve made up all our losses since then.
Indeed we’re now ahead, albeit by a none-too-convincing 1.6% year-to-date.
Our four equity funds have put on double-digit gains in the space of a quarter. Global property is dragging its heels though – and good old gilts continue to make me rue the day.
Here are the numbers. See the annualised returns column for the all-important long-term gains:
The Slow & Steady is Monevator’s model passive investing portfolio. It was set up at the start of 2011 with £3,000. An extra £1,310 is invested every quarter into a diversified set of index funds, tilted towards equities. You can read the origin story and find all the previous passive portfolio posts in the Monevator vaults. Subtract about 3% from the portfolio’s annualised performance figure to estimate the real return after inflation.
Stick or twist
I’m more convinced than ever that nobody (but nobody) can predict what’s around the corner.
Is the US market being slowly poisoned by political risk? Or is it the last bastion of economic dynamism in the Western world?
Flip a coin? Best of three.
I’m in no hurry to make a call. The political and commercial climate seems so changeable, I’d sooner make a claim for whiplash.
It’s funny how the more febrile the world becomes, the more obvious it should be – but somehow isn’t – that a passive strategy makes sense.
The thing is: we’re primed to look for new answers to new problems. Ideas, strategies, and products that are supposedly tailor-made to meet the moment.
It’s less the triumph of hope over experience than the triumph of marketing over rationality.
Perhaps there’s an analogy to be drawn between attitudes to passive investing and the apparent loss of faith in our democratic institutions?
Both realms offer the same old solutions. Products that can only achieve so much and suffer from a perceived lack of ambition in the age of moonshots. Results that are far from guaranteed and sometimes you must go backwards before you go forwards. Patience required.
The alternative? Roll the dice on a buzzy new venture fronted by a man with a tan promising the Earth.