You’re ten years from retirement: how to retire comfortably
Story by Marc Shoffman
Retirement planning is important for all ages but as costs rise, having a financial strategy in place can be all the more important as you get closer to your golden years.
Ten years is typically the recommended time to start laying the groundwork for retirement and considering how you will access your hard-earned pension savings.
A retiree would need a gross income of £52,000 to obtain that figure, according to Fidelity International and the asset manager suggests this would require a pension pot of around £700,000 at age 65.
That figure may rise if you are 10 years off retiring but it is worth considering how much you need to save into a pension to get to this pot size in the first place.
According to Fidelity’s projections, someone starting at age 25 would need to save £459 each month to reach that goal by 65, based on annual returns of 5%.
A 35-year-old would need to save £841 monthly, while a 45-year-old would need £1,703 a month – almost four times the commitment required at 25.
Start at age 55 and you would need to contribute £4,508 per month
Ed Monk, associate director at Fidelity International, said: “Our research figures show that many people are taking positive steps towards improving their retirement prospects – whether that’s increasing contributions or planning to retire early. But intention alone isn’t enough.
“With the cost of retirement rising and expectations shifting, it’s vital that savers understand what kind of lifestyle their savings can realistically support.”
Those figures may look scary but there are steps you can take to stay on track for a comfortable retirement.
We share a retirement checklist for those planning to leave the workforce in 10 years’ time.
1. Check your state pension forecast
The full state pension – currently at £11,973 per year – will help cover some of your expenses but the amount may depend on the future of the triple lock.
You can check your state pension forecast at Gov.uk and see if there are any gaps in your national insurance record that you could fill by purchasing extra credits to boost your payments.
However, the state pension age is on the rise and is set to increase from 66 to 67 in 2026 so you may have to wait longer for the money depending on when you retire
2. Get to grips with your pension pots
The 10-year point is a good time to consolidate your pension pot and boost your pension contributions to maximise those final years of saving.
Monk said: “The decade before retirement often coincides with peak earning years, use this time to maximise pension contributions and make full use of ISA allowances.
“Consolidating older pensions may also help reduce fees.”
Ross Lacey, director at Fairview Financial Planning says a good starting point is to track current expenditure, factoring in what will be different by the time you retire.
“The next steps are working out what you’ll need your pensions, investments and cash to look like, and to do for you, in order to make that plan viable
“Naturally, a professional financial planner does this with clients day-in-day-out.”
3. Reassess your investment strategy
Monk warns against de-risking too early but at some point you will need to consider moving out of risky equity products to get some security such as through bonds.
He suggests that five years is a good time to consider how you will access your funds such as through an annuity, drawdown or both, and whether you will still be able to afford your desired lifestyle.
Philly Ponniah, chartered wealth manager at Philly Financial, added: “This isn’t about moving everything into cash, but shifting the balance. You may want to reduce risk slightly while keeping enough growth assets to stay ahead of inflation.”
Once you are two years away from retirement, Monk suggests deciding how and when to draw different pots, and secure essential expenses with guaranteed income.
He said: “Check that your expected costs align with your lifestyle goals. Don’t forget to factor in inflation and any remaining debts.”
Many retirees follow the 4% withdrawal rule to ensure their pension pot doesn’t run out of cash.
At this point in your life, when you plan to retire in two years, Monk suggests updating your documents, such as reviewing your will, setting up powers of attorney and planning for long-term care.
4. Beyond pensions
A pension may be just one asset you use to fund your retirement and other routes include running a buy-to-let portfolio.
Kundan Bhaduri, from property developer The Kushman Group, suggests the 10-year point is a good time to stress test your property portfolio.
He said: “Will your rentals still deliver net income if rates stay high or tenants become scarce? Prioritise reducing debt on the properties you plan to hold.”
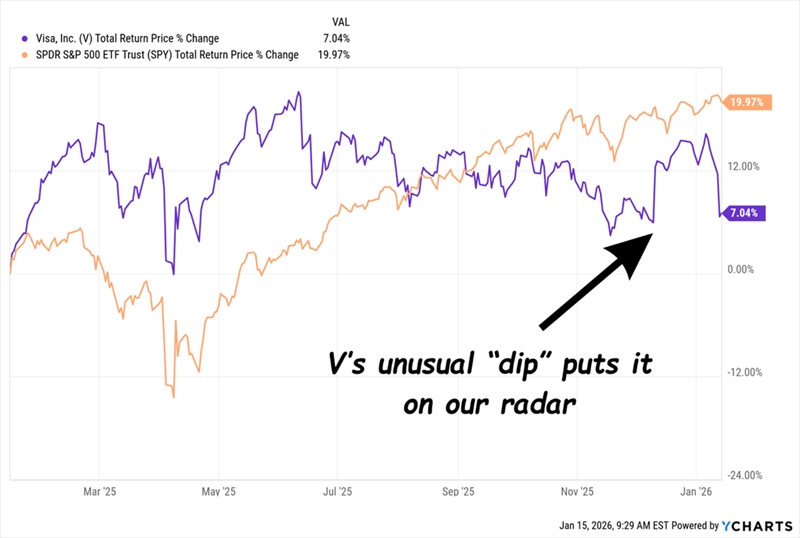
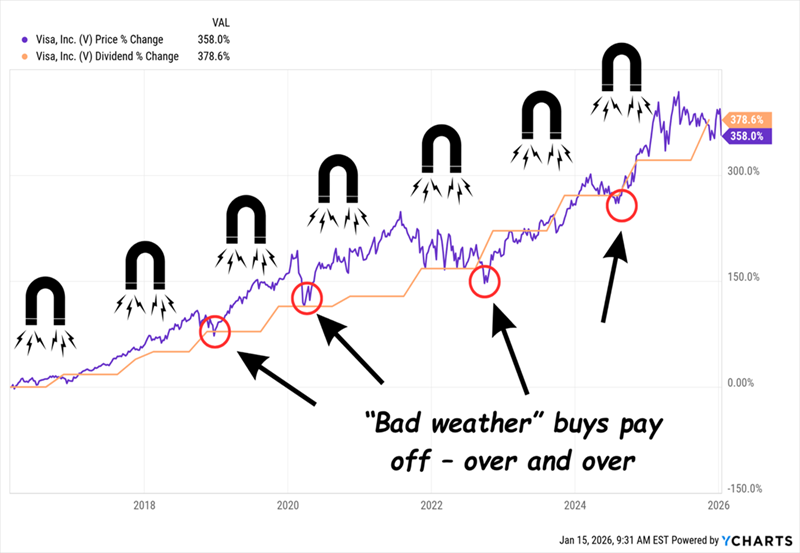
OR you could have a dividend re-investment plan and guess what you keep all your capital as well !!
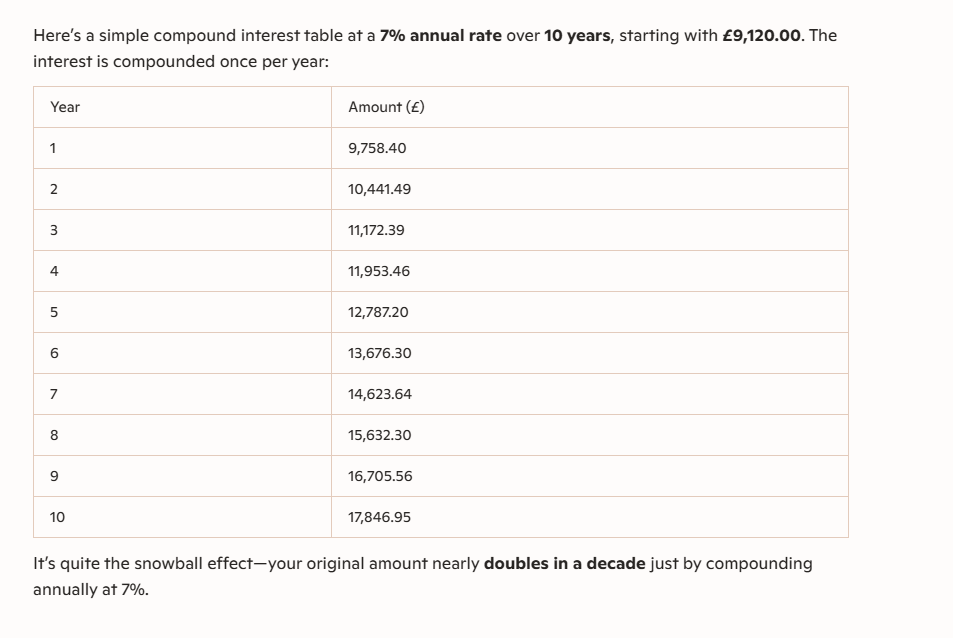
Especially if you don’t think you will have a retirement pot of £700,000 at age 65.

On the seed capital of 100k it would provide a pension of 17%, the Snowball started on the 09/09/2022. The current target yield for this year is 10%.
Remember with compound growth you stand to make more in the last few years of saving for retirement, than in all the early years.