
Why Bluefield Solar not Next Energy Solar?
The Oak Bloke
Jan 05, 2026

Belatedly picking BSIF for the picks for 26 a reader asked but why not NESF?
Oh ho. That old chestnut. Again. I compared NESF vs SEIT in 2025 and came out strongly in favour of SEIT. Would BSIF beat NESF? And while we are at it, what about BSIF vs SEIT?
Since I covered NESF in “is it crackin’” back in June it’s dropped -30% from 70p to 50p. Is that an opportunity too? Cheap enough to change one’s mind?
Let’s find out which ones are tidy.
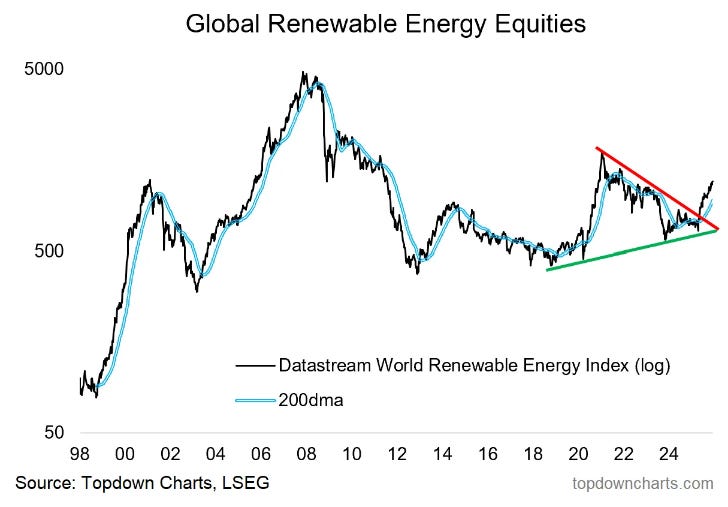
Generally I do feel the sector is over sold. This is an interesting chart I stumbled upon over at Topdowncharts.com that validates that view. How can that be happening if Power Curves are leading Renewables towards perpetual prices of doom? Of course Global Equities aren’t UK equities and we do have Ed Milli to contend with.
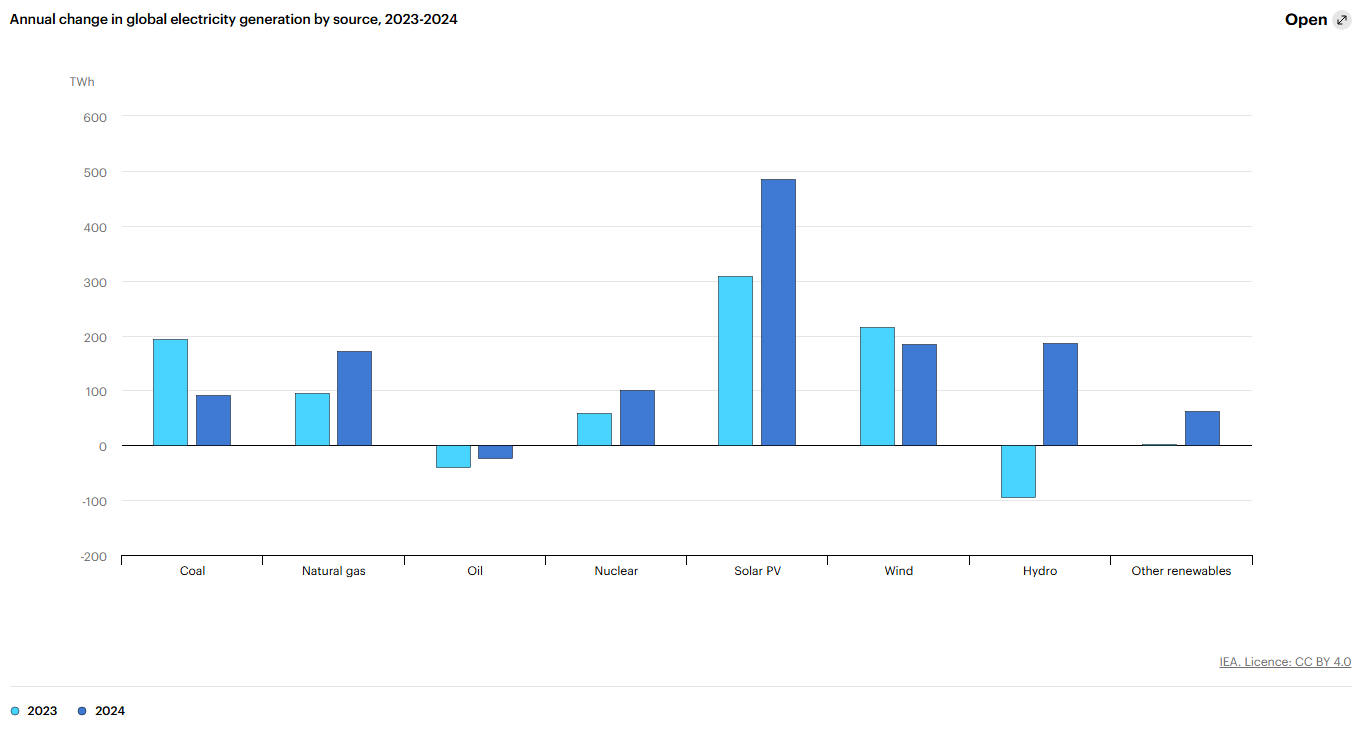
Worldwide electricity generation is growing by 100s of TWhs and Solar is leading the, ah, charge. Why is so much investment going into an asset whose income is in decline? Something doesn’t add up, and it’s my contention that it’s the power curves.
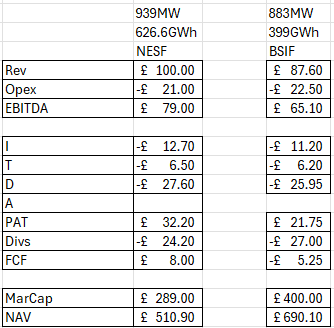
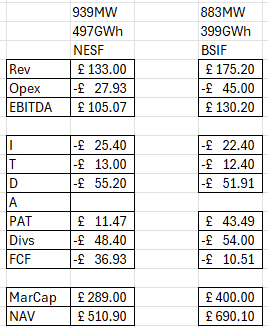
NESF: I’m going to compare the 1H26 at NESF vs 50% of the FY25 results at BSIF to take a view. I’m a bit shocked. BSIF comes back with a -£5.25m deficit post dividends and after imputing an adjusted net profit, while NESF shows +£8m adjusted FCF.
This is where I am ignoring the power curve nonsense of FV gains/losses and instead assigning a Depreciation number in relation to the MW Capacity of generation. It’s crude but we do know these panels depreciate over 30 years and valuing a business this way seems much more sensible than the FV judgments obscured and obsfuscated. Depreciation as a guide which approximately tallies with 1/30th of the estimated capex cost. Remember it is also considering repairs and upgrades. NESF considers this a form of “distribution” and in a way it is – the NAV increases through investment but if the investment is just to stand still – well that’s a P&L cost – whether you call it depreciation, repairs or maintenance. This was one of the other forms of obfuscation that irritated me with how NESF portray their accounts.
On the face of it NESF is the better investment. But then I start to ponder. NESF’s interim period is March to September. BSIF is 50% from Jan to Dec. Hmm. The sunshine breaks through and I realise I need to think about the seasons.
Of course the longer days of summer months are going to deliver a stronger result for Solar during April to September. On a frosty day like today that truth seems truer than ever. Duhhh.
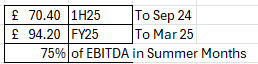
I find the EBITDA split is 75%/25% at NESF.
So if I increase the NESF EBITDA by 33%, and double the BSIF (remember I halved it before), and of course double the ITDA amounts (these are not seasonal), then we see quite a different result.
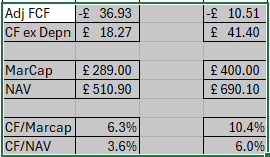
At current levels of dividends both trusts are “eating themselves” after you factor in depreciation, although on a cash basis NESF delivers £18.20m vs £42.4m at BSIF – post dividends.
In relation to the marcap you are in the long run much better off buying BSIF unless NESF falls to below 30p a share. That’s because NESF doesn’t appear to be keeping enough money to maintain its portfolio. Bear in mind these numbers are post dividend and NESF pays a higher dividend (as a percentage)
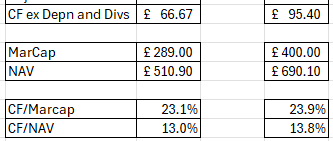
If we add back the dividend the difference between NESF and BSIF reduces to a much smaller difference, although compared to the NAV or the current share price BSIF does look the better pick generating 23.9p per £1 invested vs 23.1p.
But there are further reasons to choose BSIF.
NESF has a “sister co”. It has a first refusal but owns no development pipeline of its own. It has carried out no further disposals in 1H26.
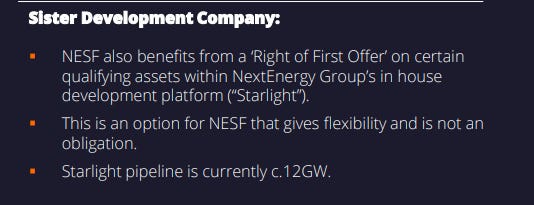
BSIF actually owns the pipeline and can sell these to its sister co the JV which it owns 25% of.
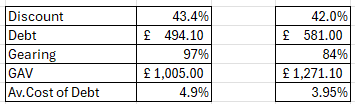
Some other metrics that catch my eye include BSIF has much better debt metrics cost in terms of average cost plus in terms of gearing. As debt gets run down the difference between NESF and BSIF would get more acute because BSIF cost of capital is 1% lower and it has less absolute debt and with no cliff edge (middle of Norfolk remember).
NESF it is fair to say has a slightly higher discount to its NAV: 43.4% vs 42%
From an income generation point of view SEIT exceeds BSIF on earnings as a proportion to its market cap and the cash flow relative to debt.
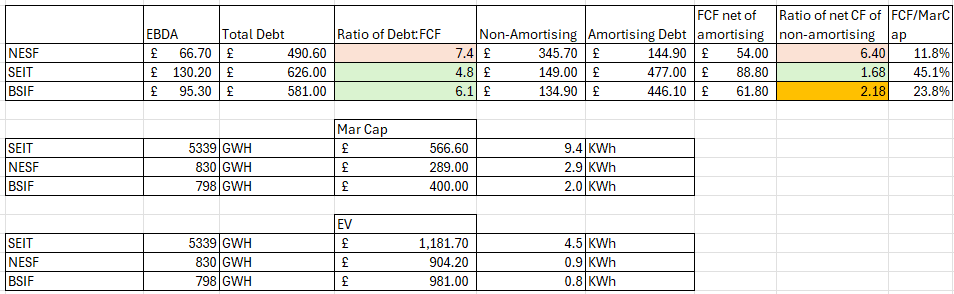
SEIT also exceeds BSIF from an energy generation/conservation per £ of market cap and enterprise value too. But BSIF exceeds NESF, by quite some way.
Conclusion
BSIF stands up well to NESF – if you compare it season for season.
BSIF also has the advantage of being sold – potentially – in 2026 as a going concern. That’s not the case for either NESF or SEIT (although some selected disposals are planned for SEIT and Saba have been buying SEIT and a continuation vote is planned)
BSIF as part of the picks for 26 stands up to the scrutiny of comparison with its peers. Yes the headline yield number is slightly lower but that’s because NESF continues to eat its own tail in my opinion. A high yield can be too high.
Regards
The Oak Bloke
Disclaimers:
This is not advice – you make your own investment decisions.

Thanks on your marvelous posting! I actually enjoyed reading it, you could be a great author.I will always bookmark your blog and will eventually come back very soon. I want to encourage you continue your great writing, have a nice day!