Michael Foster, Investment Strategist Updated: July 27, 2026
Imagine a credit fund that yields 15.3% and is built to deliver strong returns in all rate environments. That’s the promise of a closed-end fund (CEF) called the XAI Floating Rate & Alternative Income Trust (XFLT).
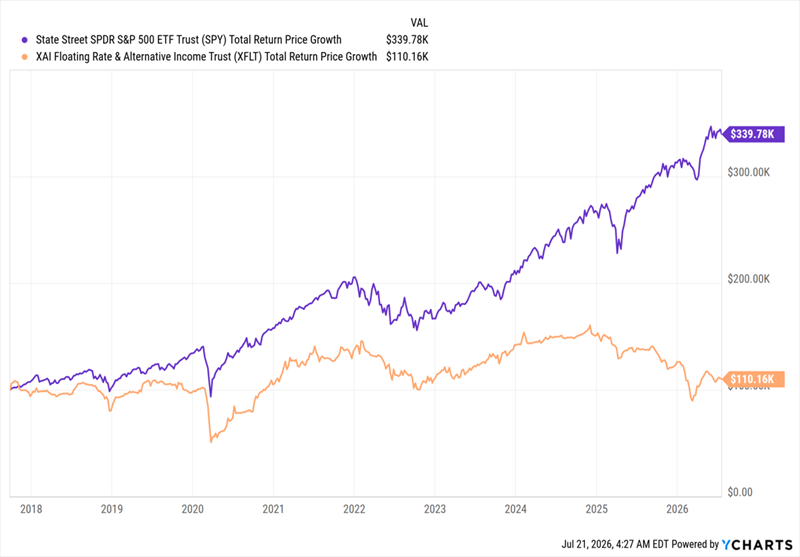
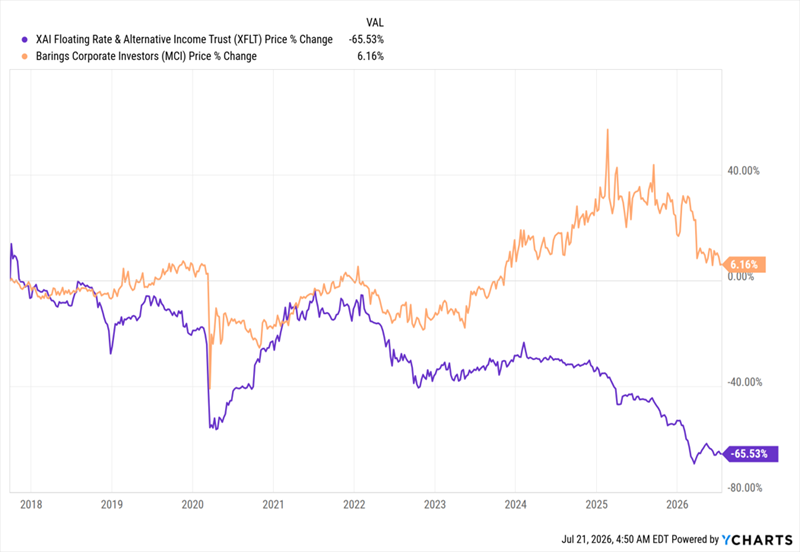
But the fund has, unfortunately, not backed that up with strong performance. As we can see in orange below, XFLT has badly lagged the popular S&P 500 index fund (in purple) since its launch in 2017.
A Laggard, Even With a 15.3% Yield
That performance amounts to just a 0.57% annualized total return! That’s less than many of the high-yield savings accounts offered by regional and national banks.
To make matters worse, XFLT comes with high fees, with a 7.56% total expense ratio, including leverage costs and 2.74% just for management. This is unsurprising given that the fund holds collateralized loan obligations (CLOs), which bundle floating-rate business loans and slice them into tranches by risk. The result is an asset that gives investors a piece of many different loans. These are most often used by large financial firms to diversify and to get exposure to different kinds of assets that each respond differently to interest-rate changes.
So what’s the appeal of this fund to everyday investors? Simple: the dividend yield.
If you look up XFLT on Google or Yahoo Finance, you’ll see an eye-popping number here: 15.3% as of this writing. That means that every $100,000 invested in XFLT would return around $1,275 in monthly income.
So the appeal is clear: a very large income stream—more than 15% of your investment back as dividends every year. Trouble is, XFLT’s income stream is far from reliable.
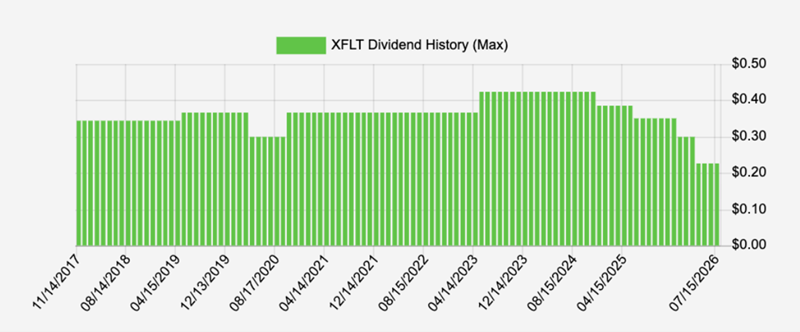
As you can see above, XFLT’s dividend has fallen over time, though most of that drop has been recent, so it’s possible to imagine an investor avoiding the payout cuts (or at least most of them) by selling within the last couple of years.
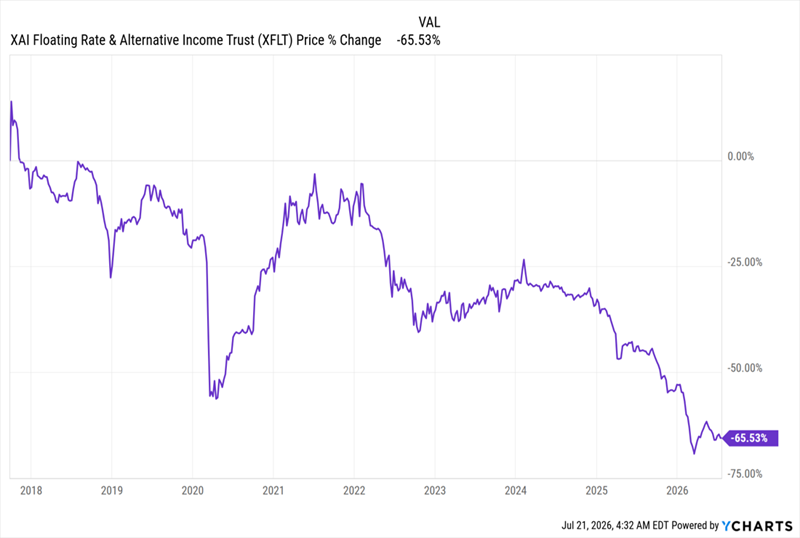
Unfortunately, making such a move would not have averted our second problem with XFLT: the crash in the fund’s share price.
XFLT’s Price Is a “Trapdoor” Under Its Dividend
An investor who sold XFLT any time after the IPO would have done so at a loss, and that loss has kept growing. To wit, an investor who was in at the start would be down $65,530 on a price basis on a $100,000 investment, as of this writing, from the IPO date, but would have collected about $75,000 from dividends, just barely outrunning the loss on price. This is hardly a winning investment.
Which brings us to another change happening with the fund.
Management Shakeup Adds Uncertainty
The firm that advises XFLT and ultimately decides what it will invest in is called Octagon Credit Investors. XFLT’s overall management firm, XA Investments, is seeking to replace Octagon with a subsidiary of King Street Capital Management in a shareholder vote ahead of a July 30 special meeting of shareholders. (King Street has has $30 billion in assets under management and $12 billion in CLOs.)
There’s just one problem: King Street doesn’t have much in the way of publicly available information about the performance of its CLOs, so there remains a lot of risk here, no matter how the vote goes.
As a result, it’s a good idea to sit back and see what happens with XFLT. While its 22% discount to net asset value (NAV, or the value of its underlying portfolio) makes it look like a potential rebound candidate, the risk that a new manager isn’t any cheaper or better at managing the fund means it’s better to look elsewhere.
And there are better places to look.
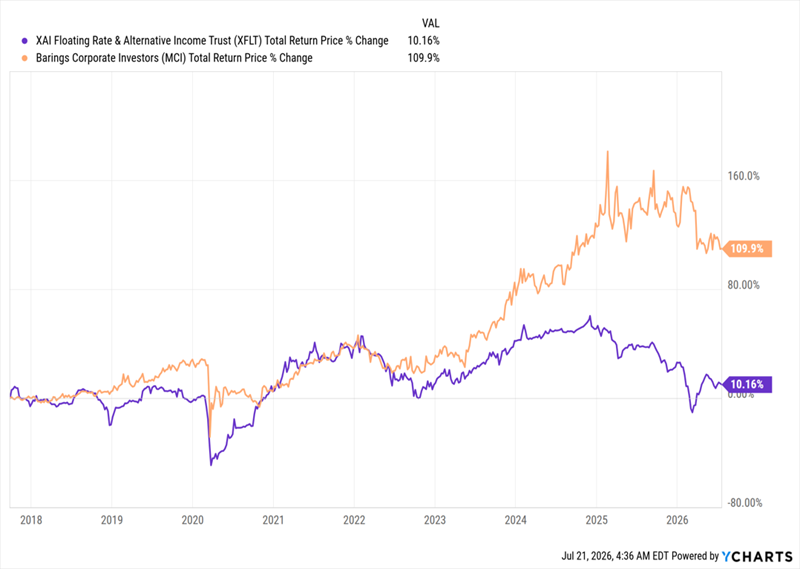
MCI: Smaller Dividend, (Much) Bigger Returns
Instead of XFLT, I’d consider picking up shares in another CEF called Barings Corporate Investors (MCI), whose total return since XFLT’s IPO (shown in orange above) has been literally 10 times better. It also boasts a stronger record on the payout front:
With a long history of payout hikes (going back to the 1990s), MCI has proven itself as an income generator over many different kinds of markets. Moreover, its 10% annualized total return over the last five years is impressive, and one more reason why this fund is worth considering.
To be sure, MCI’s yield is smaller than that of XFLT, but it’s not small by any means. At 9.5%, it’s still above the roughly 8% CEF average. Plus you’re getting that high income stream without sacrificing capital gains here.
MCI’s Sturdy Share Price Supports Its Payout
Above you can see that, purely on a price basis (or without reinvested dividends), MCI (in orange above) has vastly outperformed XFLT (in purple) over the last decade, putting it ahead of that fund on just about every count.
Finally, MCI is also a collection of business loans (in MCI’s case, mostly bank loans with some straight loans to corporations on the side), so we’re still getting cash flow from lending to firms, just with more sustainability and a stronger track record.
2 “Lonely and Uncomfortable” Dividends up to 12.3% We Love (One More Than the Other)
Brett Owens, Chief Investment Strategist Updated: July 28, 2026
When the world is burning—as it feels like it is now—it pays to remember the words of Howard Marks, the smartest money manager most people have never heard of.
The essence of Marks’s approach is contrarian thinking. In Chapter 11 of his excellent book, The Most Important Thing: Uncommon Sense for the Thoughtful Investor, he writes:
The ultimately most profitable investment actions are by definition contrarian: You’re buying when everyone else is selling (and the price is thus low), or you’re selling when everyone else is buying (and the price is high).
But he admits this isn’t easy: “These actions are lonely and uncomfortable.”
Lonely? Uncomfortable? That’s exactly how corporate-bond buyers feel these days!
We’re not just tipping our hats to these brave “loners.” We’re joining them with two “tossed-in-the-bin” bond closed-end funds (CEFs) paying up to 12.3%!
Rates Up, Bonds Down—But Something’s Got to Give
If you’ve been investing for income for a while, you likely know the golden rule of Bondland: When rates rise, bond prices fall (and vice versa). It’s simple—too simple, in fact! And it’s precisely why bonds are on the outs now.
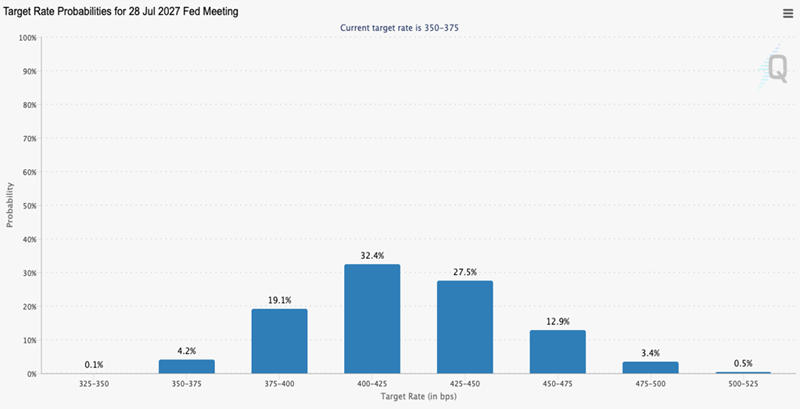
The Iran conflict is flaring. Oil (the engine of inflation) is spiking. And even Fed chair Kevin Warsh—appointed, remember, to cut rates—can’t seem to hold back the tide. Futures markets tell the tale: A year from now, they see two Fed rate hikes in the bag—and potentially more.
Source: cmegroup.com
I know. This does not sound like the best bond-buying setup. But here’s the thing: Everybody knows it. The mainstream crowd—folks Marks calls “first-level investors” because they buy and sell on headlines—has already sold.
That’s fine for us “second-level” thinkers who dig deeper: It means the bad news is priced in. It also means it won’t take much for these funds’ discounts to reverse course and shrink.
The bottom line? Now is the time to buy.
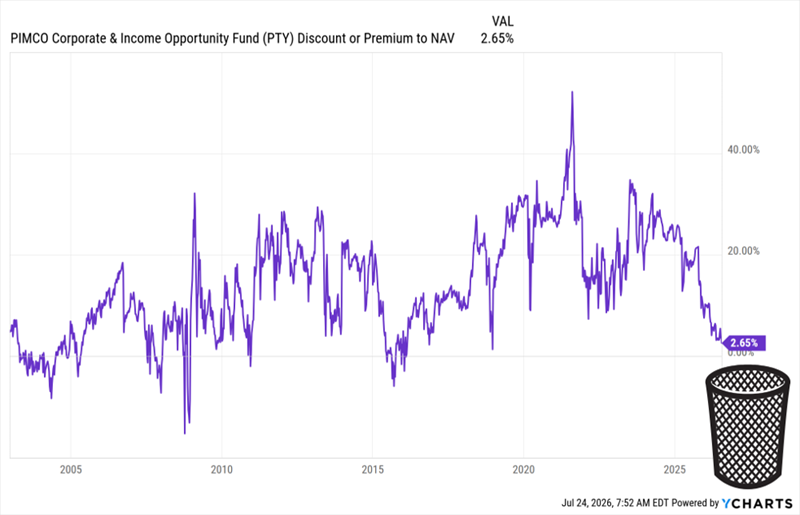
To see what I’m getting at, consider the discount on the PIMCO Corporate & Income Opportunity Fund (PTY), one of the biggest corporate-bond CEFs.
As I write, PTY trades at a 2.7% premium to net asset value (NAV). That doesn’t sound cheap, but thinking any premium means a fund is pricey is another first-level blunder. With PIMCO funds, premiums—particularly big ones—are normal because of the company’s cachet in the CEF space.
Over the last five years, PTY has traded at a 20% (!) premium, on average. Take a look at this chart, showing its path to the bottom of the bargain bin:
PTY Is Cheaper Than It’s Been in 11 Years
This is a chart of PTY’s premium since its launch in 2002. As you can see, it’s cheaper than it’s been since 2015—and far cheaper than it was in 2022, when rates soared on the heels of an inflation rate that streaked to 9%!
Even the most extreme forecasts don’t put us near that today. And PTY’s overdone premium-drop, despite that fact, is the first reason why the fund looks attractive now.
Then there’s the dividend. As I write this, PTY pays 11.9 cents per share, per month, for a hefty 12.3% yield.
Other than a slight adjustment, from 13 cents to 11.9 during the pandemic, that payout held steady, with the odd special dividend (the spikes and dips in the chart below), too:
PTY generates that income by handing its managers a wide mandate to scour the credit markets. The result is a portfolio that’s 59% US-based and mostly in high-yield bonds (29% of assets), non-US developed markets (16%) and emerging markets (17%).
The team at the top has also focused on bonds with a leverage-adjusted duration of 4.2 years. That’s a good place to be—long enough to rise significantly as rates fall, but not so long as to hurt substantially if rates surprisingly head higher than expected.
As I just hinted at, the fund does juice its returns by borrowing against roughly 29% of its assets. That’s modest and, again, will provide a tailwind as rates fall and PTY’s borrowing costs decline.
And yes, I do still see lower rates in the longer run. Let’s talk about that more before we move on to another corporate-bond CEF we like even more than PTY.
On the Interest-Rate Front, AI Beats Iran
When it comes to rates (or anything in investing), things rarely go in a straight line.
Despite the recent escalation in Iran, this conflict will eventually draw to a close. None of the participants in the conflict can afford any other outcome. Then there’s Warsh, who, as I mentioned earlier, Trump has charged with cutting rates. You can bet that as soon as the data allows him to justify such a move, he’ll push for it.
Third (and more important) is AI, which provides a sweeping level of automation to white-collar work that is highly deflationary.
In the 1990s, the Internet acted as a similar “deflator” on prices. The move from snail mail to email and from fax machines to web browsers made businesses wildly more efficient, which kept a lid on consumer prices—and a floor under bond prices. They rallied throughout the decade.
If rate cuts happen sooner, great. The discount on a buy made today will snap shut, giving us price gains on top of our double-digit bond-fund payouts. If it takes longer, fine. We’ll collect our divvies in peace (since these funds are already cheap).
Which brings me to another bond CEF I see as a savvy “second-level” buy today.
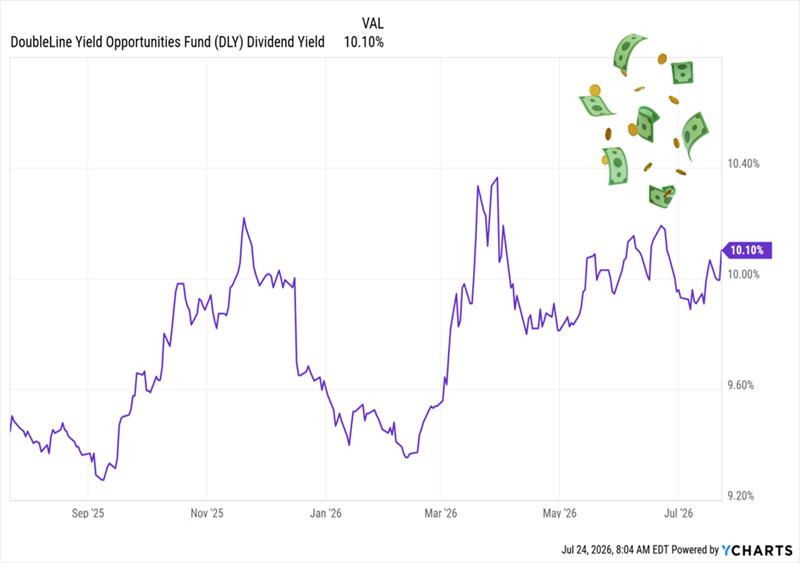
The “Bond God’s” 10.1% Payout
The 10.1%-paying DoubleLine Yield Opportunities Fund (DLY) is a holding of my Contrarian Income Report service that’s done exactly what we’ve wanted it to since we bought it in October 2021: deliver steady income.
The fund rolled down the skids at what would seem to be an inopportune time: February 2020, on the eve of the societal dumpster fire that was soon to ensue. But DLY’s manager, Jeffrey Gundlach (a.k.a. the “Bond God”) was the right manager for the time: He used the opportunity to snap up high-yielding bonds at discounts.
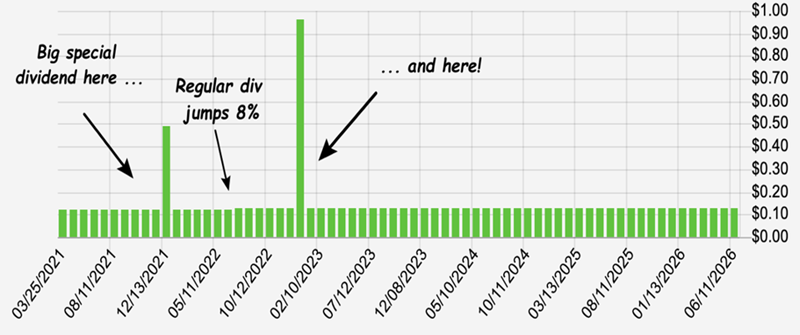
Since then, the fund’s dividend has been the picture of predictability, paying out steadily (and monthly) since launch, with two special dividends, to boot:
Then there’s the discount, which has also gotten cheaper over the last 16 months, dropping from a slight premium to a 7.7% markdown.
That’s way too cheap for a fund run by Gundlach, who’s got a wide mandate to scour the credit markets. The discount’s widening has also raised the yield to that sweet 10.1%.
DLY’s Discount Sends Its Dividend Higher
DLY, like PTY, is a textbook “Marks-style” contrarian play on today’s rate worries. We’re happy to grab this stout fund at a discount, and a historically high 10.1% payout, too.
This Ridiculously Cheap 12% Payer Is the “Perfect Pairing” for DLY
Let’s keep the payout party rolling by adding another fund that perfectly complements DLY. This one pays 12%, hands us payouts monthly and is also cheap, thanks to the investor temper tantrum over rates.
And take a look at this steady divvie:
Heck, it’s not just steady—it’s growing. So we’re left with a 12% payout that comes our way monthly, has grown, and regularly sends special payouts our way!
Many investors will tell you that such a thing simply can’t exist. Well, here’s the proof that they’re wrong. And with the world-class management team running this fund, we’ve got reassurance that they know how to weather any rate storm.
Since this one pays monthly, getting in now means our next payment is only a few short weeks (not months!) away.
for 15%+ total returns per yearregardless of what markets do next.
Hi, I’m Brett Owens, Chief Investment Strategist at Contrarian Outlook.
For most income investors, the problem isn’t a lack of opportunity.
It’s the false belief that higher returns require taking bigger risks.
They don’t.
Over the years, I’ve found that some of the most consistent 15%-per-year total returns come from boring, cash-rich dividend stocks that most investors overlook entirely.
I call this approach the Recession-Resistant Retirement Plan.
It’s built for investors who want to grow their income steadily—without chasing the next hot stock, speculating on unproven ideas, or placing bets they’d be uncomfortable explaining at the dinner table.
Because when it comes to funding your retirement, gambling on unicorns isn’t bold.
It’s unnecessary.
This isn’t about predicting recessions or timing market tops.
It’s about owning the kinds of dividend-paying businesses that keep generating cash—and rewarding shareholders—through inflation, slowdowns, bear markets, and everything in between.
Companies with durable cash flows.
Management teams that raise payouts consistently.
And balance sheets strong enough to support both dividends and long-term growth.
When you put those pieces together, something powerful happens:
You don’t just collect income. You position yourself for reliable 15%+ total returns—year after year.
And today I’m going to share my exact process with you. Then I’m going to give you …
The Time-Tested Way to Earn
15% Per Year From Dividend Stocks
— Without Taking Big Risks —
There’s a portion of the market most investors never bother to explore.
It’s filled with companies that look unremarkable at first glance—businesses that rarely make headlines, don’t dominate financial TV, and almost never show up in “hot stock” conversations.
That’s exactly why they’re so often mispriced.
Beneath the surface, these companies share a specific set of characteristics that quietly drive long-term returns:
Steadily rising dividends
Disciplined capital allocation
Stock prices that lag their underlying cash-flow growth
When those factors align, they create a powerful dynamic—one that allows patient investors to earn double-digit total returns with far less volatility than the broader market.
Over time, I’ve distilled this pattern into a simple framework I use to evaluate every income stock I consider.
It consists of three simple pillars.
We’ll get into all of the details in just a moment, but first, let me tell you a little bit more about myself …
Today I’m writing to you from Sacramento, where I live with my family. It’s an interesting time to be here, with the tech sector continuing to pour huge amounts of money into AI, and the technology starting to root itself in the broader economy.
You may have seen me on CNBC, Yahoo Finance or NASDAQ, where I’ve been called on to share my methodology for collecting consistent, predictable and reliable retirement income without making any wild, speculative bets that keep you up at night.
You see, I take a strategically contrarian approach to the markets.
And for the past several years, I’ve helped thousands of readers fund their retirement thanks to what I call “Hidden Yield stocks.”
For example:
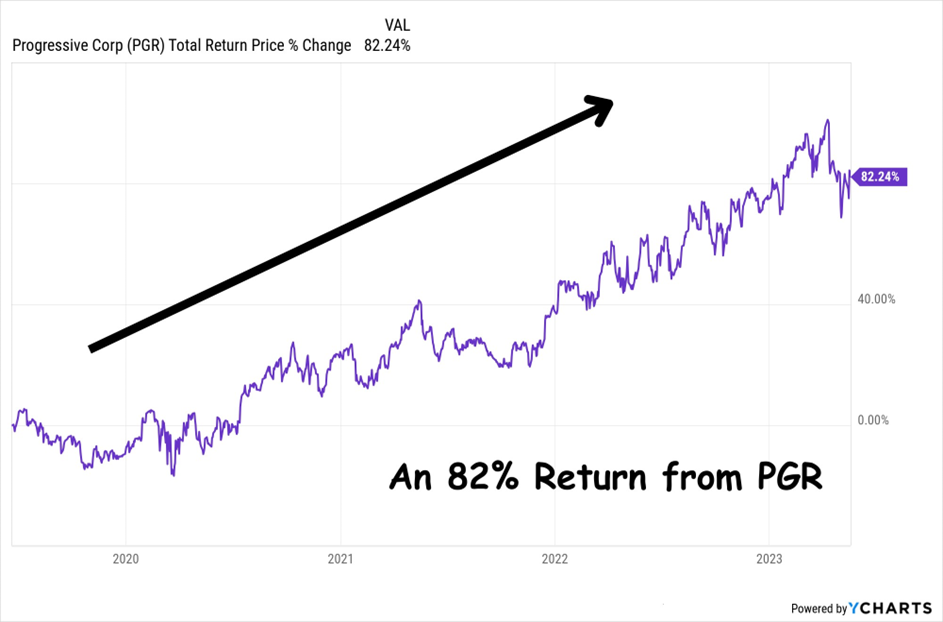
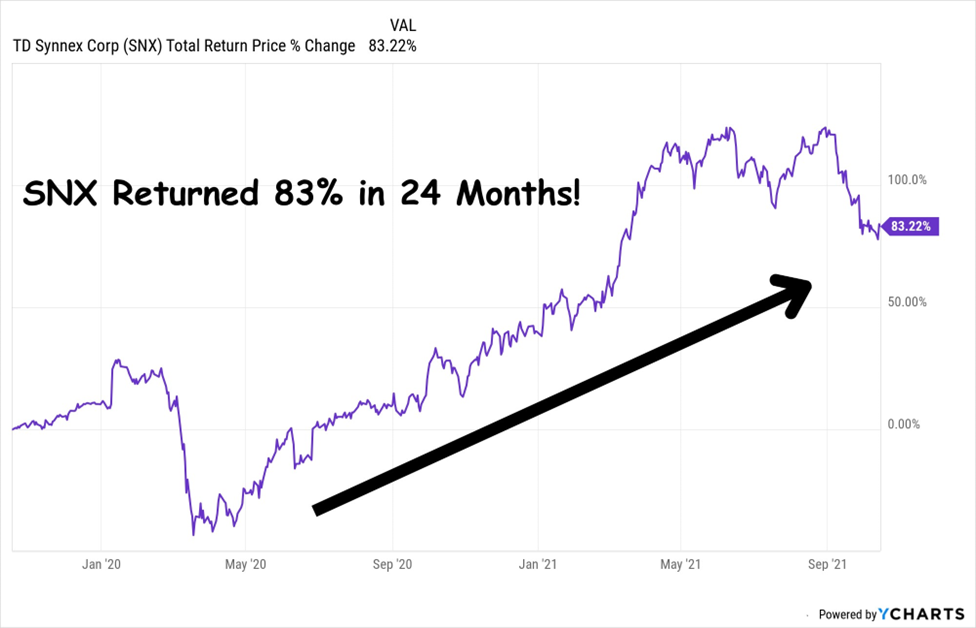
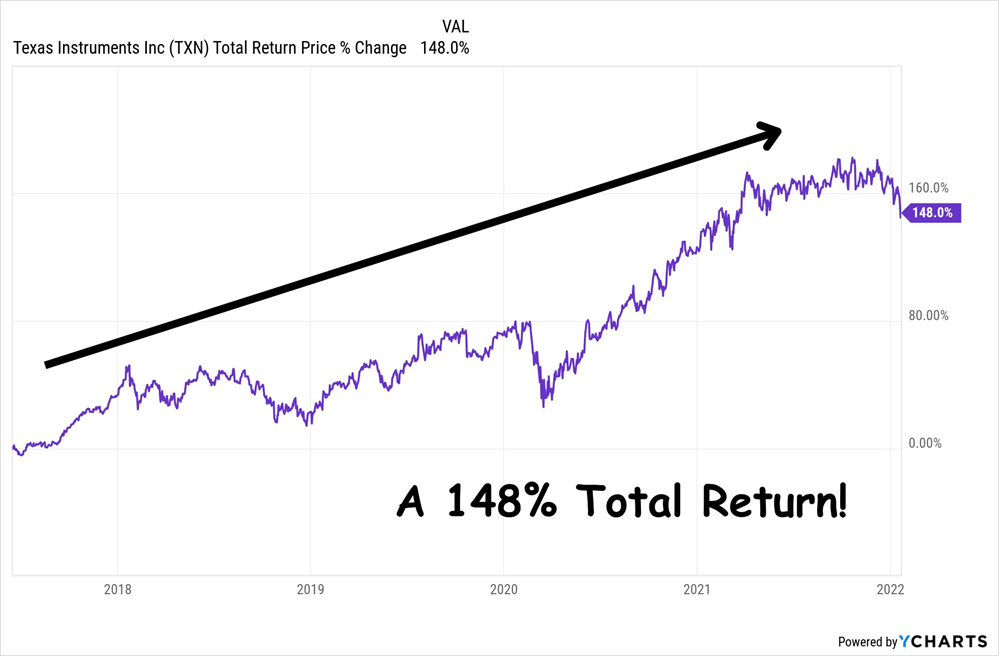
82% on Progressive Corp. in Just Under 3 years
22% on Microsoft in just 3 months
83% on Synnex Corp. in 24 Months
148% on Texas Instruments in just over 4 years
Now, I know these aren’t the huge 500% … 1,000% … or 5,000% overnight gains you hear other gurus CLAIMING they can get you.
But—as you’ll see in just a moment—outrageous claims like these are nothing more than overhyped promises designed to separate YOU from your money.
And to be clear, not all recommendations play out as well as the four examples above. Investing in the stock market is inherently risky, and some recommendations have lost money.
So we level-headed contrarians don’t chase unicorns.
We don’t listen to smiling swindlers.
We don’t put our family’s futures in jeopardy.
Instead, my readers and I focus on …
Doubling Our Money Every 5 Years with
15% Total Returns Per Year on Little-Known
“Hidden Yield Stocks”
However, this is just one small part of what I do.
My real aim is to help investors safeguard their retirement from recessions with low-volatility—but highly lucrative—investments that consistently pay you, whatever direction the market goes.
This method lies very close to my heart and ethics.
You see, my first experience in the markets was brutal …
It was 2003, and I’d recently graduated from Cornell University and was designing computer systems for Fortune 500 companies. For the first time in my life, I was making money. So I decided to hire a broker to help grow my savings.
This guy had countless credentials and certifications, years of experience, and he talked a great game.
Without hesitation, I hired him.
The result?
Just one year later, this so-called expert had literally lost nearly ALL my money. Everything. Years of saving and investing, gone.
As you can imagine, I was furious. However, thanks to this experience, I came to a huge breakthrough. I realized that nobody is EVER going to care about MY money, MY future, MY retirement and MY family as much as I do.
And, I realized, if I wanted to retire rich, I needed to take control of my money.
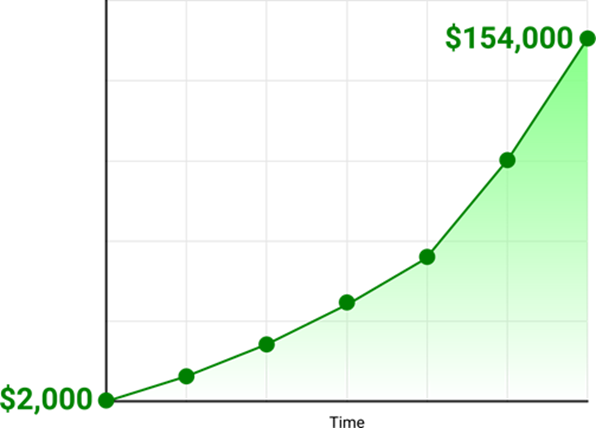
Anyway, with this realization, I decided to learn everything I could about investing. I was absolutely relentless. And after a few bumps in the road, it paid off, starting with a measly $2,000 that I turned into $154,000 in just 48 months!
Obviously, this sort of performance doesn’t go unnoticed …
Shortly afterward, I was invited to join a famous financial publication as an editor.
At first it was great. We helped our readers take home huge profits, exponentially grow their portfolios and finally create the financial freedom they’d been chasing their whole life.
However, as time passed, things started to change …
Instead of focusing on secure, safe stocks with huge upside, they started recommending all sorts of highly speculative, high-risk “investments” like obscure cryptocurrencies, volatile penny stocks and many other questionable opportunities.
Anyway, this didn’t sit well with me.
I believe financial analysts like me have an ethical and moral duty to help our readers safely grow their money—not recklessly gamble it away on some pie-in-the-sky idea.
Which is why I decided to set up my own research firm—Contrarian Outlook.
Since inception, the goal of Contrarian Outlook has been simple:
All without making any highly speculative bets you can’t tell your spouse about … without trying to time the markets … without the can’t-sleep-at-night worries … and without putting your retirement at risk!
Today I want to share five of my recession-resistant “Hidden Yield Stocks” with you.
My research indicates each of these investments could deliver 15% total returns per year – even as we stumble towards a recession.
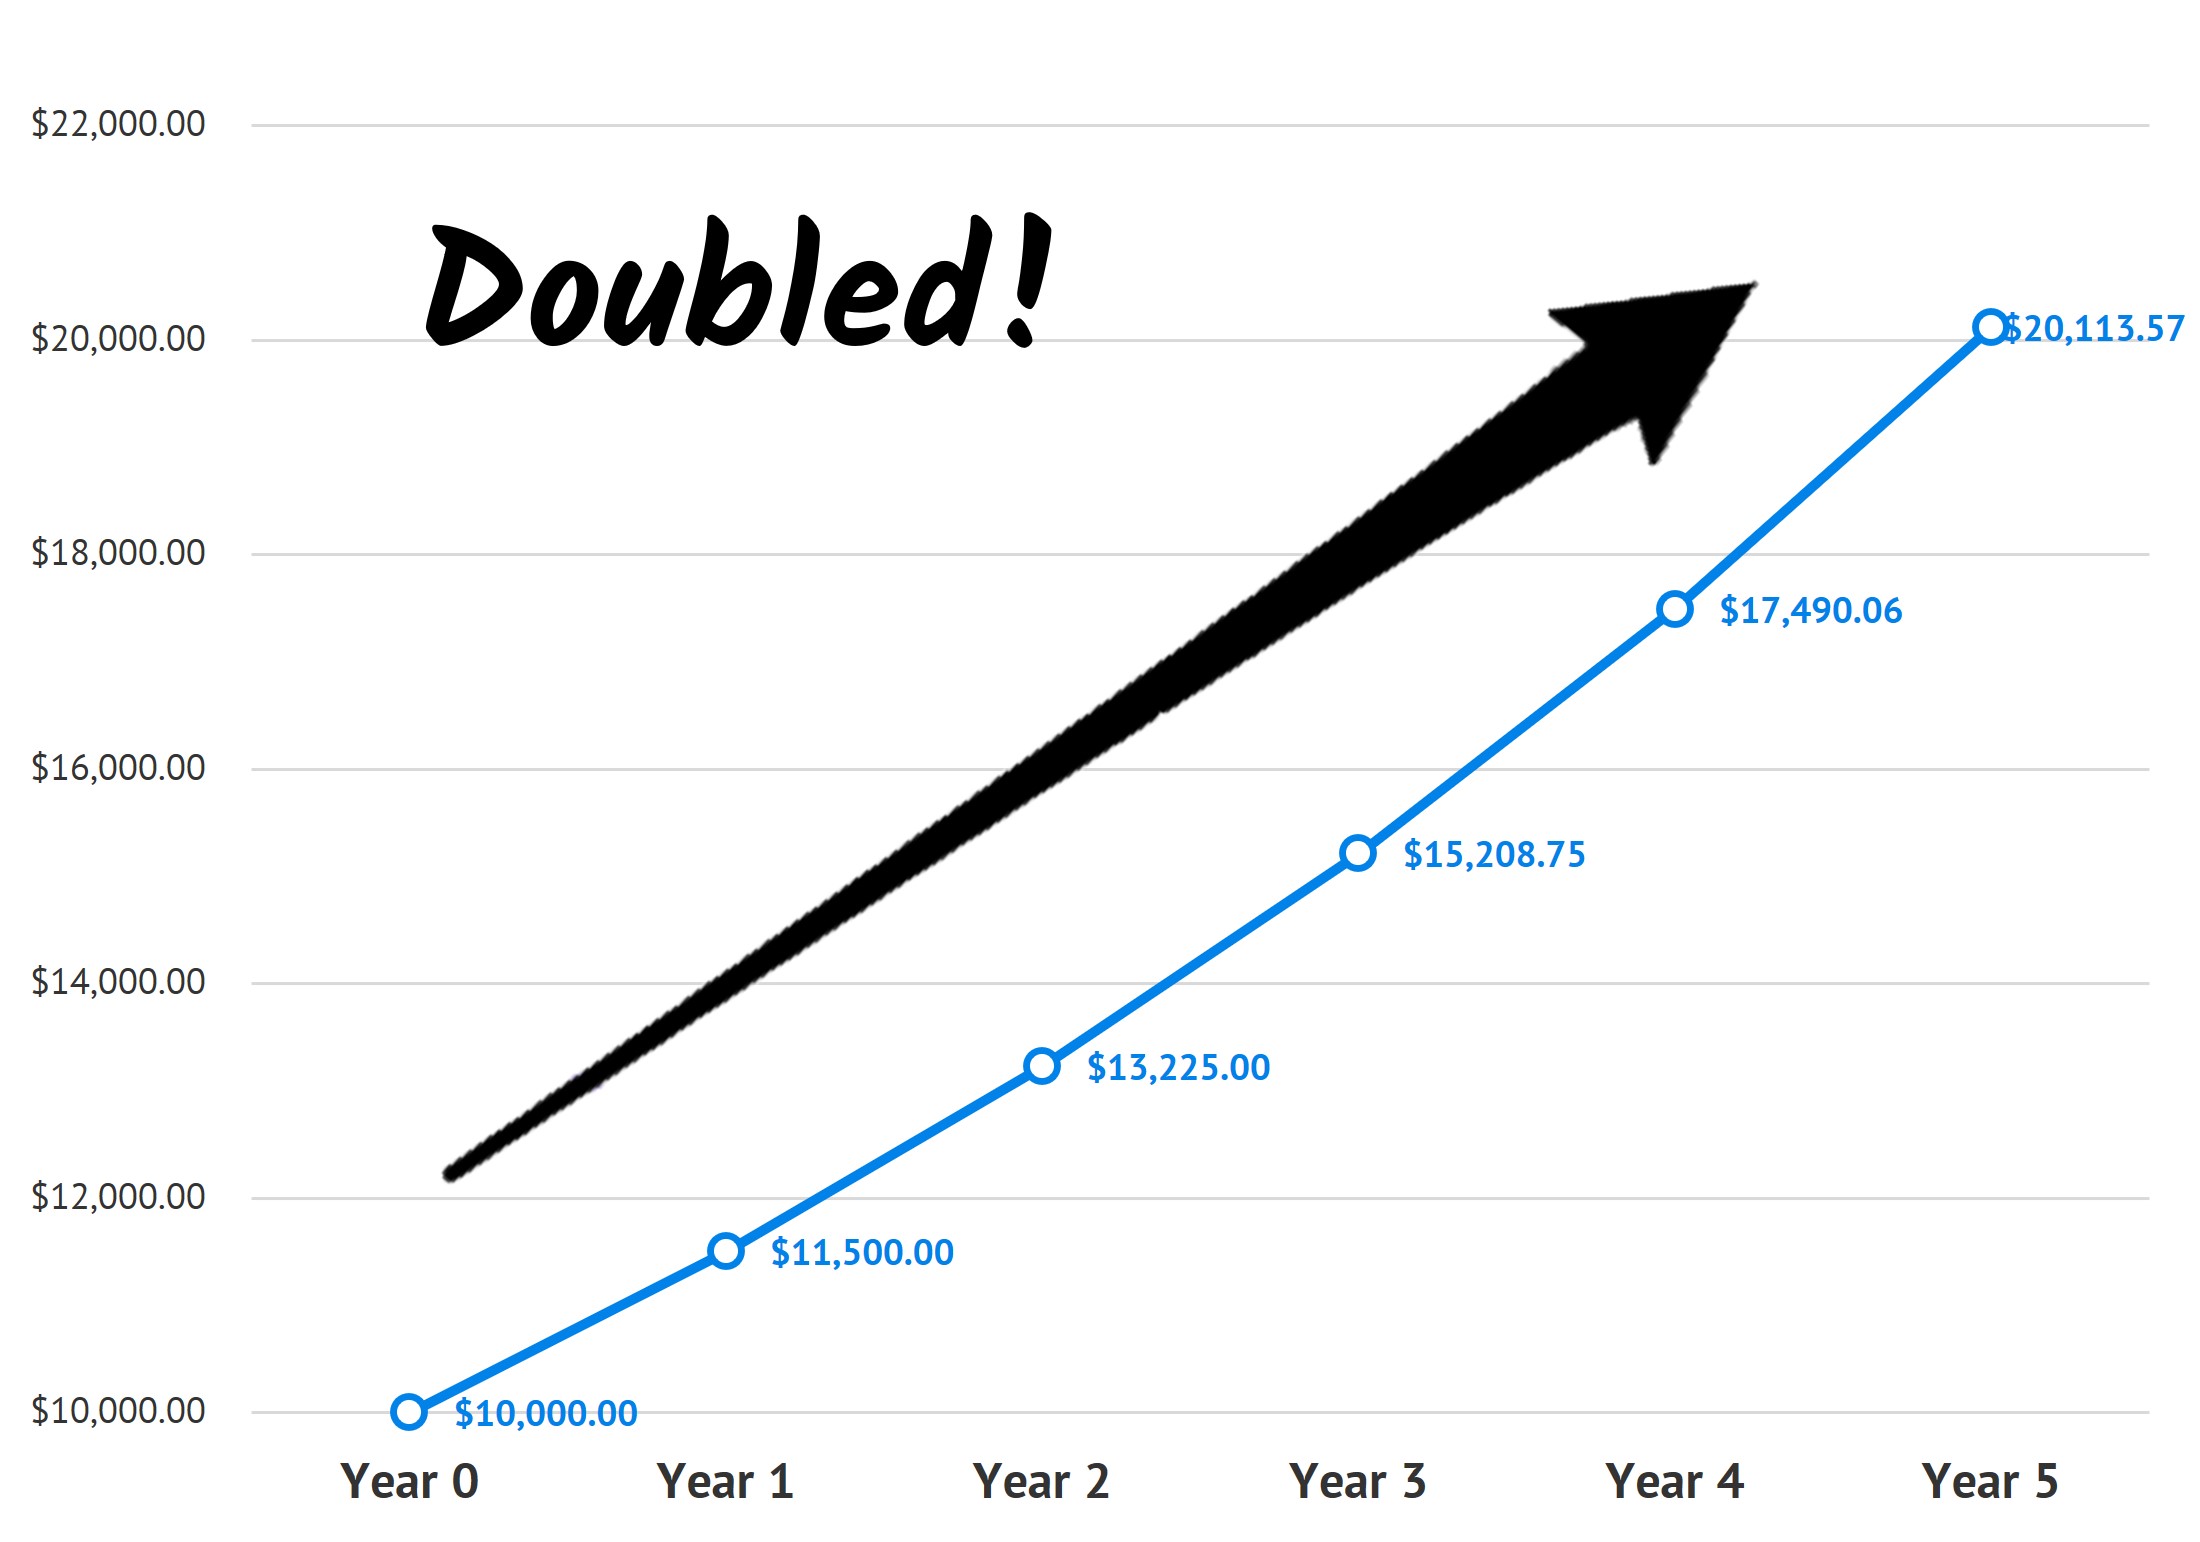
As you can see in the chart below, that’s enough to double your money every 5 years!
15% Average Annual Return on $10,000 Compounded Over 5 Years
Still skeptical?
Good. I would be, too.
Which is why I don’t expect you to just take my word for this.
Instead, I’m going to prove everything to you.
I’ll walk you through my investment approach. I’ll show you how to identify these “Hidden Yield Stocks.” And I’ll give you the cold-hard evidence that proves you can double—even triple—your portfolio without taking on any unnecessary high-risk bets.
Then I’ll give you 5 of my favorite recession-resistant “Hidden Yield Stocks” to buy now.
Here’s the Time-Tested Way to Make
15% Per Year From Stocks
There’s an untapped portion of the market few people know about …
It’s filled with stocks that seem “boring” to the uninformed investor…
Companies that rarely get coverage from the mainstream media …
Contrarian investments that are hiding their true potential …
However, if you look below the surface and read between the lines, these “Hidden Yield Stocks” offer intelligent investors the opportunity to deliver 15% total returns per year—no matter what the wider market does.
How?
Well, the answer lies in what I call “The Three Pillars.”
Pillar #1 – Consistent Dividend Hikes
Pillar #2 – Lagging Stock Price
Pillar #3 – Stock Buybacks
Together, these three pillars allow us to identify the stocks that are undervalued … overlooked … recession-resistant … and primed for major growth.
And by investing exclusively in these “Hidden Yield Stocks,” we can enjoy massive upside with very little downside … plus collect regular, reliable income through healthy dividend payouts!
As I said, today, I want to give you 5 of my favorite “Hidden Yield Stocks.”
But first, let me briefly explain each of the Three Pillars and show you how it helps to predict—with pinpoint accuracy—the direction a stock is going to take.
Pillar #1 – Consistent Dividend Hikes
Most investors approach dividend paying stocks backward.
Here’s how it usually works …
An investor will scan the markets looking for stocks paying a high dividend. After all, if a company is currently paying a high yield, it’s a great investment, right?
Dead wrong!
In fact, looking at the CURRENT yield is one of the slowest ways to grow your money.
You see, if you’re focused on current yields, you’re too late to the party. All the major gains have already been made. You’ll need to settle for earning a paltry 4%, 5%, maybe 6% per year … with minimal stock-price appreciation, too.
Sure, chasing high current yields will provide you with instant gratification, but it won’t give you the recession-resistant income … or the 15% year on year returns we want.
Instead, you need to focus on consistent dividend hikes.
In my opinion, selecting companies with a proven track of increasing their dividend payments is one of the safest, most reliable ways to get rich in the stock market. You see, every time a company raises its dividend, you start earning more from your original investment.
For example:
On a $1,000 initial investment, $30 in dividends equals a 3% return. Later, if the dividends go up to $40 a year, you are effectively earning 4% on your initial $1,000 investment.
As this trend continues, you could easily be earning 10%, 15%, even 20% per year just from rising dividends, as your initial investment never changes.
However, this ever-growing income from dividend hikes is just ONE part of the puzzle. To engineer real growth and quickly double an initial investment, we must combine Pillar #1 with the next two pillars of “Hidden Yield Stocks.”
Pillar #2 – Lagging Stock Price
After years of active investing, I’ve only ever found one surefire way to predict whether a stock will go up or down.
I call it the “Dividend Magnet,” and here’s how it works …
After you’ve identified stocks that are built on the foundations of Pillar #1 (consistently hiking their dividends), you want to narrow your search to companies whose share price LAGS behind the rate of dividend increase.
Why? Well, it’s simple really …
Share prices almost always increase as dividends increase.
This is because as a company hikes its dividend, mainstream investors tend to flock to the stock, chasing the new, higher yields. And this inevitably bids up the share price.
Let me give you a few examples where the dividend acts like a floor to keep bumping the share price higher:
Hershey: Dividend Up 135% Share Price Gains 122%
Mastercard: Dividend Up 691%, Share Price Gains 659%
AbbVie: Dividend Up 312%, Share Price Gains 364%
As you can see in these examples, the stock price lags behind the dividend increases at some point in time …
However, as more investors notice the company’s soaring dividend and buy in, the price lag closes—sending the share price soaring.
So, by investing in the right companies whose share prices have fallen behind despite consistent dividend hikes, you can buy the stock, safe in the knowledge the Dividend Magnet will eventually pull the price up.
Now, investing with Pillar No. 1 and No. 2 alone would stand you in great stead.
However, there’s one final Pillar of a “Hidden Yield Stock” that can rapidly accelerate both the share price and dividend payouts …
Pillar #3 – Stock Buybacks
Uncovering companies that are buying back their stocks is one of the fastest ways to accelerate your gains.
You see, when a company buys back its stock, it is improving every single “per share” metric investors watch (earnings, free cash flow, book value, etc.).
After all, if a company reduces the number of its shares by 50%, its earnings per share will automatically DOUBLE without any actual increase in profits. And I probably don’t need to tell you what will happen next …
Investors quickly bid up the stock’s price to bring it back in line with the value it was trading at before. Indeed, my research shows that simply investing in stocks that are reducing their share counts can help you beat the broader market’s performance.
And it’s important to bear in mind that S&P 500 companies are sitting on huge piles of CASH (more than $1 trillion in all!). They’re rolling out fresh buybacks amid continued economic growth post-pandemic, and they’re getting a nice upside kick in return.
You can see this just by looking at the shares of Union Pacific (UNP), which took an impressive 31% of its stock off the market in 10 years, helping drive a 100% gain in the share price!
And that’s just one example. By targeting cash-rich companies that either continue to buy back shares now or have a long record of doing so (even if they’re holding off today), you can set yourself up for HUGE price gains.
In short …
Combine the Three Pillars … Buybacks,
Dividend Hikes and Price Lags, and Your
Yearly Returns Can Be Absolutely Astounding
My favorite example of dividends and buybacks working in tandem to yank up share prices came in the form of our Mondelez International (MDLZ).
I recommended Mondelez in April 2020, as the world was shutting down. The stock looked cheap … was consistently growing its dividend payments … and management was aggressively buying back shares.
These three pillars told me the stock would skyrocket. And just take a look at what happened …
Over the next three years, Mondelez reduced its share count by 4.6% (orange line in the chart above) while raising its dividend a whopping 35% (blue line).
The market quickly responded, and the stock delivered a 39% price gain (purple line) by the time I recommended selling.
Put it all together and that’s a 48% total return (green line) in just 3 years from a relatively boring (at the time!) company.
Of course not all of my recommendations work out exactly like this one … some better, some worse… and I’m no longer recommending MDLZ today.
But this example shows you that you don’t always need to take big risks or invest in things you don’t understand. All you need to do is sniff out these “Hidden Yield” stocks before the mainstream crowd catches on.
With These 3 Pillars, Uncovering Safe,
Secure Stocks Set to Return 15% Per Year
Is Like Shooting Fish in a Barrel
However, it still takes a lot of work …
You see, although these three pillars can help you beat the market, double your portfolio and enjoy true security in your retirement, you also need to analyze these “Hidden Yield Stocks” in excruciating detail before investing.
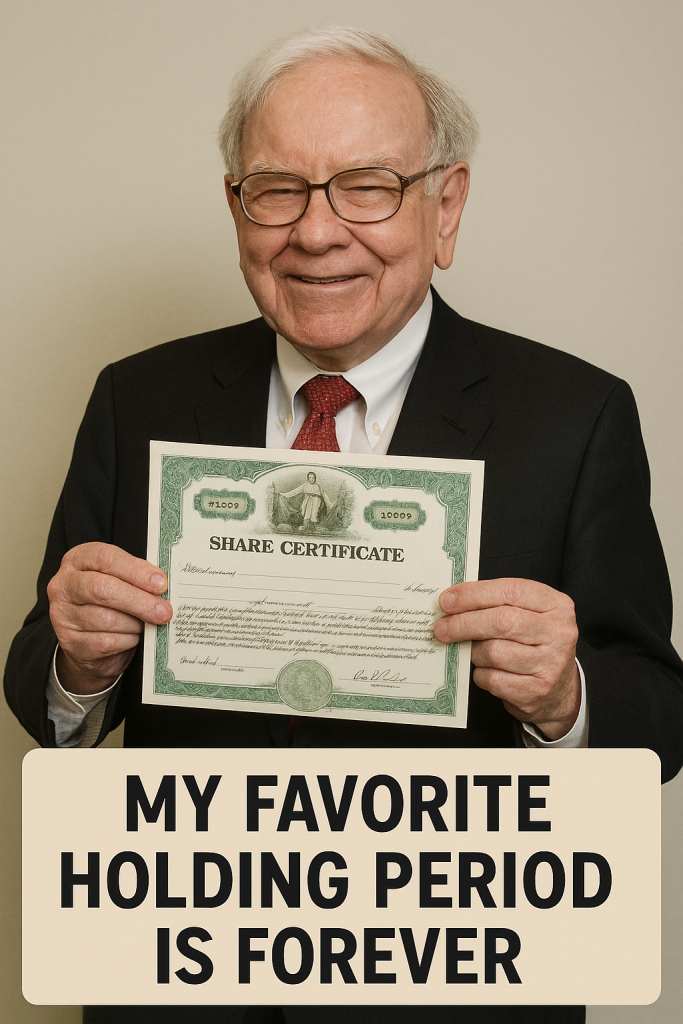
Warren Buffett just collected another $204 million from Coca-Cola — a reminder that some of the most powerful returns on Wall Street come from patience, dividends, and owning the right business for decades.
Here’s how that payout breaks down, why Coca-Cola keeps funding Berkshire’s war chest, and what this kind of compounding looks like in real dollars.
Coca-Cola has been one of Warren Buffett’s signature bets since the late 1980s, and it’s still paying like clockwork.
Berkshire Hathaway owns 400 million shares, and Coca-Cola’s $0.51 quarterly dividend just delivered a $204 million payout. Sometimes the biggest wins aren’t dramatic. They’re automatic.
Coca-Cola dividends now bring Berkshire over $800 million a year, far beyond the original $1.3 billion cost. Coca-Cola may have its “secret” headlines, but Buffett only cares about one secret: the dividend arriving every quarter.
Why Coca-Cola Still Matters Coca-Cola isn’t just a dividend machine, it’s still a modern profit engine.
With a market cap around $289 billion and gross margins above 61%, the company keeps doing what it does best: defend pricing power, stay everywhere, and find small ways to sell more. Mini cans. Convenience-store pushes. Product tweaks that look boring up close, but scale fast when you’re global.
That durability is why some Wall Street analysts still see upside, with price targets reaching $80. This implies that Coca-Cola is still being priced as a cash machine with staying power. And for Berkshire, that’s the whole point. No hype. No chasing trends. Just owning a durable cash machine, year after year, and letting dividends and compounding do the heavy lifting.
This is where most investors get caught. They chase the hot stock, the pop, the quick win, and end up trading emotions instead of building wealth.
Buffett plays a different game. He doesn’t need to react to every headline. He owns businesses that pay him, then lets time and dividends do the work.
The difference isn’t access to information. It’s behavior, and the traders who last tend to rely on rules, not emotion, like stop-loss and take-profit orders
Why This Dividend Story Matters That $204 million payout is more than a headline number. It’s what long-term investing looks like when the business is durable and the cash flow is real.
While plenty of investors chase the next spike, Buffett’s Coca-Cola stake shows the quieter path: own a high-quality company, let the dividend stack up, and give compounding time to do its job. You don’t need to love soda to take the point, you just need to respect what consistent payouts can build over decades.
Buffett’s Coca‑Cola dividends today: Berkshire Hathaway collects between $816M and $848M per year in cash dividends from its 400 million KO shares, depending on the specific year’s dividend rate. This is one of the most famous dividend success stories in investing history.
📌 The core numbers (grounded in current sources)
Berkshire owns 400,000,000 Coca‑Cola shares.
Coca‑Cola’s annual dividend per share has recently ranged from $2.04 (2025) to $2.12 (2026).
That produces:
$816M per year at a $2.04 dividend
$824M per year at a $2.06 dividend
$848M per year at a $2.12 dividend
So Buffett’s Coca‑Cola dividends currently sit in the $820M–$850M range annually.
🧮 Why this position is legendary
Buffett paid roughly $1.3B for the KO stake between 1988–1994.
Today, KO dividends alone repay the entire original investment every ~1.6 years.
Yield on cost is astonishing:
KO’s dividend per share (~$2.10)
Buffett’s split‑adjusted cost per share (~$3.25)
Yield on cost ≈ 64%
This is the textbook example of why Buffett says his favourite holding period is “forever.”
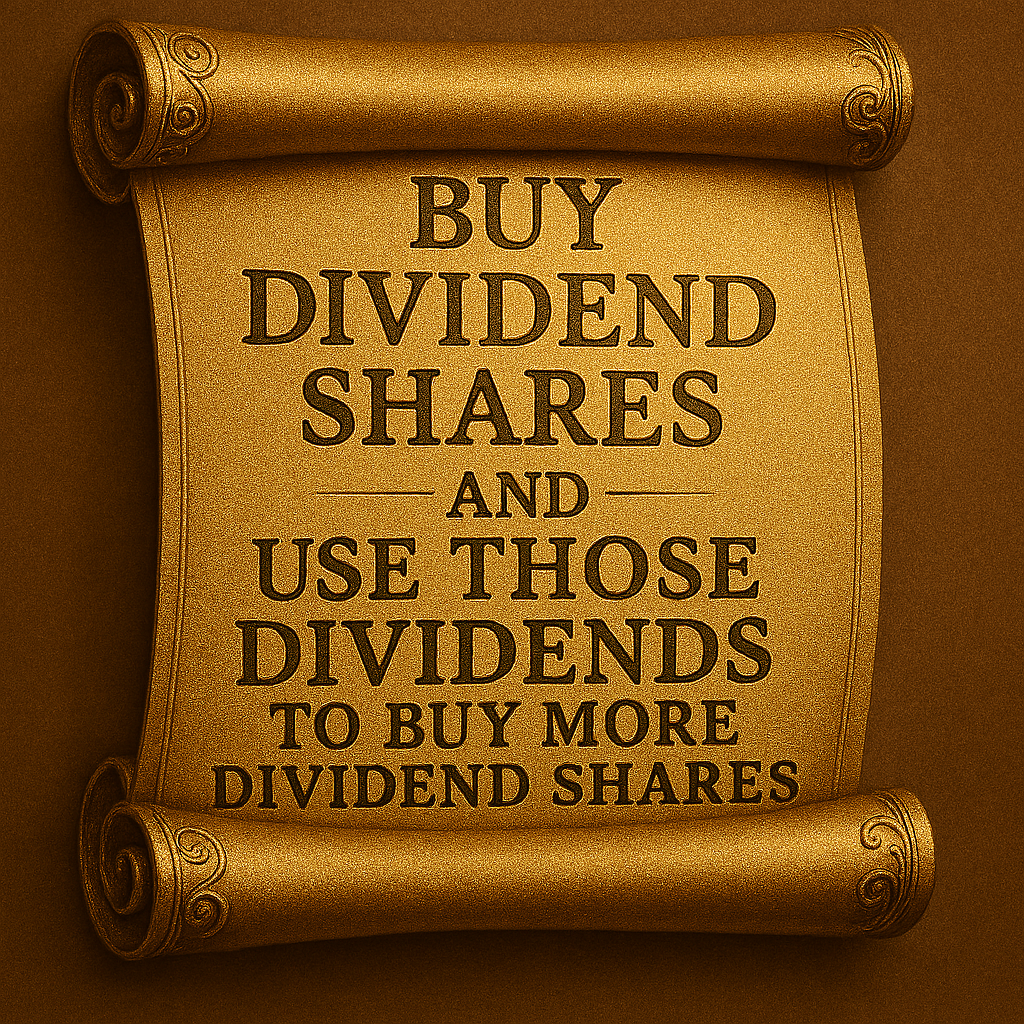
You can turbo boost your Snowball by buying ‘safe’ dividend payers that yield 7% plus taking years off of your journey.
‘Safer’ shares are all dividend heroes, although you will have to wait for a market sell off to get a higher yield, or (not buy advice), similar shares to PHP, SUPR DYOR.
Greencoat UK Wind (LSE:UKW) reported a strong first half of 2026, with its portfolio generating 3,003 GWh of electricity, exceeding budget by 4.9%. The higher output helped drive net cash generation of £222 million and produced dividend cover of 1.9 times.
Net asset value at the end of the period stood at £2.9 billion, equivalent to 134.1 pence per share. Despite delivering a total shareholder return of 9.2% during the first half, the company’s shares continued to trade at a significant discount to net asset value.
Debt Refinancing Strengthens Financial Position
The company refinanced £200 million of debt due to mature in 2026, replacing it with new long-term facilities that extend to between 2032 and 2034. Total group debt was also reduced to £2.07 billion, further strengthening the balance sheet.
Greencoat UK Wind said its capital allocation strategy remains focused on increasing inflation-linked shareholder returns while continuing to reduce debt and selectively invest in additional renewable energy assets that can support future cash generation.
Dividend Target Increased
The board reaffirmed its commitment to growing shareholder income by raising its 2026 dividend target to 10.7 pence per share. A second-quarter dividend of 2.68 pence per share has been declared, bringing total dividends relating to the first half of the year to 5.36 pence per share, representing total distributions of £115.7 million.
Management said the current 24.2% discount between the share price and net asset value reflects wider pressures affecting the renewable infrastructure sector, including higher interest rates and policy uncertainty, rather than any deterioration in the company’s underlying business. The board believes improving market conditions and a healthy pipeline of investment opportunities could help unlock long-term shareholder value.
Investment Outlook
Greencoat UK Wind continues to benefit from reliable cash generation, moderate leverage and an attractive dividend yield, making it appealing to income-focused investors. However, recent earnings volatility, weaker profitability and the absence of free cash flow during 2025 have weighed on investor sentiment. Technical indicators also remain subdued, with the shares trading below longer-term moving averages. Even so, the company’s strong operational performance and disciplined capital allocation strategy provide support for its long-term outlook.
About Greencoat UK Wind
Greencoat UK Wind PLC (LSE:UKW) is a listed renewable infrastructure investment company focused on owning and operating UK wind farms. Its objective is to provide investors with sustainable, inflation-linked income through ownership of operational renewable energy assets while supporting the UK’s transition to cleaner electricity generation.
Since its launch, the company has distributed approximately £1.5 billion in dividends and reinvested around £1.1 billion of surplus cash into additional renewable energy projects. Its investment strategy prioritizes growing shareholder distributions, maintaining a strong balance sheet and selectively expanding its portfolio to preserve long-term cash generation and support future returns.
This article was written by the editorial team at InvestorsHub/ADVFN
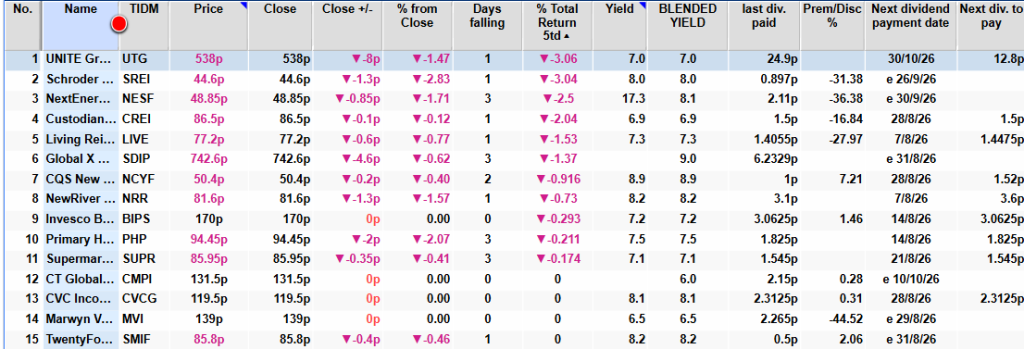
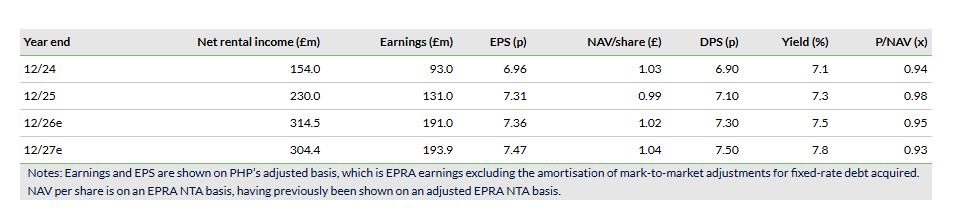
Primary Health Properties — Strong earnings growth and strategic progress
Primary Health Properties (PHP) has reported H126 results showing strong earnings growth, supported by the successful combination with Assura and underlying portfolio progress. Adjusted EPS increased 9% to 3.8p, comfortably covering DPS of 3.65p (+3%). PHP is now well into its 30th consecutive year of DPS growth. 92% of the expected £9m Assura cost synergies have been put in place and plans are well advanced to reduce post-transaction leverage back to within the targeted range. Significantly, PHP has now agreed exclusive terms for the establishment of a 50/50 private hospital joint venture (JV) with a global long-term institutional investor.
Written by Martyn King
Director, Financials. Property and Insurance
While the Assura acquisition is delivering the expected financial and strategic benefits, it is the continuing organic growth of rental income that will sustain long-term performance. Annualised rent roll increased by £3m to £345m during the period, with rent reviews (at an average 3.2% per year) and asset management adding £4m, partly offset by disposals. New asset management and development projects are starting to see rents being rebased upwards, making them economically viable, highlighting the reversionary potential in the portfolio and providing crucial evidence for future rent review settlements.
Tight cost control allows more of this rental growth to drop through to earnings, and while not all the achieved annual cost synergies have yet appeared in the income statement, the EPRA cost ratio has fallen to 8.7%, one of the lowest in the sector.
PHP has clear plans in place to reduce the higher gearing assumed for the Assura acquisition and move the loan-to-value (LTV) ratio of 57% back towards the target range of 40–50%. The agreed further transfer of assets to the existing primary care JV is expected to release £82m of cash. More significantly, it is expected that PHP will seed the proposed new JV with £0.7bn of private hospital assets. PHP is expected to retain a 50% interest in the JV and will earn fees as the asset manager. Due diligence is well advanced and on track for summer completion. In aggregate, we expect the transfer of assets to the JVs to release c £450m of cash and, on a pro-forma basis, PHP expects LTV to fall to c 53%. Meanwhile, PHP’s balance sheet remains robust, with significant liquidity headroom, and the company has been active in the financing market. £1.2bn of new unsecured debt facilities were completed in the period to enhance the group’s capital structure and reduce cost of capital, with credit margins 40bp cheaper than the facilities being replaced.
With portfolio net initial yield broadly stable at 5.4%, rental growth and asset management generated a revaluation surplus and IFRS NAV per share increased 1% to 99p. We will review the financial report in detail but expect no change to our EPS, DPS or EPRA NTA forecasts despite changes to the earnings composition.