Investment Trust Dividends
I’ve took a ‘profit’ of £225 by selling 257 shares in SUPR bought yesterday.
Mr. Market is always right but sometimes not that bright. I will keep the remaining shares for the dividends. Cash for re-investment £517.00, which with the dividends to be received this month will be re-invested.

Free Article Explore Premium Services
The S&P 500 Shiller CAPE ratio is on the verge of reaching its highest level in history.
By Adam Spatacco – Jul 17, 2026
The S&P 500 has long served as a barometer of investor sentiment. Among the tools used to assess the index’s valuation, the cyclically adjusted price-to-earnings (CAPE) ratio stands out for its ability to sift through short-term noise and reveal whether stocks are priced reasonably relative to their long-term earnings history. Understanding this metric helps explain both market extremes and the steps smart investors can take when prices climb sharply.
The CAPE ratio divides the current level of the S&P 500 by the average of inflation-adjusted earnings over the past 10 years. This approach removes the fluctuations that can distort ordinary price-to-earnings (P/E) ratios, which can appear artificially low during periods of abnormally high profits or artificially high after a single down year.

Image source: Getty Images.
A conventional P/E might appear “expensive” simply because earnings per share (EPS) have collapsed in a recession, even if stock prices have not fully adjusted. The CAPE ratio, by contrast, reflects a smoother picture of sustainable profitability across different economic cycles.
When the CAPE ratio begins to climb, it usually signals that stock prices are increasing at a faster rate relative to underlying earnings. While this can stem from investor optimism about future growth, it can also reflect mounting speculation or easy credit conditions. Over the long term, higher CAPE readings have been followed by more modest stock returns because frothy markets leave less room for further multiple expansion and more room for eventual compression when reality sets in.
Historical annual averages show that the CAPE ratio reached or surpassed a level of 40 for consecutive years only once: in 1999 and 2000, when it reached 42.1 and 41.7. These readings occurred during the peak of dot-com euphoria.
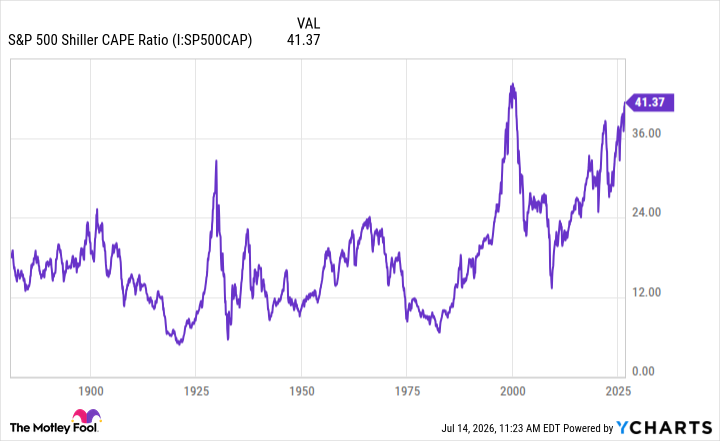
S&P 500 Shiller CAPE Ratio data by YCharts
At that time, investors were pouring capital into internet start-ups and established technology companies alike, hoping that the emerging digital economy would generate limitless growth. As a result, many companies commanded stretched valuations despite minimal revenue traction and nonexistent profits. The broader market’s valuation expanded dramatically as enthusiasm outpaced concrete fundamentals.
As the chart above illustrates, the subsequent unwinding after the dot-com bubble was painful. Beginning in 2000, the realization that many internet businesses lacked a viable path to sustained earnings triggered prolonged selling pressure. Naturally, technology stocks led the decline, with the Nasdaq falling more than 75% from its peak and the S&P 500 entering a bear market that lasted into 2002.
This episode demonstrates how quickly sentiment can reverse once valuation detaches from reality. While the market eventually recovered, the scars of the extremes witnessed during the dot-com era remain etched in investor memories even today.

As the chart above shows, the current CAPE ratio is inching closer to its dot-com-era highs. This elevated level invites caution even if it has not yet matched the extremes seen more than two decades ago. A continued rise in the CAPE ratio could foreshadow a period of weaker total returns or a meaningful drawdown — though such outcomes are never certain.
Rather than attempting to time the market, smart investors can benefit from maintaining broad diversification across sectors and asset classes. Within stocks, keeping an emphasis on blue chip companies with diversified business models, strong balance sheets, and a proven ability to navigate economic cycles provides greater resilience than a concentrated bet on any single theme or growth narrative. Established businesses tend to generate more predictable cash flows and often return capital to shareholders through dividends, offering a degree of downside protection during volatility.
In addition, holding a meaningful cash allocation alongside stocks will further strengthen your portfolio. Cash serves as both a defensive buffer during volatility and as dry powder for purchasing quality businesses at more attractive prices should the opportunity arise.
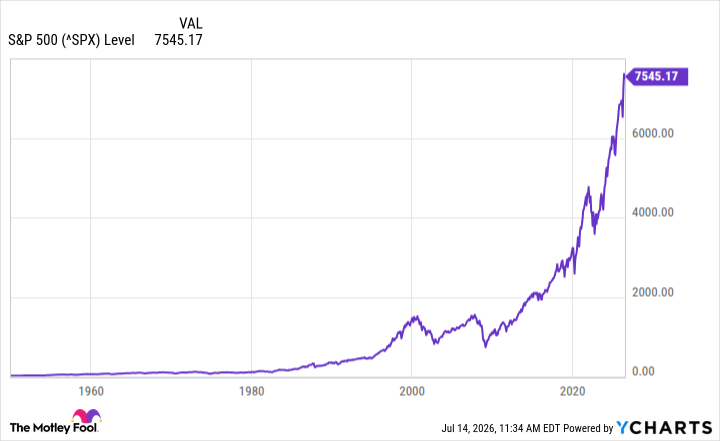
Above all else, history shows that the S&P 500 has always absorbed economic shocks, corrected its excesses, and resumed an upward trajectory as the economy grows and companies innovate. Through diversification, a focus on durable business models, and prudent cash reserves, investors can participate in that resilience while reducing the impacts of valuation-driven turbulence.

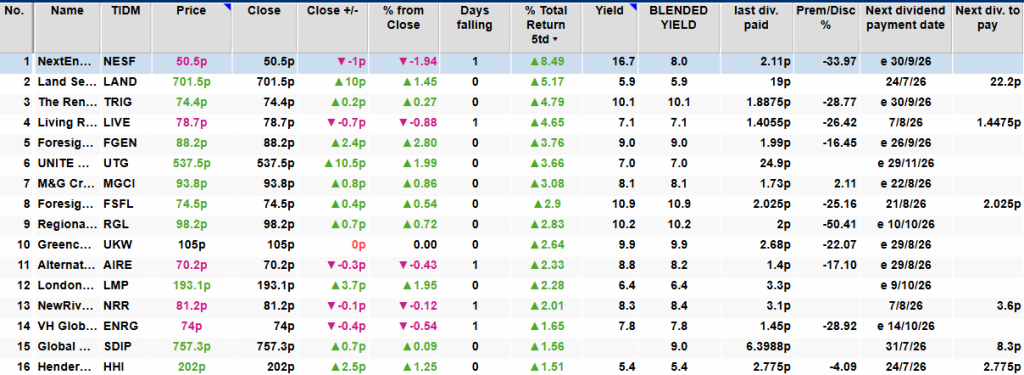
The FTSE 250 is sometimes overlooked. But James Beard reckons income investors might be pleasantly surprised by some of the yields on offer.
Posted by James Beard
Published 16 July
You’re reading a free article with opinions that may differ from The Twelfth Magpie’s Premium Investing Services.
Official figures for June show that over 6m more trades were placed for stocks on the FTSE 250 than the FTSE 100. In cash terms, this equates to a difference of more than £80bn.
Based on these numbers, the UK’s second tier of listed companies is clearly the poor relation. Yet it’s home to many high-yielding dividend shares that could appeal to income investors. Let’s take a closer look.
The current (16 July) yield on the FTSE 250 is 3.5%, beating the Footsie’s 3.1%.
But as is often the case, focusing on an average hides a wide variation. For example, based on the past 12 months, there’s an incredible 54 FTSE 250 members yielding 5% or more.
One of these is Greencoat UK Wind (LSE:UKW). It was the country’s first renewable energy infrastructure fund and its £2.8bn portfolio of wind farms (both onshore and offshore) now contributes around 2% of the UK’s electricity.
The fund’s targeting a dividend of 10.7p for 2026. If this is achieved, it means the stock’s currently offering an incredible forward yield of 10.4%. Why so high?
Although the fund continues to pay an attractive dividend that it’s pledged (no guarantees, of course) to increase in line with inflation, it’s the fall in its share price that’s been the biggest contributor to its above-average yield.
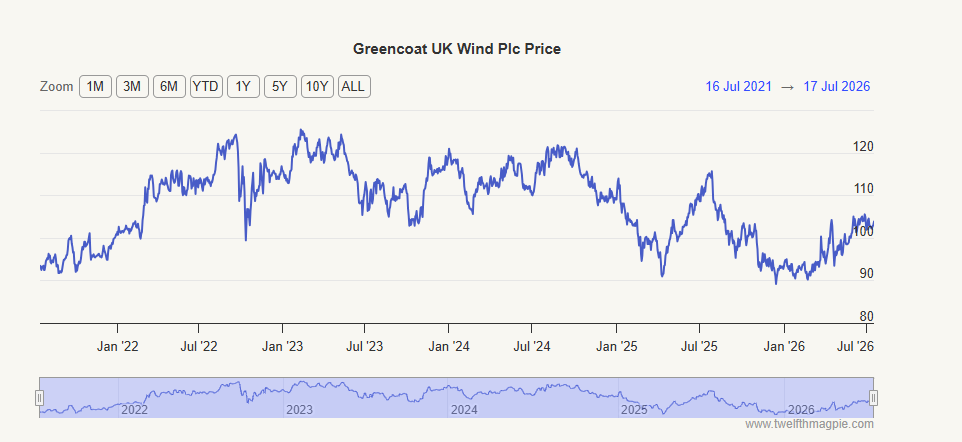
However, based on the value of its assets, this doesn’t appear justified. In fact, the fund now trades at a massive 23.75% discount to its net asset value (NAV).
Although the fundamentals of the market are strong — data centres, electric vehicles, and heat pumps are all increasing demand for electricity — the nation’s finances aren’t in such good shape. As a result, the government’s announced that it will abolish the Carbon Price Support from April 2028. This means electricity prices could fall by up to £5/MWh reducing Greencoat’s NAV by 3p-5p a share.
The fall in its NAV per share has another consequence. It means the trust’s close to its gearing limit of 40%, which restricts the amount it can borrow to fund further expansion.
Despite these challenges, investors appear committed with 97.08% of shareholders voting against winding up operations at the annual general meeting.
And with the trust’s share price not reflecting the true worth of its assets by such a wide margin, it could be argued that the shares are in bargain territory. A near-25% discount, coupled with a double-digit yield, is an attractive proposition.
Indeed, the trust has increased its annual dividend for 13 consecutive years.
Volatile energy prices remain a concern. But to help mitigate this, the fund entered into various hedging arrangements. In April, it announced that 68% of its cash flows were “fixed in nature” through until March 2027. Although wind speeds can vary, output’s reasonably predictable.
Also, with Ed Miliband widely tipped to become the UK’s next chancellor, I think the renewable energy sector could have a powerful friend in the Treasury.
Personally, I think investors are being overly cautious. This could be a rare opportunity to acquire a FTSE 250 stock with a double-digit yield at a knock-down price.
That’s why I think a small shareholding’s worth considering as part of a well-diversified portfolio.

A $14,000 TFSA won’t make you rich overnight, but it can kickstart a simple compounding engine with real staying power.
Posted by
Amy Legate-Wolfe
Published July 16
A $14,000 Tax-Free Savings Account (TFSA) can feel like a financial featherweight of a portfolio, but it has surprisingly heavyweight ambitions. It’s not enough to retire tomorrow, unless tomorrow’s retirement plan involves instant noodles and very optimistic weather.
Yet it is enough to start building a repeatable system: invest, collect payouts, reinvest, and let time do the heavy lifting while you do literally anything else.

The first step is making sure the room exists. The Canada Revenue Agency (CRA) says the 2026 TFSA dollar limit is $7,000, added on January 1, 2026. It also says investors should calculate room using their own financial records, since CRA account information updates only once per year and may not reflect recent transactions.
That means $14,000 may work for someone with unused room from prior years, or for someone using two years of room across 2025 and 2026. What investors should not do is guess, contribute, and hope the CRA is in a generous mood. The CRA does not have “oopsie” energy.
* Returns as of July 6th, 2026
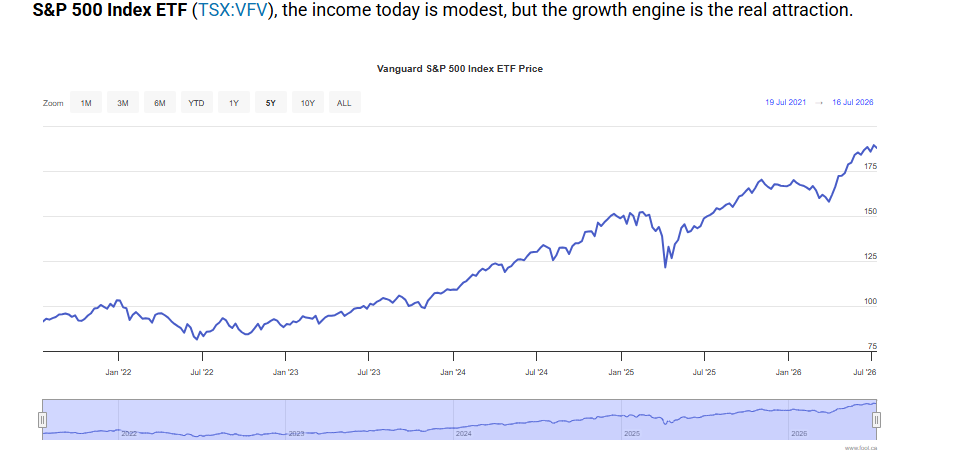
Once the room is confirmed, the next question is how to structure the money. If the goal is consistent payouts, investors can split the job into two parts: income today and growth for later. With the Vanguard S&P 500 Index ETF (TSX:VFV), the income today is modest, but the growth engine is the real attraction.
VFV stock is not a high-yield dividend stock, but an exchange-traded fund (ETF) that seeks to track the S&P 500 Index before fees and expenses, giving Canadian investors exposure to large U.S. companies. Vanguard says the fund invests, directly or indirectly, primarily in the stocks of U.S. companies.
So why use it for TFSA income at all? Because consistent payouts do not always mean the biggest payout. Sometimes they mean building a portfolio that can pay small quarterly distributions now while growing enough to support larger withdrawals later.
Vanguard lists VFV stock’s distribution frequency as quarterly, with a 12-month trailing yield of 0.84% as of June 30, 2026. On $14,000, that works out to about $118 a year, or roughly $29 per quarter. Helpful? Yes. Life-changing? Not unless your life-changing expense is one very enthusiastic pizza order.
That is why I would structure the $14,000 around reinvestment, not immediate spending. I would buy VFV stock inside the TFSA, turn on a dividend-reinvestment plan if available, and let each quarterly payout buy more units. The payout stays consistent, but the real goal is compounding.
The cost helps. Vanguard’s product list shows VFV stock with a management fee of 0.08% and a management expense ratio of 0.09%. Low fees are not exciting dinner conversation, but they matter for long-term investors as less money leaks out of the portfolio each year.
The recent valuation point is simple. VFV stock was recently trading near a 52-week high at 27.5 times earnings. That does not make it cheap; it makes patience important. Investors putting in a lump sum could consider buying in stages if market timing makes them twitchy.
VFV stock can make sense for TFSA investors who want a clean, low-cost core holding with quarterly payouts. It will not pump out big income right away, but it can help build the asset base that future income depends on.
A $14,000 TFSA does not need to be complicated. Start with room, use a broad ETF, reinvest the payouts, and give the portfolio years to become more useful. The first cheques may be small, but small cheques with time and discipline can turn into something far more interesting.

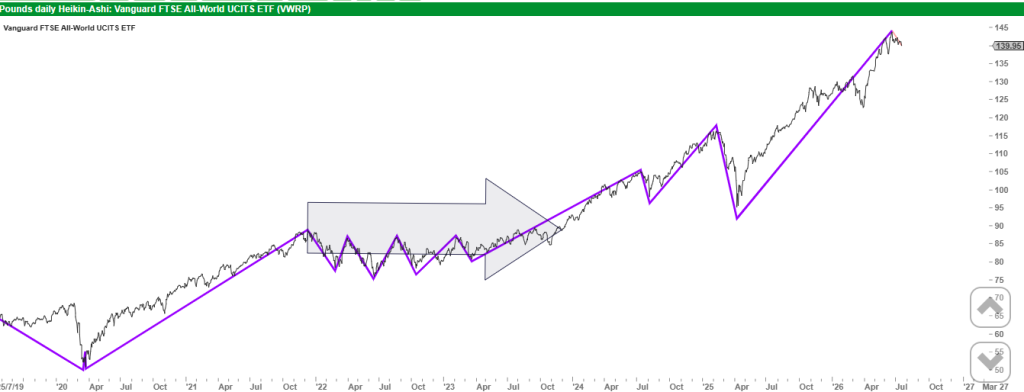
The SNOWBALL has a comparator share, that is if 100k was invested in VWRP on the start date for the SNOWBALL 09/09/22.
VWRP is TR, where the intention would be to use the 4% rule.
The SNOWBALL only buys shares to earn dividends to buy more shares until drawdown is entered and the dividends would be used to fund your retirement.
Let’s assume the current up leg is over for VWRP but there could still be one more leg and the share moves sideways for 2 years as in the graph above.

Current value of VWRP £167,812
Using the 4% rule, ignoring the need for a buffer fund of 3 years cash, income of
£6,712.
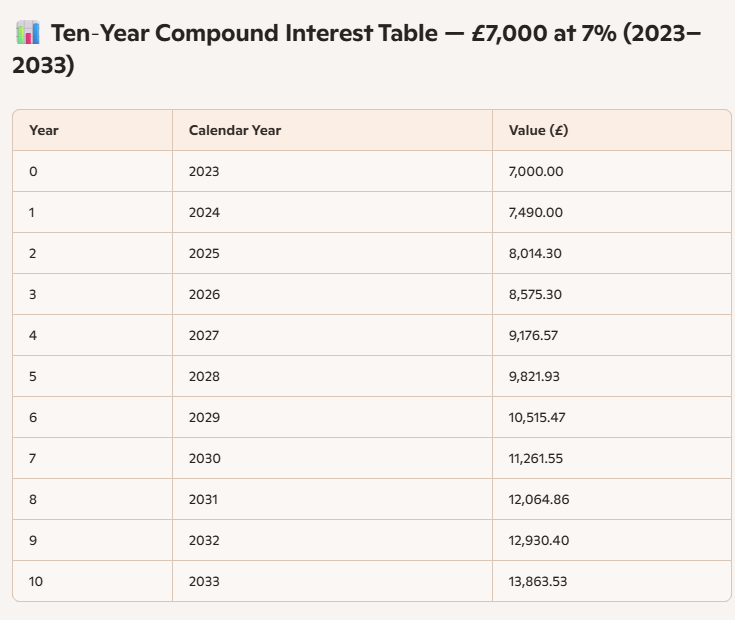
The SNOWBALL current fcast income of 11k plus this year and 11,261k next year.
If we leap forward 2 years and VWRP has gone sideways the income comparison would be
VWRP £6,712.00
The SNOWBALL £12,930.00

To earn income of 13k VWRP would have to be valued, using the 4% rule,
at £325k. GL with that. The longer that compound interest has to work its magic the greater the gap will be.

The SNOWBALL wants to buy back into SUPR, one of the safer yields in the Investment Trust universe, after the cash raise yesterday and ahead of their xd date next week.
The blended yield, if the share is held for just over one year should be around 9%.
I could raise the cash by selling AIRE but currently it’s interesting as their may be a biding war for the share, or the AEW bid my complete.

I’ve decided to book the profit in ORIT £727, with the intention of buying back into ORIT after the dust settles at AIRE.
I’ve bought for the SNOWBALL 11145 shares in SUPR for £9,500.

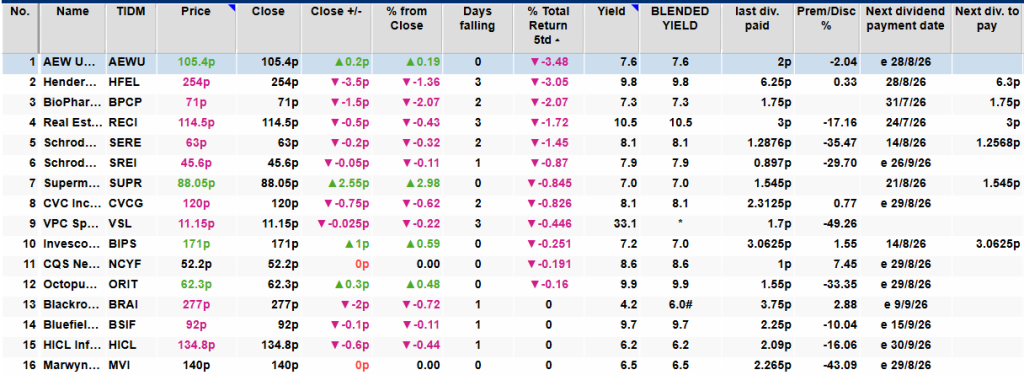
AEW UK REIT plc
(“AEWU”, the “Company” or the “Group”)
Introduction
The Board of Directors of AEWU (the “Board of AEWU“) confirms that it is considering a possible all-share offer to acquire the entire issued share capital of Alternative Income REIT plc (“AIRE“) (the “Possible Offer“).
The Possible Offer could lead to the combination of two REITs with aligned portfolios, offering greater portfolio diversification, the benefits of increased scale, a reduction in operating costs and an attractive ongoing dividend per share, with AEWU currently paying an annual dividend of 8 pence. The Possible Offer would be expected to be earnings accretive for AEWU.
Terms of the Possible Offer
Under the terms of a Possible Offer, AIRE shareholders would receive:
0.725 shares in AEWU for each AIRE share held
This is based on an exchange ratio calculated using the companies’ respective net asset values (“NAVs“) per share, with a discount applied to AIRE’s NAV per share of 6 per cent.
The NAVs per share referred to above have been adjusted for the companies’ respective estimated transaction costs and for the most recently declared (but not accrued) dividend per share (as described in the sources and bases section).
Background to and rationale for the Possible Offer
Achieving an appropriate scale for AEWU’s strategy is a key ongoing priority for the Board, with expected benefits to shareholders from growth including enhanced liquidity in the Company’s shares, a lower operating cost ratio as well as an expanded portfolio of investment opportunities. These factors are considered important to ensure that the Company and its strategy remain relevant at a time of much corporate activity and competition in the UK-listed property sector.
The Board and the Company’s investment manager, AEW UK Investment Management LLP, will seek to take advantage of appropriate growth opportunities for the Company where possible, including the potential issuance of new equity. The protection of existing shareholders’ interests, including in earnings potential, will remain paramount in anything examined or proposed.
With the above principles in mind, the Board and its advisers entered into discussions regarding a possible offer for AIRE earlier this year, having been invited to put forward a proposal by the Board of AIRE. On 24 March 2026, following press speculation, the Company made an announcement to confirm that it was considering a possible offer for AIRE. At the time, an in-principle agreement of terms had been reached with the Board of AIRE for an all-share offer by way of a scheme of arrangement. Unfortunately, certain key information was not available, and agreement on other matters could not be concluded within the required timescales for making an offer. Additionally, access to AIRE’s major shareholder was not granted to obtain their views, which would have been paramount (at the time) to proceeding with the possible offer. As a result, AEWU made a statement that it did not intend to make an offer on 21 April 2026, the deadline by which it was required to confirm a firm intention to make an offer under the City Code.
It was of regret to the Board of AEWU that this opportunity was not able to progress at that time. AIRE’s portfolio is consistent with the assets and management style applied within AEWU. In particular, AIRE’s assets’ inflation-linked income stream was felt to be very complementary to the strong rental growth prospects offered by the portfolio of AEWU and the possible combination of the companies could have served both sets of shareholders’ interests.
Subsequent events
On 12 June 2026 Glenstone REIT plc, which holds 24.78 per cent. of the issued share capital of AIRE, announced a firm intention to make a cash offer for the issued share capital of AIRE that it does not already own. This announcement released AEWU from its restrictions under the City Code to make another approach to AIRE. The offer made by Glenstone, were it to be successful, removes the possibility of AIRE shareholders receiving further dividend income and is being made at a discount to the prevailing net asset value of AIRE of 15.4 per cent., which, in the opinion of the Board of AEWU and its advisers, compares unfavourably with the proposal made by AEWU some months ago.
The Company notes the recent statements by Glenstone of their previous support for the possible all-share offer for AIRE by AEWU and their agreement in principle to provide an irrevocable undertaking to vote in favour or accept AEWU’s proposal, based on the terms agreed at that time. However, this was not communicated directly to AEWU at the time nor any other conditions of provision of their support that might have been requested.
Professional fund buyers reveal their most recent buys and sells, and share their outlook for the months ahead.
15th July 2026
by Lucy Loewenberg from interactive investor

As markets move through the second half of 2026, the FTSE 100 remains firmly above the 10,000 mark. The index has continued to hold its gains, although its momentum has become more uneven in recent weeks.
Equities, particularly in the US, remain near record levels, supported by resilient earnings and continued optimism around artificial intelligence (AI).
However, volatility has resurfaced as a theme shaping UK and European markets, as geopolitcal tensions endure, keeping oil prices and energy stocks in focus.
Against this backdrop, our fund-of-funds investors continue to take a range of approaches to portfolio positioning. They favour global strategies and funds focused on emerging markets.
Each quarter, our multi-manager panel share their current bull and bear perspectives, along with the funds and investment trusts they have recently bought, added to, or sold.
Reason to be bullish: there’s still a load of money being fired at the economy in the pursuit of building out the AI infrastructure, which is trickling down through the economy. Much of this spending is coming from the big tech monopolies which, prior to this, were producing more cash than they knew what to do with.
Reason to be bearish: there are signs that consumers are becoming overstretched, particularly now that wage growth is cooling down. It wouldn’t take much to flip them into recession-inducing belt-tightening.
Bought: Evan-Cook established a position in Guinness Global Innovators Z GBP ACC to his stable of highly active funds. “Like most people, we are excited about the high level of innovation happening today, but we are equally nervous that there are patches of overexuberance, which we are keen to avoid,” says Evan-Cook. He believes the experienced team is good at identifying genuinely innovative companies, but are also aware of the dangers of their prices rising too high.
Ian Mortimer, co-manager of the Guinness Global Innovators fund, was recently interviewed by interactive investor.
Increased: he topped up his holding in Skerryvore ICAV Global EM Eq S GBP Acc . This fund’s focus on high-quality companies makes it tortoise-like in its approach and returns, and recently it has looked very slow versus the AI-heavy hares. Evan-Cook adds: “It has proved wise in the past to top up the tortoises when the hares are this far ahead.”
Trimmed: he cut back his exposure to IFSL Evenlode Global Equity B GBP Acc . “We still like the fund, but one member of the fund management team has recently left, so we’re holding a lower weight while the changes bed down,” says Evan-Cook.
Reason to be bearish: inflationary pressures from the war in Iran and supply shortages are building up and starting to impact interest rate decisions and consumers on both sides of the Atlantic. In the US in particular where consumers have been one of the growth engines for the economy, this could put a dent in future growth.
Reason to be bullish: The AI spending engine is still firing on all cylinders, for now, offering support to growth over the next few months.
Increased: despite solid underlying operational performance and a number of exits in recent months in the portfolio, ICG Enterprise Trust Ord ICGT
suffered a sharp de-rating during the quarter. The trust, like other peers in the listed private equity sector, suffered from concerns about the impact of AI on its software exposure (a long-favoured sector for private equity investors), fears about higher interest rates due to inflationary pressures, and uncertainty about a febrile IPO market.
Ropers says: “We note, however, that ICG’s software exposure is limited at about 12%, that the trust is conservatively managed, so less dependent on high levels of debt, and that the bulk of their exits have not historically relied on public markets (preferring exits to trade buyers or to other PE funds).” That’s why he thinks that the discount, currently 31%, presents attractive value.
Trimmed: by contrast to the position in ICG Enterprise, which Ropers increased during the quarter, he trimmed his position in private equity trust Pantheon International Ord PIN
The same sector dynamics and investors’ concerns weighed on this trust, but its aggressive share buyback programme contributed to a tightening of the trust discount. The managers also realised more than 10% of the net asset value at a premium to carrying value, thus boosting investors’ confidence in valuations. “Given the sharp relative outperformance of the trust versus some of its peers in recent months, we took some profit,” he says.
Reason to be bullish: economic fundamentals are broadly positive, and corporate earnings growth is broadening beyond the Magnificent Seven, supporting equity market strength.
Reason to be bearish: the conflict in the Middle East has pushed up near-term inflation expectations and the risk is that central banks react with rate hikes in order to curb supply-side inflation.
Increased: Green’s team hasn’t added any new positions to their portfolios over the last quarter, but they introduced a position in Fidelity Emerging Markets Ord FEML
to the Growth Portfolio in August last year and have since scaled the position up.
FEML has posted returns of more than 100% over the past 12 months, almost doubling its MSCI Emerging Markets benchmark return. Green says: “When we decompose those returns, we find that more than half its outperformance can be attributed to gearing, investing in smaller but less liquid companies and shorting specific companies or markets – impressive use of the investment company structure.”
Within the Income Portfolio, they added to their position in Murray Income Trust Ord MUT
after the change of manager to the established Artemis UK Income team, who Green says, “enjoy one of the best and longest open-ended track records in the open-ended Investment Association (IA) UK Equity Income Sector.”
The team will manage the trust in the same way as their open-ended fund, but Green believes that with some modest gearing (and lower ongoing fees) on a portfolio showing attractive fundamental characteristics, it should lead to attractive returns.
Sold: despite the attractive income yield, Green fully sold his holding of Renewables Infrastructure Grp TRIG
from the Income portfolio. He prefers the purer play of Greencoat UK Wind UKW
and total return characteristics of Cordiant Digital Infrastructure Ord CORD0 and Pantheon Infrastructure Ord PINT trusts.
Reason to be bullish: US productivity rose 2.9% year-over-year in the first quarter — the strongest in two years — as AI adoption feeds through the economy, while a palatable interest-rate environment is fuelling record activity (Q1 global M&A hit $861 billion (£643 billion), the strongest in five years). Earnings momentum is broadening beyond the Magnificent Seven and across regions, pointing to a wider, more durable growth base.
Reason to be bearish: inflation could prove a more sizable and persistent risk than consensus expects, with the Federal Reserve and most major central banks on pause or leaning hawkish in response to higher oil prices – leaving rates higher for longer. Combined with ongoing geopolitical conflict, entrenched inflation and rising rates would pressure valuations and long-duration assets.
Bought: Ibrahimpasic opened a new position in theStt Strt SPDR S&P500QulAristETF$UnhAcc
a rules-based, quality-tilted US large-cap strategy that seeks to outperform the broad S&P 500 over a full cycle.
Rather than relying on a manager’s discretion, it systematically screens the index for companies with a track record of positive free cash flow and then selects the highest-quality names on metrics such as cash generation, low gearing and capital-light business models.
The result is a concentrated 100-stock portfolio at a relatively low cost, with high-conviction weightings in durable US technology and healthcare leaders. Ibrahimpasic says: “The position was introduced to build a little more resilience into the portfolio through its quality tilt, having captured a genuine quality premium over the plain benchmark.”
Increased: she added further to her holding in the emerging market growth manager, FP Carmignac Emerging Markets B GBP Acc (BQXJRP9) fund. This is a high-conviction, growth-oriented global emerging market equity strategy that seeks to outperform over a full cycle by investing in quality, cash-generative, self-financing companies operating in countries with strong macro fundamentals.
“This was partly done to increase exposure to the asset class, as well as build up exposure in a high-conviction manager,” says Ibrahimpasic.
Sold: she closed her position in Regnan Sustainable Water and Waste IGBP , which is run by a well-established team and seeks to invest in generally small and mid-cap businesses, predominantly in the industrials and utilities sectors, that meet certain environmental, social and governance (ESG) criteria.
“Our exit was a result of tactical rotation towards large-cap names and raising cash across the book stemming from our risk management process, as well as a period of softer performance of the manager beyond its prevalent style,” she says.
Vincent Ropers is a portfolio manager at Wise Funds, responsible for multi-asset strategies, using value and fundamental investment styles. He is co-manager of IFSL Wise Multi-Asset Growth and IFSL Wise Multi-Asset Income.
Paul Green along with Adam Norris along with became co-manager of CT Global Managed Portfolio Growth Ord CMPG
and CT Global Managed Portfolio Income Ord CMPI
on 1 June 2025. They have both been part of the multi-asset team at Columbia Threadneedle since 2016 and 2007, respectively, and have a combined investment experience of 35 years. The two investment trusts specialise in buying other investment trusts.
Tihana Ibrahimpasic is a portfolio manager on the multi-asset team at Janus Henderson Investors. Prior to taking this role in 2021, she was a research analyst in the team from 2018.

© 2026 Passive Income Live
Theme by Anders Noren — Up ↑