NextEnergy goes xd tomorrow for 2.10p, if u bought at 87.9p u would receive the right to 5 dividends in just over a year, a yield of 12%. U could re-invest the dividends back into your portfolio, thus increasing the yield to be received.
If the NESF share price has gone up in a year’s time, u could either continue to hold the share or spin it and try to do it all over again with another Trust.
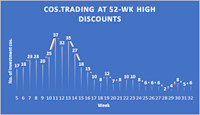
With market volatility spiking higher on US recession fears, has the number of London’s investment companies trading at 52-week high discounts followed suit and move higher too?
12 Aug, 2024
We estimate six investment companies saw their respective share prices trade at 52-week high discounts over the course of the week ended Friday 09 August 2024 – just one more than the previous week’s five.
London’s investment company sector proving to be relatively resilient (so far) in the face of the uptick in market volatility seen in recent days. That’s based on the number of companies trading at 52-week high discounts staying close to year lows. Impressive given that on Friday 2 August 2024, 2-year U.S. Treasury yields fell to 4.10%, the lowest level since May 2023, 10-year yields dipped below 4% for the first time since February, while equity markets lurched downwards with Japanese indices leading the way after shedding over 11% on 5 August 2024. Then on Tuesday 6 August, the VIX Index, a gauge of S&P 500 volatility, recorded its largest daily spike since 1990. The cause, elevated fears that the U.S. economy could slip into recession following a run of poor data. In the case of Japan, a tightening in monetary policy didn’t help much either.
And yet, the number of London’s closed-end funds trading at 52-week high discounts barely budged. The apparent resilience could, of course, prove to be temporary – as the graph above shows it was only back in February/March of this year that the number of 52-wk high discounters soared into the 30s as the narrative of higher-for-longer interest rates took hold.
But perhaps that’s it. This time round, what’s worrying markets are fears of a U.S. recession which could end up forcing the Fed’s hand to bring forward those long-awaited rate cuts. And a lower interest-rate environment could provide a positive tailwind for London’s investment companies. That’s because lower interest rates would likely prompt a lowering in the discount rates used to value assets, resulting in valuation uplifts. Lower interest rates would also reduce the pressure on yields offered by trusts to compete with risk-free assets. And lower interest rates would benefit those funds with high debt levels.
“This time is different”, an overly used phrase that more often than not comes back to haunt market commentators. So, not going to use that phrase here then. Time will tell, will just have to do instead !
Unaudited Quarterly Net Asset Value & Operational Update
NextEnergy Solar Fund, a leading specialist investor in solar energy and energy storage, announces its unaudited Q1 Net Asset Value (“NAV”) and operational update for the period ended 30 June 2024.
Key Highlights
Financial:
· Unaudited NAV per ordinary share of 101.3p (31 March 2024: 104.7p).
· Unaudited ordinary shareholders’ NAV of £598.6m (31 March 2024: £618.6m).
· Unaudited Gross Asset Value (“GAV”) of £1,124m (31 March 2024: £1,155m).
· Financial debt gearing (excluding preference shares) of 29.1% (31 March 2024: 29.3%).
· Total gearing (including preference shares) of 46.7% (31 March 2024: 46.4%).
· Weighted average cost of capital of 6.4% (31 March 2024: 6.4%).
· Weighted average cost of debt of 4.5% including preference shares (31 March 2024: 4.5%).
· Weighted average discount rate across the portfolio of 8.0% 1 (31 March 2024: 8.1% 1).
Dividend:
· Attractive high dividend yield of c.10%, as at closing share price on 9 August 2024.
· Total dividends declared of 2.10p per ordinary share for the Q1 period ended 30 June 2024 (30 June 2023: 2.08p).
· Target dividend of 8.43p per ordinary share for the year ending 31 March 2025 (31 March 2024: 8.35p).
· Forecasted target dividend cover of between 1.1x-1.3x for the year ending 31 March 2025.
· Total ordinary dividends declared since IPO of £357m.
Portfolio:
· Portfolio contains 102 1 operating assets following the planned capital recycling programme sale of Whitecross, a 36MW operating solar asset (31 March 2024: 103 1).
· 980MW 2,3 of installed capacity (31 December 2023: 1,015MW 2,3).
· Remaining weighted asset life of 25.9 4 years (31 March 2024: 26.6 years).:
· The Company has successfully delivered two phases of its Capital Recycling Programme at attractive premiums.
· As at 30 June 2024 the Capital Recycling Programme has delivered:
o Two asset sales totalling 95.22MW of installed capacity.
o Raised £42.2m total capital.
o Added 1.84pps to NAV.
o Paid down £38.8m of the Company’s short-term Revolving Credit Facilities.
· Following the successful completion of the second phase of its Capital Recycling Programme, subsequent phases
Share Buyback Programme:
· The Board announced an initial Share Buyback Programme of up to £20m on 18 June 2024.
· As of 13 August 2024, 2,208,090 shares have been purchased and are currently being held in the Company’s treasury account.
Helen Mahy, Chairwoman of NextEnergy Solar Fund Limited, commented:
“This has been a strong quarter for NESF as the Company continues to narrow its discount. This has been achieved through careful management of the portfolio, including the successful sale of assets as part of our Capital Recycling Programme, and the initiation of the Company’s Share Buyback Programme. We believe there are tailwinds which will continue to drive the growth of the UK solar market and that NESF is well-positioned to capitalise on these to deliver continued shareholder value.”
Michael Bonte-Friedheim, CEO of NextEnergy Group said:
“We are pleased with the progress that has been made during the quarter as NESF continues to represent an attractive investment opportunity for existing and new investors, especially with the successful completion of the second phase of our Capital Recycling Programme. NESF continues to offer one of the highest yields for shareholders in the FTSE 350 and we are confident that the UK solar and energy storage markets stand to gain from the election of a new Labour government, which has prioritised renewable energy as the UK looks to meet its Net Zero targets.”
The movement in the NAV over the period was driven primarily by the following factors:
· Increase due to time value, reflecting the change in the valuation as a result of changing the valuation date, prior to adjusting for any outflows of the Company. The increase in value is attributable to the unwinding of the discount applied to cash flows for the period when calculating the DCF.
· A decrease in project actuals showing the difference between actual outturn vs budgeted forecasts, driven by below expected irradiation levels throughout the quarter.
· Future near-term power price forecasts reflect recent higher gas prices (June 2024). Gas prices average 16% higher than the previous forecast, as stronger LNG demand from Asia over summer months and various supply outages tightened short-term market balance. Downward corrections in offshore wind and solar capacity in the short term also put upward pressure on prices.
· In the medium-term, the power price forecast is consistent with previous quarters, with electricity prices falling as the deployment of renewables, particularly offshore wind, increases to reach the Government’s target of 50GW of offshore wind, countervailing the upward pressure from higher commodity prices and electricity demand.
· The trend for wholesale electricity prices in the long-term remains the same as previous quarters, with a slow decline expected due to increasing wind and solar capacities, driven by decarbonisation targets and a gentle decline in assumed costs.
· BESS margins have declined in the short-term (2024-2028) in line with the decrease in wholesale power prices since Q3’23 (July – September 2023), largely due to declines in gas and carbon prices. This decline, driven by a well-supplied energy market following the initial shock from the Russian invasion of Ukraine, has reduced the size of energy trading opportunities available for battery storage projects.
· The valuation incorporates revisions to short-term inflation forecasts from external third parties.
· The sale of Whitecross as part of phase II of the Capital Recycling Programme.
· The revaluation of NextPower III ESG.
· The dividends declared and operating costs incurred during the year, this includes both ordinary and preference share dividend payments.
· Other movements in residual value include changes in FX rates, fund operating expenses, and other non-material movements. Included here is a one-off extraordinary cost associated with the refinancing of the RCF facilities.
Inflation Linkage and Updates
The Company continues to take a consistent approach to its inflation assumptions, using external third-party, independent inflation data from HM Treasury Forecasts and long-term implied rates from the Bank of England for its UK assets. For international assets, IMF forecasts are used. Long-term assumptions are aligned with market consensus including transition to CPI from 2030.
Discount Rate Assumptions
For the UK portfolio, the Company uses multiple sources for UK power price forecasts. Where power has been sold at a fixed price under a Power Purchase Agreement (“PPA”) (a hedge), these known prices are used. For periods where no PPA hedge is in place, short-term market forward prices are used. After two years, the Company integrates a rolling blended average of three leading independent energy market consultants’ long-term central case projections.
For the Italian portfolio, PPAs are used in the forecast where these have been secured. In the absence of hedges, a leading independent energy market consultant’s long-term projections are used to derive the power curve adopted in the valuation.
Power Purchase Agreement Strategy
NextEnergy Solar Fund continues to lock in PPAs over a rolling 36-month period. This proactive risk mitigation helps secure and underpin both dividend commitments and dividend cover, whilst reducing volatility and increasing the visibility of cash flows.
The Company sells REGOs bundled with power sales through existing PPAs as well as unbundled via bilateral arrangements. Where REGOs have been sold at a fixed price, these known prices are used in the calculation of NAV. 93% of REGOs generated for the 2024-25 compliance year have been sold at an average price of £3.9/MWh. 29% of expected REGOs for the 2025-26 compliance year have been sold at £6.9/MWh. Unbundled, unsold REGO volumes of up to c.645GWh/annum are reflected in the NAV in line with third-party advisor forecasts (£5/MWh until March 2028 and then £1.5/MWh for the remaining life of the asset).
Available Capital
Out of the total £205m immediate RCFs available to the Company, c.£61.2m remains undrawn and available for deployment as at 30 June 2024. The Company has c.£3.8m immediate cash balance available at Company level as at 30 June 2024 (this is separate from the cash currently held at Holdco/SPV level).
Future Pipeline
The Company owns the project rights for, or has exclusivity over, a pipeline of c.£500m domestic and international solar (>400MW), domestic energy storage assets (>250MW), and a right of first offer over qualifying projects developed or sourced by the Investment Manager and Investment Adviser.
Remember a target is only a figure to be monitored to see if it is achieved. If it is u only need to check the next dividend announcement to see if u want to to continue to hold. WB states his favourite hold time is forever.
Looking for top dividend growth shares? Here’s one I’d buy for a £1,000 annual passive income!
Royston Wild explains why this 10.1%-yielding FTSE 250 stock might be one of London’s greatest dividend growth shares right now.
Royston Wild
Image source: Getty Images
When investing, your capital is at risk. The value of your investments can go down as well as up and you may get back less than you put in
Over time, the London stock market’s proved a happy hunting ground for investors seeking dividend growth shares.
With an average dividend yield of around 3.5%, the FTSE 100 and FTSE 250 indexes provide larger dividends than most overseas bourses. This is thanks in part to the UK market’s long-established culture of paying cash rewards.
It’s also because many British companies are well-established in mature markets. They receive stable cash flows in industries like energy, banking, consumer goods and utilities. These can then be distributed in the form of dividends.
Taking care
Dividends are never guaranteed, of course. As we saw during the Covid-19 pandemic, even the most dependable dividend growth stock can suddenly reduce or axe payouts entirely.
Buy buying stocks with strong balance sheets, solid positions in defensive markets, and a proven commitment to paying dividends can greatly enhance an investor’s chance of receiving a healthy passive income.
Here’s one I’d buy if I had spare cash to invest. If analyst forecasts are correct, it could provide a £1k second income this year.
Power play
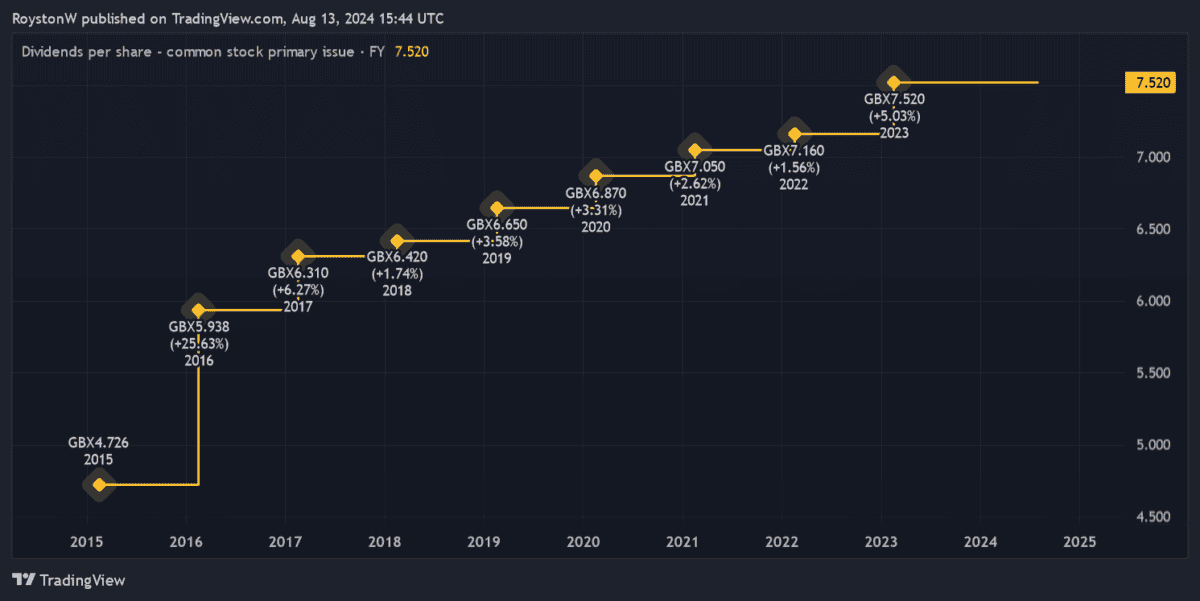
Created with TradingView
As the chart shows, NextEnergy Solar Fund (LSE:NESF)has a long history of raising the annual dividend. In fact, following its decision to raise fiscal 2024’s total payout to 8.35p per share, it’s increased cash rewards every year since its IPO back in 2014.
Being a renewable energy stock, the company benefits from stable cash flows at all points of the economic cycle. Electricity’s one of life’s essential commodities, so NextEnergy has the financial capacity as well as the confidence to pay a growing dividend.
What’s more, with a large proportion of its regulated revenues linked to the Retail Price Index (RPI), its ability to increase dividends remains strong, even during inflationary periods.
There are risks to buying NextEnergy Solar Fund. Energy generation dropped almost 7% last year, to 852GWh, which the firm attributed to “increased rainfall and humidity (which can affect the performance of certain components)”.
But weather-related issues to this extent are uncommon. Indeed, solar panels are well known for providing a consistent flow of electricity, thanks to average yearly irradiation and limited moving parts. This makes NextEnergy a much more reliable profits generator than many other renewable energy shares.
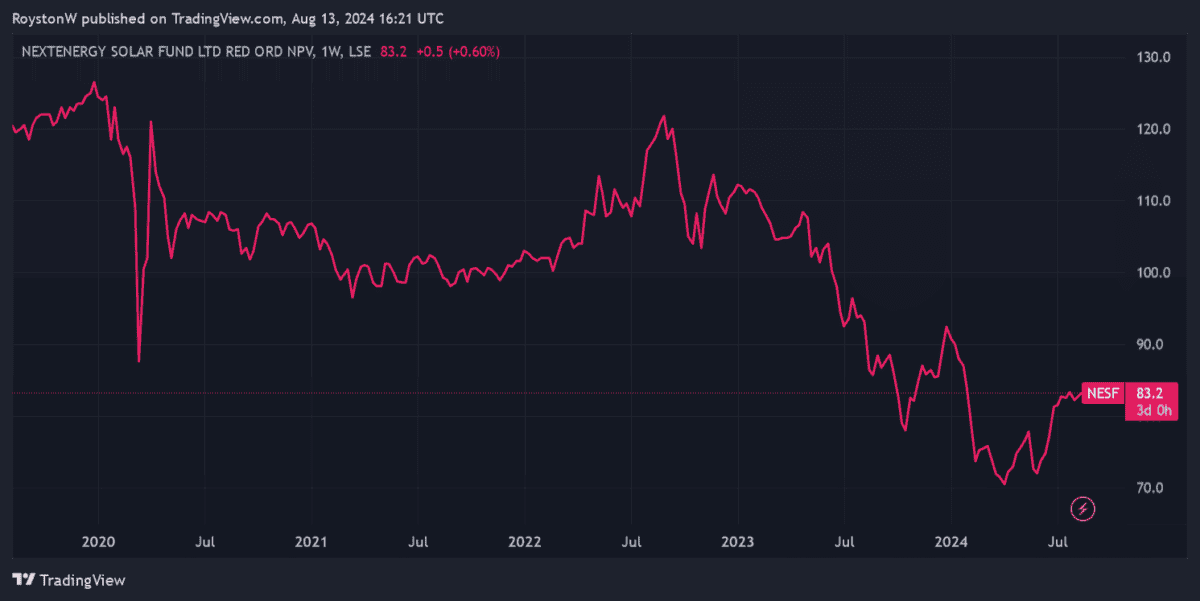
10.1% dividend yield !
Created with TradingView
As the chart shows, the company’s share price has struggled more recently. Higher interest rates have squeezed its net asset values (NAVs) and pulled down earnings. This could remain a problem too, if inflationary pressures persist and central banks keep rates around current levels.
Yet the spectacular cheapness of NextEnergy’s share price still makes it worth serious consideration, in my opinion. The firm trades at a 22% discount to its estimated NAV per share of 105.7p.
With its forward dividend yield also sitting at 10.1%, I believe it could be one of the best value income stocks out there and worth considering.
If I invested just over £9,900 in NextEnergy shares, this would give me a juicy £1,000 in passive income this year alone. That’s assuming that broker forecasts are accurate.
$$$$$$$$$$$
As we saw during the Covid-19 pandemic, even the most dependable dividend growth stock can suddenly reduce or axe payouts entirely.
££££££££££
Investment Trusts have reserves they can use to pay their dividends in times of market stress and that is the reason there are only Investment Trusts in the Snowball.
The Telegraph thinks Merchants is well placed to capitalise over the long term, while The Mail on Sunday’s Midas believes Custodian Property Income has shown that it can deliver through thick and thin.
ByFrank Buhagiar•12 Aug, 2024•
Questor: Now is the time to add this long time favourite to your portfolio
The Telegraph’s Questor is upbeat about the FTSE 100’s future prospects. Bargain-basement valuations; globally focused companies (over 80% of sales made by FTSE100 constituents are generated outside the UK); and an improving outlook for the world economy – just three reasons cited for the tipster’s positivity. And Questor is putting its money where its mouth is by increasing its wealth preserver portfolio’s exposure to UK large-cap stocks. It’s doing this by adding a holding in long time favourite Merchants (MRCH). Easy to see why – the UK equity income fund was originally tipped by Questor back in February 2020 and has since generated an 18% capital return. The five-year record is even more impressive – up +50% compared to the FTSE All-Share’s +31%.
MRCH isn’t just a play on the world economy though, but the UK too. In addition to having 54% of its funds invested in FTSE 100 stocks, a further 39% of its holdings herald from the more domestically oriented FTSE 250. A more stable political outlook and the prospect of further interest rate cuts all bode well for UK mid-caps then. A positive global and domestic outlook allows Questor to be comfortable with MRCH’s11% gearing which could prove to be a useful ally in a rising stock market. And then there’s the income side of the equation. For as well as targeting long-term capital returns, the c. £900m fund looks to deliver above-average dividend growth, a neat fit with the wealth preserver portfolio’s aim to generate above-inflation total returns.
So too is MRCH’s strategy which is to buy stocks with sound fundamentals when they trade at attractive valuations. As Questor concludes “With Merchants having an excellent track record of outperformance, a sound strategy and generous gearing, it is well placed to capitalise over the long term.”
Midas: The property investment trust going cheap and packing a 7.5% dividend
The above-titled article opens with an interesting fact: the UK produces over 25 billion pints of milk a year. What that has to do with Custodian Property Income (CREI), the property investment trust that has caught the attention of The Mail on Sunday’s tipster, to be revealed later. But first, Midas highlights how CREI came to market in 2014 with £100 million worth of property and a £1 share price. Fast forward to today and the property fund’s assets are valued at £590 million. The share price has moved in the opposite direction however – the shares trade below the 80p level. Midas believes “The decline seems overdone and should reverse, as sentiment towards the property industry improves and interest rates continue to fall.”
In the meantime, shareholders are being paid to wait. Last year, CREI paid out 5.8p per share in dividends. This year, 6p per share is being targeted. At the current share price that equates to a 7.5%+ yield. Those high payouts are no one-offs. That’s because management “firmly believes that the main purpose of property firms is to generate reliable income for investors.” And because of those high dividend payments, investors who bought shares at the time of the 2014 listing would have made a 36p return on every 100p invested. That easily beats the 20% return generated by other listed property stocks over the same period.
What’s more CREI has achieved this sector-beating return without taking on excessive risk. At the heart of this is the portfolio’s diversification: properties – at the last count there were 155 spread across the country; tenants – the properties are let to more than 300 tenants, meaning no single tenant accounts for more than 1.5% of the rent roll; and sectors – the portfolio is exposed to a wide range of sectors including out-of-town retail parks and small industrial sites. Because of that diversification, “Custodian has shown that it can deliver through thick and thin, dividends are a big draw. At 79p, the stock is a buy.” As for what connects CREIto the 25 billion pints of milk the UK produces each year – Silgan Closures is a leading producer of lids for plastic milk bottles and produces these at an industrial unit owned by CREI.
££££££££££££
MRCH currently yields just under 5%, so if u wanted to buy and maintain a portfolio yield of 7%, u would need to pair trade it with another yielder.
JLEN Environmental Assets – Vote against discontinuation
18 July 2024
QuotedData
Vote against discontinuation
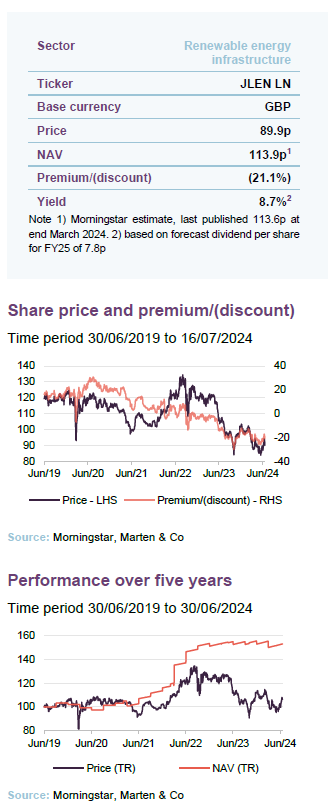
JLEN Environmental Assets (JLEN) and the wider renewable energy infrastructure sector have traded at a persistently wide discount with investor sentiment continuing to wane. This has triggered the activation of a discontinuation vote at JLEN’s AGM in September. We strongly believe shareholders should vote against discontinuation, taking into account the strong long-term track record of the company, which has produced NAV total returns of 119.5% since its launch just over 10 years ago to the end of June and delivered dividend growth every year.
The fundamental growth story for the sector remains as strong as ever, with investment in the energy sector continuing to swell – the majority of which is going to clean energy technology such as renewables, low carbon fuels, nuclear, grids and battery storage.
Progressive dividend from investment in environmental infrastructure assets
JLEN aims to provide its shareholders with a sustainable, progressive dividend, paid quarterly, and to preserve the capital value of its portfolio. It invests in a diversified portfolio of environmental infrastructure projects generating predictable wholly or partially index-linked cash flows. Investment in these assets is underpinned by a global commitment to support the transition to a low-carbon economy and mitigate the effects of climate change.
Fund profile
JLEN invests in infrastructure projects that use natural or waste resources or support more environmentally-friendly approaches to economic activity, support the transition to a low carbon economy, or mitigate the effects of climate change.
JLEN’s assets are broadly categorised as intermittent renewable energy generation, baseload renewable energy generation and non-energy-generating assets that have environmental benefits. Intermittent energy generation investments include wind, solar and hydropower. Baseload renewable energy generation investments include biomass technologies, anaerobic digestion and bioenergy generated from waste. Non-energy-generating projects include wastewater, waste processing, low carbon transport, battery storage, hydrogen and sustainable solutions for food production such as agri- and aquaculture projects.
JLEN aims to build a portfolio that is diversified both geographically and by type of asset. This emphasis on diversification reduces the dependency on a single market or set of climatic conditions and helps differentiate JLEN from the majority of its peers, which tend to specialise in solar or wind.
Reflecting its objective of delivering sustainable, progressive dividends and preserving its capital, JLEN does not invest in new or experimental technology. A substantial proportion of its revenues is derived from long-term government subsidies.
JLEN’s AIFM is Foresight Group LLP (Foresight). Foresight is one of the best-resourced investors in renewable infrastructure assets, with £12.1bn of AUM as at 31 March 2024. This includes Foresight Solar Fund, which sits in JLEN’s listed peer group. Foresight has a highly experienced and well-resourced global infrastructure team with 175 infrastructure professionals managing around 4.7GW of energy infrastructure. It is a global business, with offices in eight countries. The co-lead managers to JLEN are Chris Tanner and Edward Mountney.
Annual results
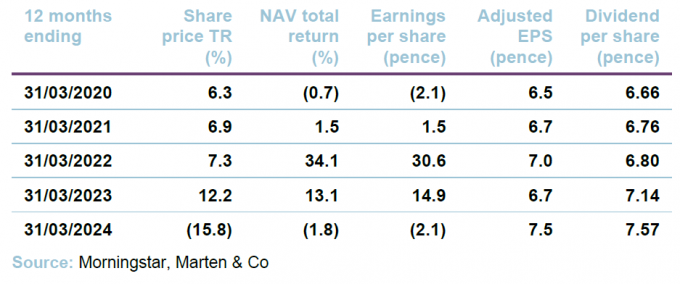
In annual results announced last month, JLEN reported a total NAV of £751.2m or 113.6p per share at 31 March 2024 – a 7.7% fall over the year. This equated to a NAV total return of -1.6% including dividends of 7.57p (which were 6% up on the prior year). JLEN’s NAV total return since IPO is 115.9% (8.0% annualised).
Cash from projects at record high underpinning the dividend
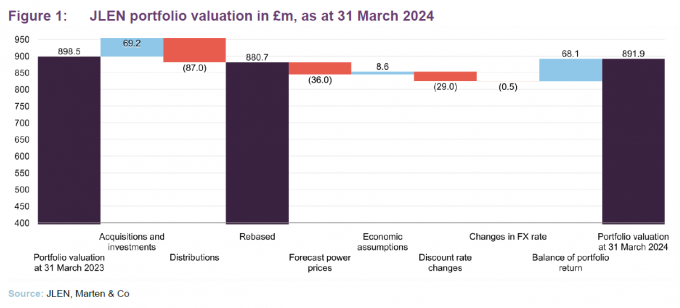
Distributions received from projects were at a record high of £87.0m (2023: £83.6m) and underpinned the dividend with a coverage of 1.3 times. The value of the portfolio fell £6.6m over the period, as shown in Figure 1, due mainly to changes in power price and discount rate assumptions, offset by underlying growth in the portfolio.
Discontinuation vote
As with many of its renewable energy and infrastructure peers, JLEN’s shares have been trading at a wide discount since interest rates ballooned in 2022. With the discount having averaged more than 10% in the financial year, a discontinuation vote has been triggered, which will take place at the company’s AGM in September.
Somewhat counterintuitively, shareholders should vote against the resolution if they want the company to continue. We believe this is the course investors should take, given the strong long-term track record of the company (see page 15), including delivering dividend growth every year since its launch 10 years ago (see page 19 for the dividend section).
Change in name and cut in management fee proposed
A reduction in the investment management fee will come into effect from 1 October (see page 21 of this note for details), while the board has proposed to shareholders a change in name of the company to Foresight Environmental Infrastructure – to reflect the fact that it has been five years since Foresight acquired the management team of John Laing (which informs the current name). The board states that it has assessed the benefits available through a closer association with the investment manager – including the scale afforded by its broader marketing initiatives and strong market reputation – and believes that there are clear commercial benefits to renaming the company. Should shareholders approve the proposed change of name, the board is recommending the company’s ticker change to FGEN and its website address switch to FGEN.com.
Market backdrop
The timing and pace of the impending interest rate cutting cycle is unknown, but the general consensus seems to be that the first rate cut in the UK will come in August – despite inflation falling back to the Bank of England’s target 2% in May. The first downward move in the base rate will be an important moment for many sectors, not least renewable energy infrastructure, where the higher interest rate landscape has put a substantial downward pressure on NAVs and, even more so, investor sentiment.
A general acceptance that the eventual pace of cuts is likely to be slower than first thought, plus the impact of falling inflation on cash flows from energy-generating assets and continued geopolitical instability, has seen discounts across all infrastructure companies remain persistently wide.
Estimated $2.8trn invested in energy sector in 2023, the majority of which aimed at clean energy technology
However, the fundamental growth story for the renewable energy infrastructure sector and JLEN remains as strong as ever, with the green agenda an urgent priority of most global governments. The International Energy Agency (IEA) has estimated that investment in the energy sector amounted to $2.8trn in 2023, of which more than 60% was invested in clean energy technology such as renewables, low carbon fuels, nuclear, grids and battery storage.
There seems to be political support across the benches for boosting clean energy capabilities in the UK and in Europe (key markets for JLEN), despite the recent European Union elections. The new Labour government in the UK has pledged to ‘make Britain a clean energy superpower’ and has vowed to work with the private sector to double onshore wind, triple solar power, and quadruple offshore wind by 2030, while also investing in carbon capture and storage, hydrogen and marine energy to ensure the country has the long-term energy storage it needs. This is in contrast to the US, where a Trump administration seems likely to scrap the Inflation Reduction Act (IRA, which has worked well in incentivising investment in green technology).
JLEN’s diversified portfolio and the manager’s strong track record and expertise in the sector seems completely at odds with its current discount of 21.1%. JLEN’s board has set out its approach to capital allocation, which includes prudent management of debt and consideration of share buybacks if they are NAV accretive. We explore the factors impacting JLEN’s NAV in detail below, beginning with power prices.
Power prices
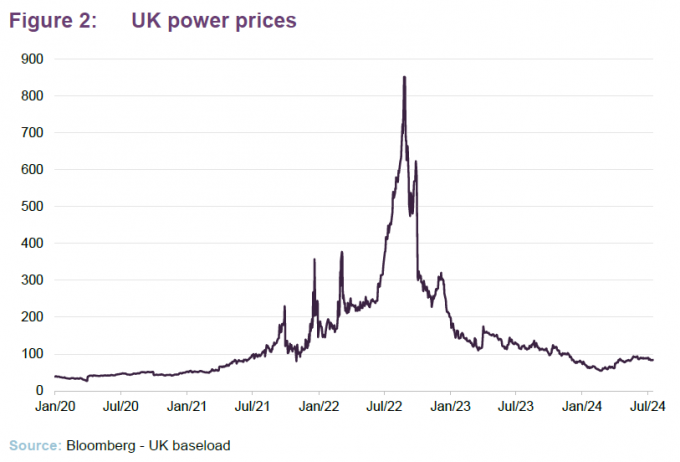
Despite having already fallen steeply from highs seen in 2022, electricity prices continued to fall further and faster than anticipated over the last year, as shown in Figure 2.
The overall change in forecasts for future electricity and gas prices compared to forecasts at 31 March 2023 negatively impacted JLEN’s NAV by £36.0m or 5.4p in the year to the end of March 2024.
Fixed prices secured on the majority of portfolio
JLEN looks to de-risk its exposure to volatile market prices and has fixed prices for the majority of its output. At 31 March 2024, the portfolio had price fixes secured over 61% for the Summer 2024 season and 58% for Winter 2024/25 season. Short-term market forward prices for the next two years are used to value the portfolio where contractual fixed price arrangements do not exist. After the initial two-year period, the project cash flows assume future electricity and gas prices in line with a blended curve informed by the central forecasts from three established market consultants.
Based on the portfolio at end March 2024, a 10% fall in power prices over the remaining life of JLEN’s assets would take off £37.4m or 5.7p from the NAV and a 10% increase would add £37.0m or 5.6p to the NAV. Even though the last months of the previous year had already seen electricity prices fall sharply from the highs seen during the energy crisis in 2022, electricity prices continued to fall further and faster than anticipated. In the year to March 2024, power prices reduced by a further £40/MWh – equivalent to approximately 40%.
JLEN’s manager states that in the extreme event that electricity prices fall to only £40/MWh, the company would maintain a resilient dividend cover for the next three financial years.
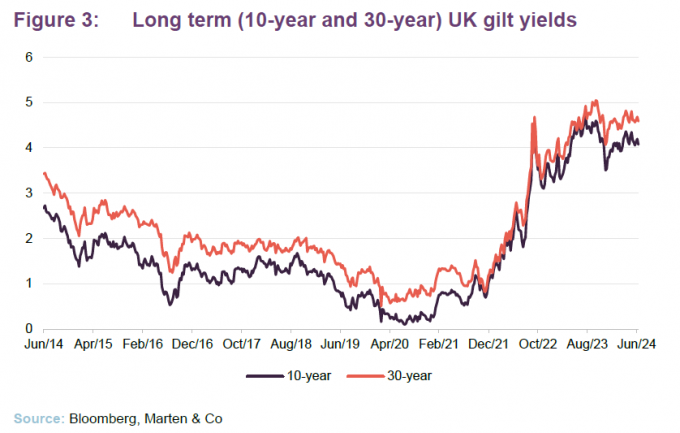
Discount rates
Gilt yields have remained at an elevated level for almost two years, as shown in Figure 3. Government borrowing costs rose sharply from the beginning of 2021 and accelerated in the fallout from the ‘mini budget’ of September 2022 and have remained elevated since.
The weighted average discount rate now sits at 9.4%
JLEN’s weighted average discount rate has remained unchanged over the six months to 31 March 2024 at 9.4%. This is 100bps higher than a year prior due to an upward movement in the discount rate applied in June and September 2023, reflecting the sustained increase in UK gilt yields as well as continued investment into JLEN’s ongoing development and construction projects (which are valued using higher discount rates to reflect the development risk). However, the discount rate was reduced on some construction projects that achieved key milestones during the year.
The overall uplift in discount rate over the year took £29.0m off the NAV.
The discount rates that are used in the discounted cash flow calculations that inform the NAVs of many alternative assets funds, including those in the renewable energy sector, can be broken down into the risk-free rate – derived from the yield on a government bond with equivalent duration – plus a risk premium. The risk premium element of the discount rates calculation is influenced by various factors including the composition of the portfolio and investors’ risk appetite for these sectors and projects, based on recent comparable market transactions.
An independent verification exercise of the methodology and assumptions applied in JLEN’s NAV calculation is performed by a leading accountancy firm and an opinion provided to the directors on a semi-annual basis.
Inflation
Inflation assumptions upgraded slightly
62% of JLEN’s forecasted revenues are contractually linked to inflation (as measured by the RPI) through government-backed subsidies and long-term contracts. An uplift in inflation assumptions used to value JLEN’s portfolio (based on actual data and independent forecasts) to 3.5% RPI inflation for 2024 (from an assumption of 3.0% at 31 March 2023) – reverting to 3% until 2030, and then falling to 2.25% thereafter – resulted in an overall increase in value of £8.6m.
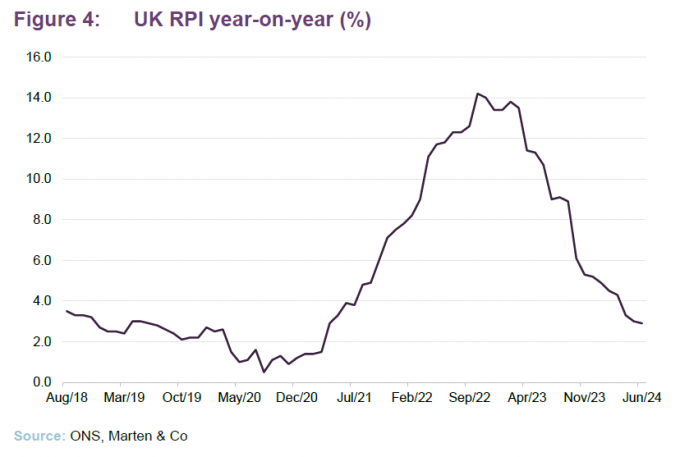
Figure 4 shows that RPI inflation fell to 2.9% in June 2024. JLEN’s sensitivity to changes in the inflation rate is about +£19.3m or 2.9p on the NAV for every 0.5% increase in the forecast inflation rate and a decrease of £18.9m or 2.9p on the NAV if rates were reduced by the same amount.
Useful economic lives
The assumption JLEN uses for the useful economic life of investments is the lower of lease duration and 35 years for solar assets, 30 years for wind farms and 20 years for anaerobic digestion (AD) facilities – being the life of the RHI subsidy. JLEN applies a conservative valuation in regard to its AD assets, with the assumption that the facilities will simply cease to operate beyond the life of their RHI tariff. The manager says that it has seen a growing case of evidence, including several transactional datapoints, pointing towards a positive change in market sentiment for valuing these assets – including the potential to run anaerobic digestion facilities on an unsubsidised basis.
In light of this change, the manager has provided a sensitivity extending the useful economic lives of its AD portfolio by up to five years – capped at the duration of land rights already in place. Such an extension would result in an uplift in the portfolio valuation of £21.9m or 3.3p.
Taxation
As we discussed in more detail in previous notes (links to which can be found on page 24), the UK government introduced a temporary windfall tax on electricity generators – the Electricity Generator Levy (EGL) – in response to higher energy prices. JLEN’s wind, solar and biomass assets are affected by the levy, which saw the government take 45% of revenues above a price of £75/MWh from 2023 to April 2024, and thereafter adjusted each year in line with inflation (as measured by CPI) on a calendar-year basis until the levy comes to an end on 31 March 2028. JLEN paid £5.5m on the EGL tax in the financial year, with the annual liability for the 2025 financial year estimated to be lower, reflecting the drop in power price forecasts year-on-year.
Around 42% of JLEN’s assets at the end of September 2023 fell completely outside of the levy. The managers say that this is a strength of having a diversified portfolio that has a combination of assets that generate electricity (and fall in the scope of the levy), assets that generate gas (the anaerobic digestion plants), and assets that do not generate energy at all (batteries, CNG refuelling stations, and the controlled environment assets).