Good day! Do you use Twitter ? I’d like to follow you if that would be okay. I’m absolutely enjoying your blog and look forward to new posts.
£££££££££££££
I currently do not Tweet and as I’m busy outside of the market I cannot enter into any direct email, hopefully this may change next year. Until then keep on keeping on.
Looking further back, £10,000 invested in the US market 20 years ago would now be worth £106,445 compared to £39,293 if invested in the UK (according to Morningstar total return in GBP to 31 October 2024). Other major markets have done a bit better than the UK, but neither European nor Japanese indices can hold anything resembling a candle to the S&P 500.
If you take the figure of £106,445 and using the 4% rule u could withdraw income of £4,257.80
If you had invested in a dividend compound plan with a blended yield of 6% you would have income of £1,605.00.
The gamble being, will the next 20 years be the same as the
last 20 years ?
One option could be to have a foot in each camp and sleep soundly at night.
Another option would be, if you were lucky enough to have turned 10k into a 100k to buy dividend income Trusts returning 7% plus as opposed to withdrawing your hard earned using the 4% rule.
Markets seem to approve of the election of Donald Trump as the 47th US President. The S&P 500 has hit a record high in the wake of the election result, crossing over the 6,000 mark for the first time. This latest bump comes on the back of an exceptional run for US stocks, which has put other regional markets firmly in the shade, including the UK’s own stock market.
The historic performance differential is dramatic. £10,000 invested in the US stock market 10 years ago would be worth £42,248 now, compared to £18,186 if invested in the UK stock market.
Looking further back, £10,000 invested in the US market 20 years ago would now be worth £106,445 compared to £39,293 if invested in the UK (according to Morningstar total return in GBP to 31 October 2024). Other major markets have done a bit better than the UK, but neither European nor Japanese indices can hold anything resembling a candle to the S&P 500.
10 year
20 year
S&P 500 (US)
322.5
964.5
TOPIX (Japan)
132.7
271.1
MSCI Europe Ex-UK
118.9
352.3
FTSE All-Share (UK)
81.9
292.9
Source: Morningstar to 31 October 2024
It’s no wonder investors have been pulling out of UK funds and ploughing their money into US funds, and also into global funds which have a high exposure to the US, thereby posting exceptional performance too.
Since the beginning of 2015, retail investors have pumped £8.5 billion into US funds, £32.2 billion into global funds, and on the other side of the ledger have withdrawn £54.7 billion from UK funds, according to Investment Association data.
No guarantee that markets will continue to do well
The US stock market has been on a sustained and rewarding winning streak, but investors still need to be wary of chasing past performance.
Buying what’s gone up has been a winning strategy for a long time, but history tells us when market trends change, they can do so with a vengeance.
The US is home to some of the most profitable companies in the world, most notably in the technology sector, and despite their mammoth size, these firms are still churning out exceptional levels of growth.
The AI boom has added another leg to the bull market in US stocks, and though not everyone is a believer, enough investors have bought into the artificial intelligence story to propel share prices in the US technology sector even further into the stratosphere.
The expected growth trajectory of the Magnificent Seven (Alphabet, Amazon, Apple, Meta, Microsoft, Nvidia, and Tesla) means lofty valuations are attached to the shares of these companies.
So far, the tech titans have delivered on their promise, leaving the doubters choking on their words of disapproval. But high valuations mean a considerable amount of good news about the future is already in the price, which presents a risk. Should big tech companies post disappointing earnings, the market could rapidly reprice to take account of a lower growth trajectory.
The US represents a large part of the global stock market
Investors in the US stock market also need to be mindful of the concentration risk that has built up as a result of the narrow market leadership of a few stocks.
Currently 73% of the MSCI World Index, one of the most widely used benchmarks of the global stock market, is invested in the US. That means the many global passive funds which track the MSCI World Index are increasingly becoming US tracker funds.
Almost three quarters of these funds will be invested in the US stock market, with 22% invested in the Magnificent Seven technology stocks.
If you buy a S&P 500 tracker fund, 31% will be invested in the Magnificent Seven. These are relatively high weightings to individual stocks, and the risk is amplified by the US tech titans sharing overlapping characteristics and investment cases.
It’s certainly not a good idea to ignore the US stock market entirely, as anyone who has sat on the sidelines over the last decade will tell you, provided they can stifle their howls of anguish for a moment. But it’s important to recognise that investing in the US isn’t a one-way bet, no matter how compelling a story is laid out by historic performance.
The high valuations attached to a small group of tech companies, combined with the high weighting these stocks in global and US indices should give investors some pause for thought.
As ever, it’s important to look under the bonnet of funds you hold to make sure you’re happy with the investment philosophy and the risks taken. That even applies to passive investors in US and global tracker funds, who may be shocked to learn much money they have invested in a small number of companies.
Disclaimer: These articles are for information purposes only and are not a personal recommendation or advice. Past performance is not a guide to future performance and some investments need to be held for the long term.
Enhanced dividend strategies are growing in popularity, what do they offer investors?
Ryan Lightfoot-Aminoff Kepler
Disclaimer
This is not substantive investment research or a research recommendation, as it does not constitute substantive research or analysis. This material should be considered as general market commentary.
The growing prevalence of enhanced dividend strategies has been one of the investment trust industry’s low-key emerging trends in the past few years. Pioneered by European Assets (EAT) in 2001, this typically involves taking a contribution from the trust’s capital to top up the portfolio’s underlying revenue in order to boost the income paid out to shareholders. A tweak to the UK rules in 2012 has led to a steady increase of trusts adopting this approach, with over 20 now offering some level of enhanced dividend. With this approach growing in popularity, we look at what it offers boards and managers, how investors can benefit, and whether there are implications for a trust’s discount.
The case for an enhanced dividend
The enhanced dividend strategy works by using a portfolio’s capital reserves to supplement the underlying income a portfolio generates and then paying this combined amount out to investors. It’s important to note that neither capital nor revenue reserves are pots of cash, a point that is often misunderstood. What we are talking about is accounting identity. Portfolio income is, in an equity investment trust, typically reinvested in the portfolio, and an amount is added to the revenue account. When a dividend is to be paid, the manager will sell some investments to raise the actual cash to be paid out, and then write down the revenue account. It’s the same process when paying from capital, meaning investments are sold to raise funds, except there is no requirement for the cash to be ‘raised’, or debited, from the revenue account.
To provide clarity to investors, many trusts implementing an enhanced dividend policy will set out an income goal for the year, such as Invesco Asia (IAT) w adopted a policy in 2021 to pay out 2% of NAV every six months. In the years since its adoption, IAT’s dividend per share has been on average just over double the earnings per share, showing that investors are receiving an income of almost double what they would have if such a policy wasn’t in place.
Whilst the income benefits for shareholders may seem obvious, an enhanced dividend policy also provides some perks when it comes to capital returns. With the trust’s income effectively taken care of, the managers have more freedom to invest in what they believe are the best opportunities from a total return perspective, without being beholden to income targets. This helps reduce the conflict managers may find themselves in when deciding whether to invest in stocks with high future growth potential or those offering high yields today. This could help improve the overall performance of the trust in the long term, as managers are under less pressure to generate income in the near term which may come at the expense of future capital growth.
With several trusts now offering attractive yields, despite investing in asset classes that are not typically high-yielding, income hungry investors have a wider range of asset classes to choose from. This not only creates opportunities for better portfolio diversification but also means investors are less reliant on traditional income asset classes such as bonds or value equities. JPMorgan has been one of the biggest adopters of enhanced dividend policies, which have been implemented in five trusts in their range. This includes trusts investing in China and UK smaller companies, not areas famed for their income potential. However, the enhanced dividend strategy has meant that these trusts could be useful for income investors and enable them to create a more diverse portfolio.
Moreover, this could provide style diversification benefits too, as several trusts with enhanced dividend policies are run with a growth mindset, meaning their portfolios will consist of very different companies to the value-orientated ones typically in an income portfolio. One example is JPMorgan Global Growth & Income (JGGI). Through a series of mergers and strong performance, JGGI has grown to one of the largest trusts in the global sector and is managed with a strong growth bias. This has led to top ten holdings including Microsoft, Nvidia, and Meta, which are unlikely to populate income portfolios. Despite this, the trust’s enhanced dividend policy of paying out at least 4% of the NAV per annum has meant it could have appeal to both income and growth investors. It also means income investors can balance JGGI’s growth bias with more traditional income assets in a portfolio, whilst still generating a good income.
Some trusts, such as JPMorgan UK Small Cap Growth & Income (JUGI), use the NAV at the end of the previous financial year to set the amount for the next four quarterly dividends, meaning investors can be more certain of what they will receive in absolute terms, although as the NAV may rise or fall throughout the year. On the other hand, some trusts, such as IAT, will calculate the dividend amount based on the NAV at different points in the year, meaning the amounts can fluctuate.
CT Private Equity Trust (CTPE) has a slightly different approach, with dividends set through a strict formula which has been consistently applied since 2012. The dividend formula gives shareholders a highly predictable and secure income stream, with the annual dividend set at a rate equivalent to 4% of NAV, based on the average of the last four quarterly NAVs. However, if in any quarter this figure implies a reduction in the dividend, the quarterly dividend payable will be maintained. A result of this approach is that CTPE is now a ‘next-generation dividend hero’, having increased its dividend for ten or more years.
For trusts that follow any of these approaches, it is not hard to see that the dividend itself is not as reliant on the prevailing dividend environment, as is the case in more traditional income portfolios. This was best demonstrated in the early days of the COVID pandemic, when many companies suspended their dividends which put a strain on many income-focussed mandates, particularly in the open-ended space. However, almost all equity income investment trusts managed to maintain or grow their dividend. This was either by using revenue reserves or in the case of trusts with enhanced dividend policies, capital reserves. As such, enhanced dividend strategies can also support income resilience which may be particularly attractive during periods of market weakness.
One of the criticisms of an enhanced dividend strategy is that it arguably comes at the cost of long-term growth. By selling shares to pay out to investors as income, enhanced dividend strategies are effectively just returning capital to investors in another form. The argument goes that by doing so, it means managers are clipping profits and not allowing their best positions to run. This effect is particularly troubling during periods of market weakness, where managers are in effect compounding capital losses by selling assets at depressed valuations to pay dividends. Whilst the outcome of maintaining a dividend may provide comfort in the short term, it arguably damages the long-term growth potential.
Furthermore, returning capital to shareholders in the form of a dividend may have tax implications for investors. This is especially true of individuals or retail shareholders as the dividend allowance of £500 is considerably less than the capital gains allowance of £3k (as of the time of writing). However, we note that this is not an issue for those holding these assets in a tax-efficient wrapper such as a SIPP or ISA.
Do dividends determine discounts?
Despite the potential drawbacks, adopting an enhanced dividend policy can help differentiate a trust and potentially increase its appeal to a wider pool of investors. As such, one of the reasons often touted for adopting an enhanced dividend policy has been as a way of narrowing a trust’s discount. It is a tool often used as an alternative to share buybacks which might have negative effects such as reducing the size of the trust. One might argue that a narrower discount could be seen as a judgement on the debate above by the market as a whole: if the discount narrows, the pro argument has won.
To see whether enhanced dividend policies influence discounts, we have looked at the discounts of trusts using an enhanced dividend policy against the average of their peer groups. We have concentrated the analysis on trusts operating in publicly-listed equities due to the complications of other structures. Of these trusts, just over half trade at a premium to their peers, with an average discount of 1.6% narrower than the average for the peer group. This basic analysis suggests to us that an enhanced dividend policy may have a small positive impact on the trust’s rating.
ENHANCED DIVIDEND EQUITY TRUST’S DISCOUNT
trust
sector
trust discount
sector average discount
relative rating
BlackRock Sustainable American Income
North America
-12.47
-19.00
6.53
Henderson Far East Income
Asia Pacific Equity Income
3.65
-7.10
10.75
Invesco Asia
Asia Pacific Equity Income
-10.78
-7.10
-3.68
JPMorgan Asia Growth & Income
Asia Pacific Equity Income
-10.54
-7.10
-3.44
abrdn Asia Focus
Asia
-19.56
-11.50
-8.06
JPMorgan China Growth & Income
China
-13.35
-12.80
-0.55
European Assets
Europe
-12.42
-10.70
-1.72
JPMorgan European Growth & Income
Europe
-11.63
-22.00
10.37
Invesco Global Equity Income
Global Equity Income
-8.48
-4.30
-4.18
STS Global Income & Growth
Global Equity Income
-0.59
-4.30
3.71
JPMorgan Global Growth & Income
Global Equity Income
1.35
-4.30
5.65
Martin Currie Global Portfolio
Global
-2.48
-9.60
7.12
Bellevue Healthcare
Biotech & Healthcare
-8.78
-14.90
6.12
International Biotechnology
Biotech & Healthcare
-12.45
-14.90
2.45
Schroder Japan Trust
Japan
-15.63
-12.40
-3.23
BlackRock Latin American
Latin America
-13.80
-13.80
0.00
Invesco Perpetual UK Smaller
UK Smaller Companies
-16.64
-11.80
-4.84
JPMorgan UK Small Cap Growth & Income
UK Smaller Companies
-5.27
-11.80
6.53
Montanaro UK Smaller Companies
UK Smaller Companies
-11.20
-11.80
0.60
Average
1.59
Source: Morningstar, as at 31/10/2024
However, looking at one data point is just a snapshot and can be easily affected by specifics. Therefore, to assess the change in the market’s judgement over time, we have looked at several examples of strategies that have adopted these policies and studied what has happened to their discounts in the period before and after the announcement of a new policy.
One of the most recent adopters of this policy has been JUGI. This trust is the result of a combination between the firm’s UK small-cap and mid-cap trusts in the first quarter of 2024. As part of this corporate activity, a new enhanced dividend policy was announced that sees the trust pay c. 4% of NAV per annum in four equal payments. This began in August 2024. In the chart below, we have shown how the discount of JUGI has changed in the year leading up to the announcement on 14/11/2023 and the period since. Following the completion of the corporate activity, JUGI’s discount has narrowed significantly, leading the trust to trade at a notable premium to the sector average, and close to NAV for the first time since the market highs of 2021. In the year before the announcement, JUGI (at the time, JMI) traded at an average discount of 12.1%, at an average 0.4% discount to the peer group. In the period since, the average discount has narrowed to 8.3%, which is an average 2.7% premium to the peer group.
JUGI: DISCOUNT VERSUS SECTOR
Source: Morningstar
This has arguably come at a fortuitous time for JUGI. The enhanced dividend policy was one of a series of announcements as part of the combination, which brought benefits such as better liquidity and lower charges. It has also coincided with a period of strong performance for the trust, following a rare period of weakness as the managers’ investment style fell out of favour. However, whilst it may have coincided with a number of positive factors, the discount has narrowed following the announcement and implementation of an enhanced dividend policy.
Looking further back, we have also looked at the history of abrdn Asia Focus (AAS), an Asian smaller companies trust managed by the three-strong team of Flavia Cheong, Gabriel Sacks, and Xin-Yao Ng. The board introduced an enhanced dividend policy in 2021 to provide a higher yield to investors from an asset class not typically associated with high income. The trust already had a strong history of either maintaining or increasing its ordinary dividend, having done so every year since 1998, as well as regularly paying out special dividends. For the 2024 financial year, the trust has paid out 7.42p per share, equivalent to a yield of 2.6% based on the share price as of 30/10/2024. This is an 18% premium to the most recent published yield of the trust’s benchmark, as well as the wider MSCI ACWI Small Cap Index which yields 2.1%.
In the year leading up to the announcement of the dividend policy on 30/11/2021, AAS had an average discount of 11.6%. This was at an average discount to the sector average of 2.5%. In the year following the announcement, AAS’s average discount was actually wider at 12.6%, though this was closer to the sector average at -1.2%. This suggests that whilst the enhanced discount policy did not lead to the trust trading at a narrower discount in absolute terms, it may have improved the trust’s rating versus its peers.
AAS: DISCOUNT VERSUS SECTOR
Source: Morningstar
To see if this has had a similar effect over a longer time period, we have looked at the discount history of two trusts that have had enhanced dividend policies for many years and analysed how their discounts have fared versus peers. Firstly, here is Montanaro UK Smaller Companies (MTU). trust adopted a quarterly dividend equal to 1% of NAV in 2018, with the explicit goal of trying to increase the appeal to retail investors and therefore narrowing the discount.
Here, the impact is very stark. In the ten years before the enhanced dividend policy was declared on 25/07/2018, MTU traded at an average discount to the peer group of 4.3%, but in the six-plus years since, this has narrowed significantly, with the average discount since just 0.1%. In fact, the trust traded at a premium to the sector for much of the period, including several periods where this premium was in the double digits relative to the sector. More recently, some short-term weakness in the share price has meant the trust’s rating is currently trading in line with peers, which we would argue could be seen as an opportunity. Furthermore, as is the case with many trusts using an enhanced dividend policy based on NAV, it means the yield investors may receive is actually a little higher than the headline rate because of the discount. Whilst MTU pays a dividend equivalent to 1% of NAV per quarter, the current historic yield is 4.6% due to the trust’s double-digit discount.
MTU: DISCOUNT VERSUS SECTOR
Source: Morningstar
Our final example is EAT. As the pioneer of the approach, this trust has the longest track record available. The trust first started paying dividends from capital in 2001, which was allowed due to its dual listing in London and the Netherlands. At the time, HMRC had a rule against paying dividends from capital reserves, though this was removed in 2012, opening up the strategy to others. EAT’s management team primarily focus on mid- and small-cap European equities, though the dividend policy is to pay annual dividends of 6% of the closing NAV of the preceding financial year in four equal payments. This headline rate is nearly double that of the index at 3.1% as of 30/09/2024 and vastly ahead of its peers which range from 2.83% to 0.78% according to Morningstar.
We have shown EAT’s discount track record going back to May 2008 in the chart below. This shows that the trust’s discount has traded at a premium to the sector average for almost the entire time. Only a short period in late 2020, soon after the COVID vaccine was announced, did the sector trade at an average discount narrower than EAT. We believe this is a strong indication that enhanced dividend policies do have a positive effect on narrowing discounts. This is particularly impactful in the European smaller companies sector as there are no other trusts operating a similar approach, meaning EAT is a clear differentiator in this regard. That said, we note that EAT has slipped to a wider discount than the peer group in the past few months. This is one of the longest sustained periods of relative weakness in the past 16 years. Whilst this arguably reflects some performance headwinds, it could be seen as an opportunity for long-term investors, especially as it has pushed up the historic yield to over 7%.
EAT: DISCOUNT VERSUS SECTOR
Source: Morningstar
Conclusion
The practice of boosting the natural yield of a portfolio by paying dividends from capital is a clear demonstration of the flexibility and benefits of the investment trust structure. It increases the appeal of several asset classes to a wider range of investors and can make for useful tools for blending uncorrelated income streams as part of a wider portfolio.
Furthermore, over the long term, as we have shown it can prove useful in helping narrow a trust’s discount, especially versus peers, although it is not enough on its own to prevent wider macro factors affecting a trust’s discount. However, the wide discounts seen across the investment trust sector at present mean that the yields on offer look even more attractive due to many of them being calculated on a trust’s NAV. Moreover, the challenges seen in the wider economy have meant that many trusts are trading at wide discounts and several trusts with enhanced dividend policies are not trading at the premium rating they historically have done. This arguably creates an opportunity for long-term investors. With interest rates beginning to come down, those on a wider discount could soon benefit from improved optimism, whilst their elevated and reliable yields will only look more attractive on a relative basis.
The Company is on track to deliver its target dividend of 6.32p per share for the financial year to 31 March 2025, covered by net operational cash received from investments.
The past couple of inflation-hit years have shown how a second income can be worth its weight in gold. For me, the simplest way to generate income is through dividend shares. When carefully chosen, they offer a reliable stream of cash that I can spend, save, or reinvest to fuel the compounding process.
Walk the walk
One thing I want from a dividend-paying firm is a commitment to increasing its annual payout over time.
But hang on. Don’t most companies have a “progressive” dividend policy? Well, yes, in theory. But I want evidence that a company can back up its promise with actions.
The easiest way to judge this is by looking at the firm’s track record. How long has it been consistently increasing its dividend?
Take Diageo (LSE: DGE), for example, which owns category-leading brands like Guinness, Johnnie Walker, and Don Julio premium tequila. It’s increased its payout for over 25 years, making it a Dividend Aristocrat.
My ideal scenario is that a stock pays me income for life. I reckon Diageo has a chance of doing so, which is why I’m a shareholder.
In contrast, some shares have a dreadful track record of creating long-term shareholder value, including BT and Vodafone. So I tend to stay away from these.
Supermarket shelves to pub taps
Now, the caveat here is that even the most well-run companies can come unstuck due to black swan events. The global pandemic, for example, forced many businesses to suspend shareholder distributions.
In most cases, this was a wise move, as nobody knew how long the pandemic would last. Some had to take on huge debt to survive and have only just started paying dividends again. Rolls-Royce is one such high-profile example.
Diageo did carry on paying dividends throughout Covid though, demonstrating the resilience of its business. And last year, even after profits took a hit, it hiked the dividend 5%.
Despite these challenges, I’m confident in the long-term income prospects from Diageo. Its top-tier brands have growth potential in huge emerging markets like India, while it’s also building out its alcohol-free drinks portfolio.
For example, Guinness 0.0 has been gaining serious traction. In the year to June, it doubled its net sales in Europe and became the UK’s number one non-alcoholic beer.
As a shareholder, I felt duty-bound recently to do some boots-on-the-ground research to see what all the fuss was about. I was actually very impressed, and can see why Guinness 0.0 has successfully transitioned from supermarket shelves to pub taps.
Unusually high yield
The Diageo share price has fallen 42% in just under three years. This is due to high inflation, which has caused a severe downturn in the global alcohol industry.
One thing this has done is push up the forward dividend yield to 3.7%. This is historically rare for Diageo and was one reason why I added to my holding a couple of months back.
The post I’d buy this FTSE dividend share to target a lifelong second income appeared first on The Motley Fool UK.
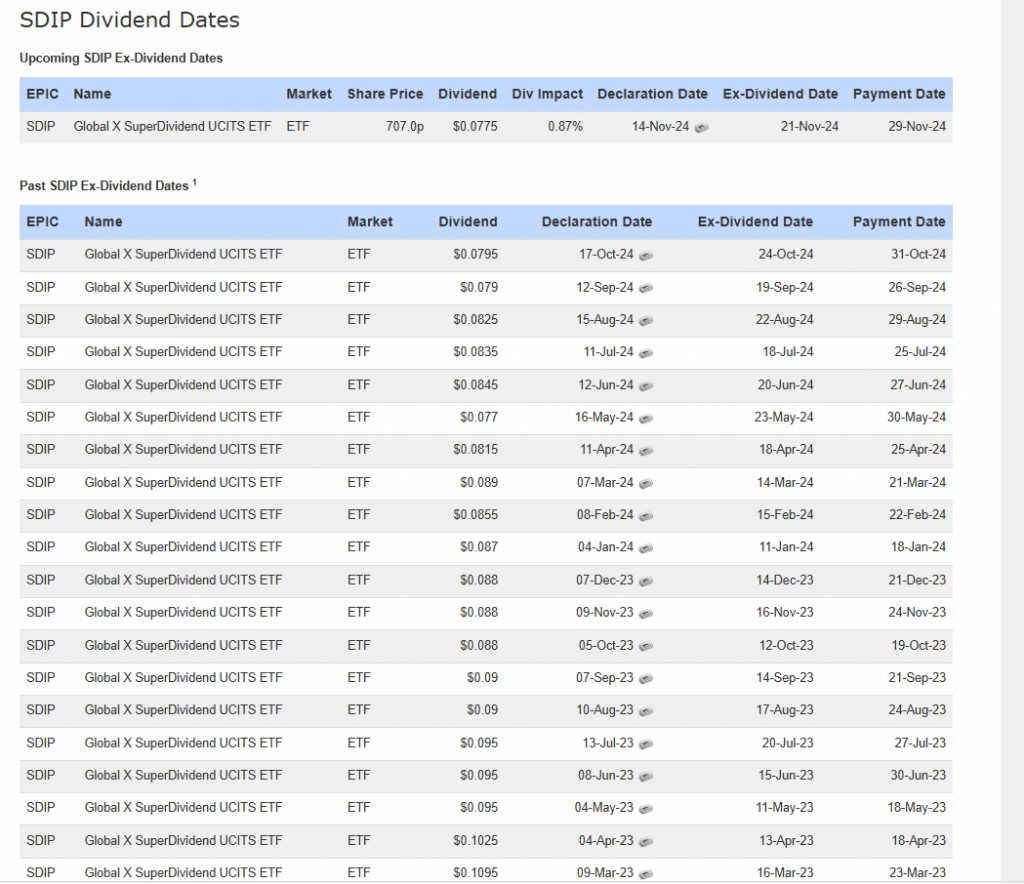
I’ve invested another £900 in SDIP. I usually try to re-invest round sum amounts but there are some dividends to be added to the account this Friday but SDIP goes xd on Thursday. I always feel uncomfortable having cash which isn’t contributing to the Snowball.
Note the dividend is declining, partly because it’s paid U$ dollars but something to monitor.
Hey there! This is kind of off topic but I need some advice from an established blog. Is it difficult to set up your own blog? I’m not very technical but I can figure things out pretty quick. I’m thinking about creating my own but I’m not sure where to start. Do you have any tips or suggestions? With thanks
££££££££££££
I am using Fasthosts, who use WordPress. The monthly fee is £7.20, which is discounted for the first six months.