
Month: December 2024 (Page 8 of 9)

Sequoia Economic Infrastructure Income Fund Limited
(the “Company”)
STRONG INTEREST INCOME GENERATION FROM RESILIENT PORTFOLIO WELL POSITIONED TO DELIVER ATTRACTIVE AND SUSTAINABLE RETURNS
Interim Results for the six months ended 30 September 2024
KEY HIGHLIGHTS
Resilient portfolio generating substantial cash
· NAV per share growth of 1.3% to 95.03p (FY24: 93.77p), driven in part by the strong interest income of the portfolio (94.37p as at 31 October 2024).
· Total dividends of 3.4375p per share, consistent with full year target of 6.875p. First half dividend yield of 8.6%. Dividend cash cover of 1.06x.
· Total NAV return of 5.1% in the first half, on track to meet target annual gross return of 8-9%.
· Significantly outperformed Gilts by 3% over the six-month period and broadly in line with leveraged loans and high-yield bonds.
I LOVE dividends. What beats sitting back, collecting payments – from businesses who’re serving customers every day? Dividends can have a huge impact on an investor’s returns. Just look at the FTSE-100, for example. In 20 years – from 2000 to 2020 – this popular index of UK shares barely moved. However, with dividends included, the FTSE-100 returned 122%. Almost all of the gains came from the dividends. And this income potentially helped shield investors during market declines. Of course, nothing is guaranteed. Investors must choose the right dividend shares in quality companies. So before buying any income stock, we believe it’s important to check: 1. Is the dividend yield high enough? Yield is the expected annual income relative to the current share price. For example, a £10 stock paying a £0.50 annual dividend has a 5% dividend yield. Finding this number is easy. Type any stock into Google to see its dividend yield at a glance. In general, we suggest looking for stocks paying a 2-6% dividend yield. Anything smaller could mean better options are elsewhere. Anything larger might be a red flag – which brings me to the second check: 2. Is the dividend sustainable? Dividends are never guaranteed. And there’s no point collecting a huge dividend if it’s more likely to eventually get cut. That’s why it’s crucial to check the company’s ‘Payout Ratio.’ Divide the company’s dividend by its earnings per share. This reveals the percentage of net earnings paid out as dividends. The right payout ratio depends on the company and its industry. However, 30-75% is a good general range. 3. Is the dividend consistent? Better still, is it GROWING? Some income stocks have monster track records – paying dividends for 30, 40 and even 50+ straight years. Although past performance does not guarantee future performance, nor does past dividend guarantee future dividends, I see it as a positive sign to consider. Others (often called ‘Dividend Aristocrats’) have even increased the dividend every year. Sometimes for decades without fail. ANY company can cut its dividend. However, it’s arguably less likely with those who’ve built a long track-record. If they did cut the dividend, it would potentially have a bigger impact on the company’s market value. |

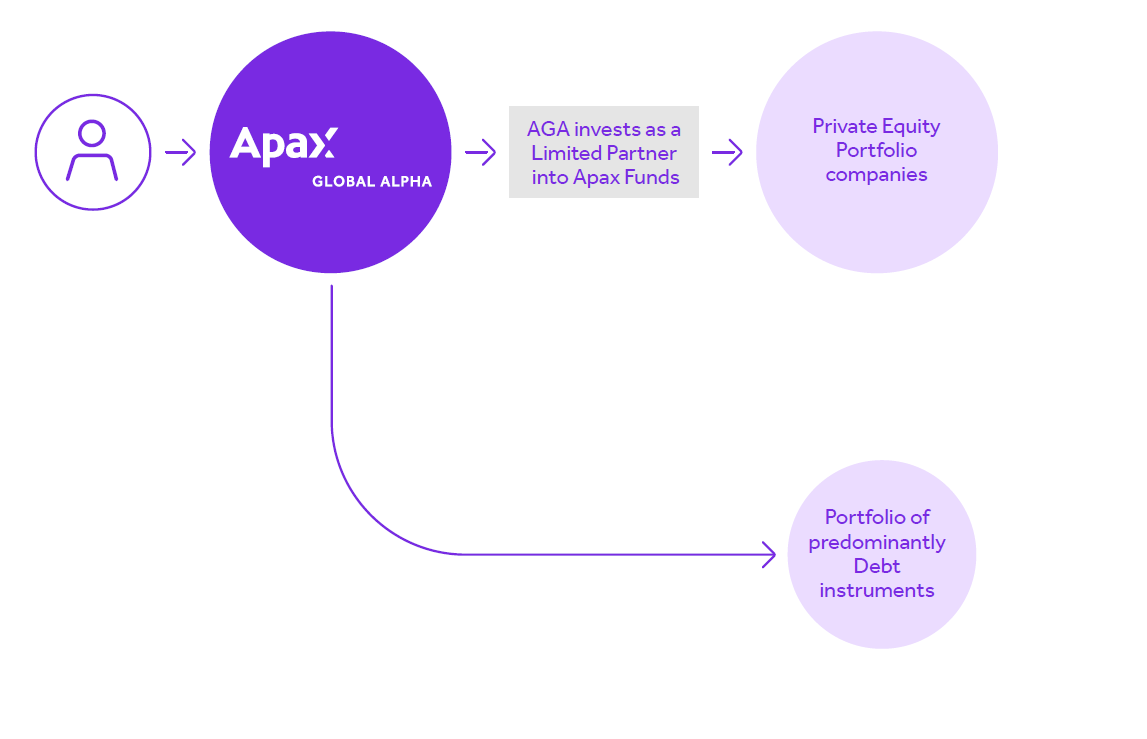
AGA offers access to a diversified portfolio of high-quality companies by investing in Private Equity Funds advised by Apax. These companies are identified and selected by the Apax team, leveraging their deep sector insights, and drawing on the firm’s 50-year experience.
Capital not invested in Private Equity is deployed into a portfolio of debt to generate income towards the dividend and additional returns.

Why invest in AGA?
We offer our shareholders access to a portfolio of ‘hidden gems’: carefully selected, and mostly private companies that they can’t buy elsewhere.
We have built a long track record of generating strong returns through this approach.
Public access to private companies


Some Trusts to research for an Accumulation portfolio, others are available. You need to check the spread and generally the higher the yield the bigger the risk perceived by the market. This is often wrong as the yield is driven by the price and the outcome on the reliability of the managements guidance.
SDCL Energy Efficiency Income Trust plc
(“SEEIT” or the “Company”)
Announcement of Interim Results for the six-month period ended 30 September 2024
SDCL Energy Efficiency Income Trust plc (LSE: SEIT) (“SEEIT” or the “Company”) today announces its financial results for the six-month period ended 30 September 2024.
Highlights
· Net Asset Value (“NAV”) per share of 90.6p as at 30 September 2024 (31 March 2024: 90.5p; 30 September 2023: 90.6p)
· Weighted Average Discount Rate of 9.4% levered, in line with March 2024 and September 2023.
· Investment cash inflow from the portfolio of £48 million on a portfolio basis (September 2023: £47 million)
· Aggregate dividends of 3.16p per share declared for the six months ended 30 September 2024, in line with guidance (September 2023: 3.12p)
· Dividend cash cover of 1.1x for the six months ended 30 September 2024 (September 2023: 1.1x)
· Target dividend guidance remains 6.32p per share for the year to March 2025, an increase of c.1%
· Profit before tax of £35 million for the six months ended 30 September 2024, up from a loss of £89 million in the equivalent period last year
· Portfolio valuation of £1,102 million as at 30 September 2024, (£1,117 million at 31 March 2024)
· Investment of c.£98 million into organic investments and existing commitments during the period (30 September 2023: £93m)
Tony Roper, Chair of SEEIT, said:
“We are pleased that both SEEIT’s operational and financial performance for the period were in line, or a little above budget and generated cash flows that fully underpinned the Company’s progressive dividend policy.
“We are strongly of the view that SEEIT’s share price does not reflect the value of its investments nor the cashflows derived from them. To this end, the Board and Manager remain focused on addressing the share price discount by supporting the marketability and liquidity of the Company’s shares.”

For He read She or any other colour of the rainbow.
The expected current dividends for 2025 are £8,900.
This figure should increase as Trusts increase their yearly dividend fcasts and as income is re-invested in the Snowball.
Current cash £770 and current dividends for December £1,085 when re-invested should provide income of around £150.00.
If any dividends are cut the dividends to be re-invested should act as a buffer for the Snowball but the only way to know is to keep watching and waiting.
Foresight Environmental Infrastructure – Looking to bounce back
- 02 December 2024
- QuotedData
Looking to bounce back
Foresight Environmental Infrastructure’s (FGEN’s – formerly JLEN Environmental Assets) recent results were a two-part affair, with its operational assets pumping out record cash receipts, but the NAV taking a hit as green hydrogen developer HH2E entered administration.
The failure of HH2E, which could not attract the required investment to bring forward its projects, exposes the risk of investing at an early stage of development in a nascent sector. However, the highly diversified nature of FGEN’s portfolio meant that the impact on NAV was just 2.6%.
The stability provided by FGEN’s successful operational portfolio, which makes up 92% of assets, enables it to take measured exposure to potential gains from construction-stage assets (see our profile on page 9). This gives the manager confidence that FGEN will bounce back strongly in time. The 10.4% dividend yield offers shareholders a compelling reason to wait.
Progressive dividend from investment in environmental infrastructure assets
FGEN aims to provide its shareholders with a sustainable, progressive dividend, paid quarterly, and to preserve the capital value of its portfolio. It invests in a diversified portfolio of environmental infrastructure projects generating predictable wholly or partially index-linked cash flows. Investment in these assets is underpinned by a global commitment to support the transition to a low-carbon economy.

| 12 months ending | Share price TR (%) | NAV total return (%) | Earnings per share (pence) | Adjusted EPS (pence) | Dividend per share (pence) |
|---|---|---|---|---|---|
| 31/03/2020 | 6.3 | (0.7) | (2.1) | 6.5 | 6.66 |
| 31/03/2021 | 6.9 | 1.5 | 1.5 | 6.7 | 6.76 |
| 31/03/2022 | 7.3 | 34.1 | 30.6 | 7.0 | 6.80 |
| 31/03/2023 | 12.2 | 13.1 | 14.9 | 6.7 | 7.14 |
| 31/03/2024 | (15.8) | (1.8) | (2.1) | 7.5 | 7.57 |
Source: Morningstar, Marten & Co
Interim results
FGEN, which was renamed from JLEN Environmental Assets Group in September, has announced interim results, reporting a total NAV of £720.1m or 109.8p per share at 30 September 2024 – a 3.3% fall over the six-month period. Factoring in dividends of 3.9p, this equated to a flat 0.04% NAV total return in the period.
The fall in NAV was largely attributable to the full write-down of its investment in HH2E, a developer of green hydrogen production projects in Germany that went into administration in November 2024. This knocked 2.6% off FGEN’s NAV (we cover the HH2E story in detail below).
Cash from operational assets at record high
Distributions received from projects were at a record high for the half-year of £46.6m (beating the previous record for the first half of its financial year of £46.2m set last year) and underpinned the dividend with a coverage of 1.23 times. The value of the portfolio fell £85.3m over the period, as shown in Figure 1, due mainly to portfolio sales and the write-down of the HH2E asset.
Figure 1: FGEN portfolio valuation in £m, as at 30 September 2024

Source: FGEN, Marten & Co
HH2E administration
FGEN invested £19.3m into HH2E
FGEN invested a total of €22.3m (£19.3m) into HH2E through Foresight Hydrogen Holdco GmbH. HH2E shareholders also included other funds managed by Foresight Group, HydrogenOne Capital Growth, and the remainder held by the founders and HH2E employees.
HH2E had been working towards the securing of a bankable offtake agreement for hydrogen production ahead of a Final Investment Decision for HH2E’s most advanced project at Lubmin, Germany.
FGEN decided against investing further capital in HH2E
A process to bring in senior lenders and an equity investor was run over the Summer of 2024, no party was prepared to invest prior to a bankable offtake agreement being in place. FGEN, along with Foresight Group, says that it gave consideration to providing further funding to allow HH2E to continue to meet its commitments, but the board decided against it due to risk and capital allocation considerations against the backdrop of the current market environment. With no other option for funding to meet outstanding obligations, HH2E filed for insolvency on 11 November.
FGEN’s investment of €22.3m (£19.3m) into HH2E, which represented 2.6% of NAV as at 30 September 2024, was mainly used to secure orders for long-lead-time equipment and develop HH2E’s first two green hydrogen sites at Lubmin and Thierbach.
FGEN does not expect to recover any of the capital
FGEN’s manager says that it does not expect to recover any of the capital it has invested in HH2E.
It is a disappointing end to a potentially profitable investment in the nascent green hydrogen sector. As we have written about in previous notes, green hydrogen has the potential to play a critical role in decarbonising industrial and heavy transport sectors. The manager says that it is still convinced that green hydrogen will play an important role in the clean energy agenda; however, it feels that the pace of development of the hydrogen market had not been as quick as originally expected and the projects were too early in the development stage to attract the required investment from institutional investors.
The manager adds that having already invested almost £20m it could not keep increasing its exposure while waiting for the offtake agreement to be signed. Given the quantum involved, the manager felt that it was too big a risk.
The investment in HH2E is the only development-stage investment in the FGEN portfolio (we detail construction stage assets, which make up 8% of the portfolio, in the asset allocation sector). The underlying performance of FGEN’s portfolio was strong, recording record cash of £46.6m over the six months to 30 September.
Market backdrop
Reaction to the budget and the HH2E news has seen FGEN’s discount widen to 32.2%
The budget announcement at the end of October caused gilt rates to increase in the UK, as concerns grew that Labour’s fiscal policies could prove to add inflationary pressures to the UK economy and interest rates would remain higher for longer than previously anticipated. This resulted in the share prices of alternative investment trusts, including FGEN, to fall from their already depressed levels, and discounts to widen further. FGEN’s discount at 28 November was 32.2% (from around 15% pre-budget – although the HH2E announcement likely played a large part too – see page 14 for more detail on FGEN’s discount).
Labour government positive for renewable energy sector
The change in UK government has been positive for the renewable energy sector, as evidenced by planning restrictions for onshore wind in England being loosened and the 50% increase in the CFD budget (the government’s primary mechanism for supporting new low carbon power infrastructure, which works by guaranteeing a set price for electricity that generators receive).
The fundamental growth story for the sector remains strong, with supportive green energy transition policies from most global governments (especially in the UK and Europe) requiring trillions of pounds of investment over the next 20 years.
Other drivers of returns
Outside of the HH2E write-down, the other factors that impact FGEN’s NAV were relatively stable over the past six months. We detail these factors and their sensitivities below, beginning with power prices.
Power prices
Power prices have been relatively stable over the last six months, having fallen back significantly following extraordinary highs during 2022 and early 2023, as shown in Figure 2.
Figure 2: UK power prices

Source: Bloomberg – UK baseload
The marginal change in forecasts for future electricity and gas prices compared to forecasts at 31 March 2024 increased FGEN’s NAV by £0.2m in the six months to the end of September 2024.
Fixed prices secured on the majority of portfolio
FGEN looks to de-risk its exposure to volatile market prices and has fixed prices for the majority of its output. At 30 September 2024, the portfolio had price fixes secured at 60% for the Winter 2024/25 season and 43% for Summer 2025 season.
The war in Ukraine (heightened by the US permitting Ukraine the use of US long-range missiles into Russian territory) and the rapidly escalating Middle East crisis could create further volatility for oil and gas prices with risks to the valuation related to power price assumptions both to the upside and the downside.
An increase in electricity and gas prices of 10% would add £41.1m (or 6.3p) to NAV and a 10% fall in power prices would take off £39.0m (or 5.9p).
FGEN’s manager states that in the extreme event that electricity prices more than halved to £40/MWh (they are currently at around £85/MWh), the company would maintain a resilient dividend Scover for the next three financial years, albeit with reduced headroom by year three.
Discount rates
UK gilt yields have remained at elevated levels for a sustained period since government borrowing costs rose sharply in 2021 and 2022, as shown in Figure 3.
Figure 3: Long-term (10-year and 30-year) UK gilt yields

Source: Bloomberg, Marten & Co
The weighted average discount rate now sits at 9.5%
No macro drivers or project-specific factors prompted changes to the discount rates used to value FGEN’s portfolio over the six months to 30 September 2024. However, FGEN’s weighted average discount rate moved out slightly to 9.5% (from 9.4%). This was primarily due to an increase in the value of assets in construction (which are valued using higher discount rates to reflect the increased risk versus operational assets).
There was no change to NAV resulting from changes to the discount rate.
A reduction in the discount rate of 0.5% would result in an uplift in value of £23.8m (or 3.6p per share), while a downward movement in the portfolio valuation of £22.9m (3.5p per share) would occur if discount rates were increased by the same amount.
Inflation
Inflation assumptions remained static
60% of FGEN’s forecasted revenues are contractually linked to inflation (as measured by the RPI) through government-backed subsidies and long-term contracts. Inflation assumptions used to value FGEN’s portfolio (based on actual data and independent forecasts) remained the same at 3.5% RPI inflation for 2024, reverting to 3% until 2030, and then falling to 2.25% thereafter. This resulted in no movement in FGEN’s NAV over the six-month period to the end of September.
Figure 4: UK RPI year-on-year (%)

Source: ONS, Marten & Co
Figure 4 shows that RPI inflation rose to 3.4% in October 2024; however, the potential for inflation to increase further following the chancellor’s budget at the end of October has grown. FGEN’s sensitivity to changes in the inflation rate is about +£21.6m or 3.3p on the NAV for every 0.5% increase in the forecast inflation rate and a decrease of £21.9m or 3.3p on the NAV if rates were reduced by the same amount.
Taxation
As we discussed in more detail in previous notes (links to which can be found on page 15), the UK government introduced a temporary windfall tax on electricity generators – the Electricity Generator Levy (EGL) – in response to higher energy prices. FGEN’s wind, solar and biomass assets are affected by the levy, which saw the government take 45% of revenues above a price of £75/MWh from 2023 to April 2024, and thereafter adjusted each year in line with inflation (as measured by CPI) on a calendar-year basis until the levy comes to an end on 31 March 2028.
A sum of £3.3m was set aside for the EGL tax in FGEN’s latest interim accounts. This compared to £5.2m in the same period in 2023. The manager estimates that the annual liability for the 2025 financial year will be lower, reflecting the drop in power price forecasts year-on-year.